Multiple ring nebulae around blue supergiants
Abstract
Context. In the course of the life of a massive star, wind-wind interaction can give rise to the formation of circumstellar nebulae which are both predicted and observed in the nature.
Aims. We present generic model calculations to predict the properties of such nebulae for blue supergiants.
Methods. From stellar evolution calculations including rotation, we obtain the time dependence of the stellar wind properties and of the stellar radiation field. These are used as input for hydro-calculations of the circumstellar medium throughout the star’s life.
Results. Here, we present the results for a rapidly rotating 12 single star. This star undergoes a blue loop during its post main sequence evolution, at the onset of which its contraction spins it up close to critical rotation. Due to the consequent anisotropic mass loss, the blue supergiant wind sweeps up the preceding slow wind into an hour glass structure. Its collision with the previously formed spherical red supergiant wind shell forms a short-lived luminous nebula consisting of two polar caps and a central inner ring. With time, the polar caps evolve into mid-latitude rings which gradually move toward the equatorial plane while the central ring is fading. These structures are reminiscent to the observed nebulae around the blue supergiant Sher 25 and the progenitor of SN 1987A.
Conclusions. The simple model of an hour glass colliding with a spherical shell retrieves most of the intriguing nebula geometries discovered around blue supergiants, and suggests them to form an evolutionary sequence. Our results indicate that binarity is not required to obtain them.
Key Words.
-hydrodynamics - ISM: bubbles - Stars: winds,outflows - Stars: supergiants1 Introduction
During the course of their evolution, massive stars have strong winds which eject matter into their surroundings. During their post-main sequence evolution, these stars can move back and forth from the blue to the red side of the Hertzsprung-Russell (HR) diagram and back to the red, with little time spent at intermediate effective temperatures (e.g., Langer 1991b ()). Hydrodynamic considerations imply that each such transition does produce a circumstellar shell: When the star moves from the blue to the red side of the HR diagram, the slow red supergiant (RSG) wind will be stalled by the high pressure of the previously created hot wind bubble, and will accumulate into a shell at the location where this pressure equals the RSG wind ram pressure (García-Segura et al. 1996b ()). We call such a more or less stationary shell the RSG shell. When the star moves from the red to the blue side of the HR diagram, the wind speed increases and the blue supergiant (BSG) wind plows up the preceding RSG wind into a rapidly expanding shell, which we call the BSG shell.
Consequently, we expect a spectacular circumstellar phenomenon for stars undergoing so called blue loops, namely that it triggers the formation of an expanding BSG shell, which will at some point smash into the previously formed stationary RSG shell. While both, the RSG and the BSG shell by itself, may be difficult to observe, their violent interaction may release enough energy to provide an observable nebula.
Despite this simple and intriguing expectation, there are so far only few attempts to obtain quantitative prediction for the outcome of the described shell interaction (see Blondin et al. 1993 (1993), Martin et al. 1995 (1995), Podsiadlowski et al. 2005 (2005)). Within an effort to describe this phenomenon through generic calculations, which use detailed stellar evolution models as input for the circumstellar hydrodynamic modeling (Chiţǎ et. al., in preparation), we focus here on the results for a rotating 12 single star.
2 Computational method
As input for our circumstellar hydrodynamic calculations, we use the results of a stellar evolution calculation for a star of 12 and a metallicity of . Specifically, we utilize Model F12B from Heger & Langer (2000 (2000)), which has an initial rotational velocity of 328 . The code used to compute this model includes OPAL opacities, detailed nuclear networks, mass loss according to Nieuwenhuijzen & Jager (1990 (1990)), the physics of rotation for the stellar interior, and rotationally modulated stellar winds, as described in Heger, Langer & Woosley (2000 (2000)).
| Phase | t | M | p | E |
| yr | erg | |||
| MS | 19200 | 0.43 | 396 | 1480 |
| RSG I | 825 | 0.33 | 71 | 38 |
| RR | 25 | 0.02 | 7.2 | 6.0 |
| BSG | 550 | 0.11 | 52 | 68 |
| RSG II | 225 | 0.13 | 25 | 12 |
The evolution of the stellar model in the HR diagram is show in Fig. 3. At core-H exhaustion, it moves to the RSG regime where it remains for 825 000 yrs (60 % of the core-He burning life time), before it undergoes a blue loop. It then stays in the BSG regime of the HR diagram for the remaining part of core helium burning, before it moves back to the RSG regime where it explodes as a Type II supernova.
As shown by Heger & Langer (1998 (1998)), as the convective envelope retreats during the onset of the blue loop, all its angular momentum is concentrated in a small amount of mass in the top layers of the star by the time convection vanishes. Blue loops therefore provide a natural way to bring the stellar surface to close to critical rotation. This does also happen in our chosen stellar model (Fig. 4). The limit of critical rotation is reached during the red-blue transition, which produces a brief period of strong, slow and anisotropic mass loss (Table 1). The strong mass loss then reduces the rotation rate of the stellar surface (Langer 1998 (1998)), and the star settles at a rotation velocity of about 50 in the BSG regime.
To simulate the evolution of the circumstellar matter (CSM) we use the ZEUS 3D code developed by Stone & Norman (1992 (1992)) and Clark (1996 (1996)). ZEUS 3D is an explicit non-conservative code that solves the hydrodynamical equations as partial, finite difference equations on a fixed, staggered mesh grid. Radiatively optically-thin cooling is included by solving the energy equation implicitly according to Mac Low et al. (1989 (1989)), and by using the plasma cooling curve of MacDonald & Bailey (1981 (1981)). We compute the evolution of the CSM during the main sequence and the early RSG stage in 1D, with 4500 grid points over a radius of 45 pc, and we assume an interstellar medium density of 1 cm-3. After 100 000 yr into the first RSG stage, we map the 1D model onto a 2D spherical grid to compute its further evolution. The inflow inner boundary condition is applied at 0.025 pc, and the outer boundary remained at 45 pc. The radial component of the grid is resolved with 1000 grid points, where 900 grid points are used for the inner 5 pc, and 100 grid points for the outer 40 pc. The angular coordinate of 90 degrees is resolved with 200 grid points. The method used here was applied before by García-Segura et al. (1996 (1996), 1996a () and 1996b ()) and van Marle et al. (2005 (2005) and 2007 (2007)).
We are using the time dependent mass loss rate and the terminal wind speed from the stellar evolution model as input in our central mesh point for the hydrodynamic calculations. The wind speed is obtained from the stellar escape velocity using the scaling proposed by Eldridge (2005 (2005)). The wind anisotropy is described using the equations of Bjorkman & Cassinelli (1993 (1993)), as in Langer et al. (1999 (1999)). For near-critically rotating stars, this provides a slow and dense equatorial outflow, and a fast wind in polar directions. We note that while the Bjorkman-Cassinelli mechanism has been criticized in the context of line driven winds (Owocki et al. 1996 (1996)), it is unclear whether line driving does play a major role in the situation of near-critical rotation.
The effect of photoionization was included in the simulations by calculating the Strömgren radius along each radial grid line as described in García-Segura et al. (1999 (1999)) and van Marle et al. (2005 (2005), 2007 (2007) and 2008 (2008)). The number of ionizing photons is computed according to the effective temperatures and surface gravities of the stellar evolution model, by interpolating in a grid of model atmospheres for massive OB stars of solar metallicity computed with the FASTWIND non-LTE code (Puls et al. 2005 (2005)) as described in Lefever et al. (2007 (2007)).
3 Results

During its main sequence phase our 12 star creates a hot bubble in the interstellar medium which, at core hydrogen exhaustion, is characterized by a radius of 30 pc and an internal energy density of cm-3. Once the star has become a RSG, a slow (), dense and isotropic wind is injected into the computational domain (Fig. 4). This RSG wind accumulates at a distance of pc where its ram pressure is balanced by the hot bubble pressure, and forms a RSG shell (cf. García-Segura et al. 1996b ()). At the end of the first RSG phase, this shell contains about . It is rather extended (pc), and its central parts have condensed due to cooling.
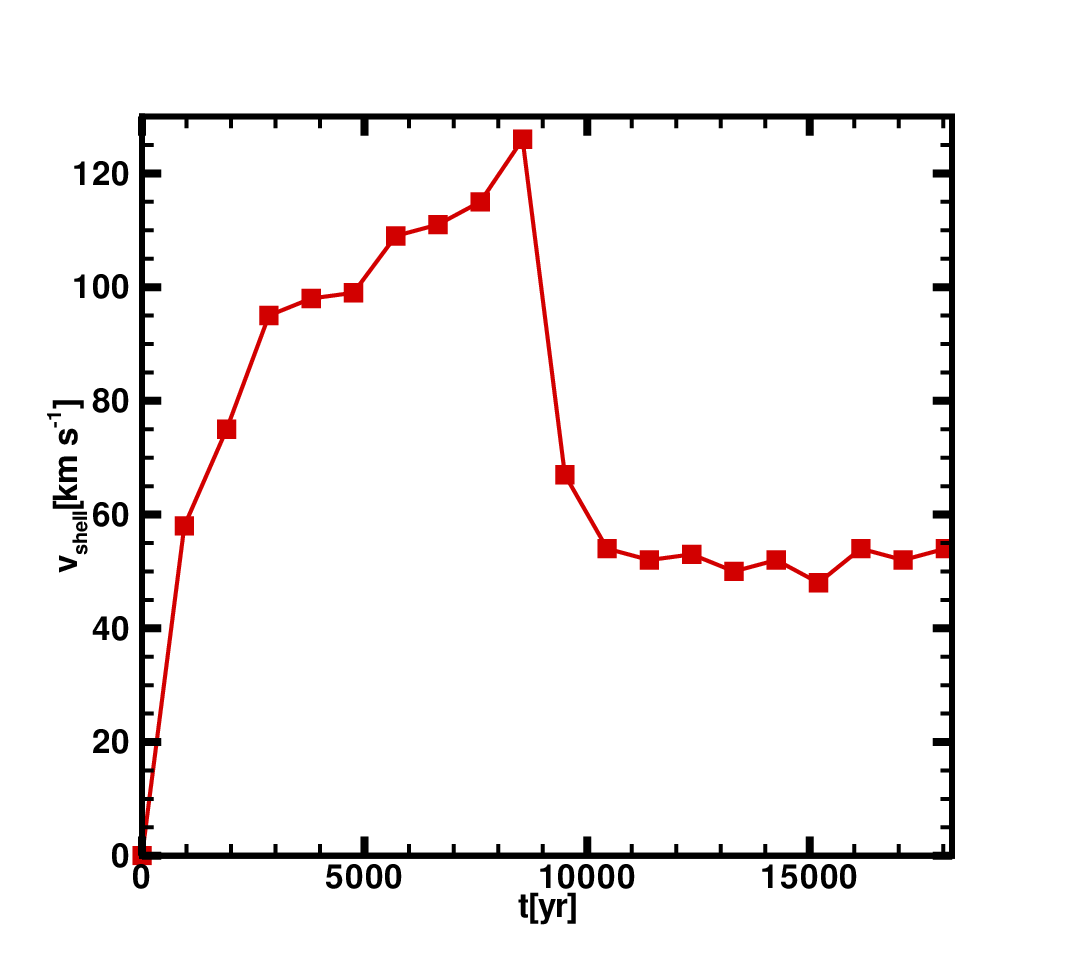
At the onset of the blue loop, the central star reaches close-to-critical rotation, and ejects a dense equatorial disk (Heger & Langer 1998). While mass and time scales differ, this phenomenon occurs quite analogous to the simulation of the outburst of Carinae by Langer et al. ( 1999 (1999)). Like in this case, the ensuing BSG wind sweeps up the preceding slow wind material into an “hour glass” structure (Fig. 6). On a time scale of a few yr, this hour glass expands into the sphere defined by the RSG shell, with a maximum velocity of 130 (Fig. 5). The faster polar parts of the hour glass hit the inner edge of the RSG shell first. The collision creates a hot ( K) and dense (cm-3) pair of polar caps. As time proceeds, the collision zone moves to lower latitudes of the RSG shell and becomes more confined in latitude. At the same time, the interaction of the BSG wind with the equatorial disk defines a second, ring shaped collision zone in the equatorial plane, which expands with time with a velocity of 18.
Figure 1 shows snapshots of the emissivity map, according to the employed cooling curve in our hydro simulations, for three slices in time, along with projection maps constructed from rotationally symmetric 3D-structures obtained from the 2D maps. Here, only emission from gas in the temperature range between K and K is considered, which is the dominant component. Hotter gas, which is formed from the reverse shock of the collision, might be observable in the X-ray regime; the peak luminosity of this component in our model is erg s-1, which is achieved about 50 000 yr after the onset of the collision. At an early interaction stage, the radiation is dominated by two polar caps and one equatorial ring, later on by two mid-latitude rings and one fading smaller equatorial ring, and finally two mid-latitude rings at rather low latitude are visible. Those two rings gradually move to the equatorial plane while fading. The full time dependence of the emission structure is shown in an accompanying movie which is available from the A&A website.
The energy budget for the collision of the polar caps of the hour glass with the RSG shell follows directly from the stellar properties. The polar caps have an emissivity of erg cm-3 s-1 in a volume of cm3 (with pc and pc; see Figure 1). Thus, they shine with a total luminosity of erg s-1, i.e. roughly one solar luminosity, with a time scale of yr, where is the internal energy of the gas, and K and cm-3 (corresponding to g cm-3; Fig. 6). The total radiated energy of the polar caps is about erg. This corresponds well to the kinetic energy release due to the braking of the polar caps, which reach their maximum velocity of at the time of collision, where it is reduced to (Fig. 5). That is, erg, with and . This kinetic energy can be compared with the BSG wind kinetic energy, which, for and (Fig. 4), yields erg over a time period of 9000 yr. Thus, the polar caps shine because the hour glass shaped BSG shell collides with the spherical RSG shell.
A similar consideration could be made for the inner ring, which is produced by the collision of the BSG wind with the equatorial disk ejected by the central star during the phase of near critical rotation. The disk properties depend on the wind properties of the star during this phase. However, in particular their latitude dependence, can not be expected to be reliably predicted within the current assumptions. The total mass of the disk is determined by the mass loss of the star at critical rotation.
4 Discussion

Figure 2 illustrates a simplified picture of the formation of multiple ring nebulae, according to our model. It contains two kinematic components: a stationary, spherical RSG shell and an expanding hour glass structure. The strongly emitting parts of the structure are the collision surfaces, which are marked in red in the figure. We believe that both kinematic components are realized by nature in the circumstellar medium of massive stars. RSG shells are unambiguously predicted (García-Segura 2007 (2007)) and while they are not yet observationally confirmed, there seems to be no way to avoid their formation. Expanding hour glass structures, on the other hand, are a well documented feature in circumstellar nebulae of low and high mass stars (see Nota et al. 1995 (1995); Langer et al. 1999 (1999)) and are thought to be confined by a circumstellar disk in the equatorial plane of the central star.
A number of predictions emerge from this simple model. First, the collision starts about 104 yr after the onset of the blue loop. This timing is set by the expansion speed of the BSG shell and the radius of the RSG shell. Second, the life time of the nebula is determined by the duration of the collision phase, as the emission time scale is shorter than that. In our example, this is about yr, or about 1% of the core helium burning life time. This provides an upper limit to the expected number of triple ring nebulae. Third, the rotation rate of the central star during the collision is high for a BSG, since it just about recovers from critical rotation. At the time of maximum brightness of the nebula, the equatorial rotation rate of our central star is about 80 (Fig. 4). Fourth, as all the material in the nebula is ejected after the first dredge-up phase of the central star, the nebula material is nitrogen-rich, here enhanced by a factor of 6.5, and carbon and oxygen depleted by factors of 6.5 and 1.5, respectively. We note that the level of N-enrichment predicted by current stellar evolution models is quite uncertain (see Hunter et al. 2008 (2008)), but a RSG phase is still expected to produce some nitrogen enhancement. Due to the assumptions of efficient rotational mixing (Heger & Langer 2000 (2000)), the star and nebula in our model are more enriched than expected from non-rotating stellar models. Fifth, one ingredient of our simple model, namely the RSG shell, is expected for massive stars, but not so for low mass star which produce planetary nebulae. Therefore, while quite analogous expanding hour glass structures are observed for both cases (Langer 2000 (2000)), multiple ring nebulae formed through the collision process shown in Fig. 2 are expected around massive stars, but not as planetary nebulae. In this sense, the polar caps observed around the blue supergiant Sher 25 might be considered as the first indirect empirical confirmation of a RSG shell.
Previous models of multiple ring nebulae were mostly constructed in the context of the triple-ring structure observed around SN 1987A (Burrows et al. 1995 (1995); Crotts & Heathcote 2000 (2000)). While single star models often fail to explain important features (e.g., Martin & Arnett 1995 (1995); Meyer 1997 (1997); Woosley et al. 1997 (1997)), many invoke rather complex binary phenomena (e.g., Podsiadlowski et al. 1991 (1991); Blondin & Lundqvist 1993 (1993); Llyod et al. 1995 (1995); Morris & Podsiadlowski 2005 (2005)). Whereas we do not attempt to reproduce the circumstellar medium of SN 1987A, a single star approach with suitable choices for the major parameters in our model (initial mass, initial rotation rate, metallicity) appears promising and will be pursued in the near future. The current failure of single star models to produce suitable blue loops and blue supergiant pre-supernova models may have to do more with missing physics in stellar evolution models rather than supporting the evidence for a binary progenitor of SN 1987A (Woosley et al. 1997 (1997))
Various multiple ring nebulae around blue supergiants have been observed in the last 20 years (Smith et al. 2007 (2007)). While our generic numerical model was not designed to correspond to any of them, many of the general properties of these nebulae are well reproduced. Most striking is the agreement of the emission geometries. While the nebula around the B1.5 Ia supergiant Sher 25 shows two polar caps and one equatorial ring (Brandner et al. 1997 (1997)) and the other objects discussed by Smith et al. 2007 (2007) rather show narrow rings, including the “twin” of the SN 1987A nebula around HD 168625 (Smith 2007 (2007)) all these structure occur as an evolutionary sequence in our model. Expansion velocities of the inner ring () and the outer collision products (), the spatial scale of about 1 pc, and the kinematic nebula age agree rather well with empirical values. The rotation velocity of our stellar model fits well to the derived value of for Sher 25 (Hendry et al. 2008 (2008)). Central star and nebula of our model are nitrogen enriched, as are most of the observed nebulae.
We note that the emission in our model is caused by compressional heating, which may be in conflict with evidence for photoionization being the dominant process in some observed multiple ring nebulae (see Smith et al. 2007 (2007)). And indeed, looking at the density distributions shown in Fig. 6, which might resemble emission geometries in the pure photo-ionization case, the situation appears more complex. In our simulation, the thick RSG shell (pc) collapses in two parts (at pc and ) due to a cooling instability. However, this collapse is questionable since it requires a long timescale — our shell has an age of close to yr, while in many cases the shell will be much younger at the time of collision —, and since the employed cooling function is uncertain for temperatures below K. Without this collapse, its density would be only about g cm-3 (or 0.1 particles/cm3), which may render it unobservable even if it were photoionized. However, even in the case of the collapsed RSG shell as in our simulation, the collision leads to a clear density enhancement. In panel 2 of Fig. 6, we see that in our model, the density enhancement in the polar caps is about a factor 5. This is to be considered a lower limit, as higher resolution models might approach the theoretically expected enhancement factor of about 100, which follows from the (well realized) isothermal shock approximation and a Mach number of about 10. The lower panels of Fig. 6 show that in order to represent the rings of SN 1987A, further refinements are required, which, as we think, might be achieved by altering the properties of the RSG shell. For this particular case, this may indeed be justified, as the life time of the final RSG stage of the progenitor of SN 1987A might have been quite short (Woosley 1988 (1988), Langer 1991a ()).
Despite that our model does not fit any of the observed cases in detail, the approximate agreement with most general properties of this class of objects encourages to produce tailored models for individual nebulae as next step. Our results indicate that stars with multiple ring nebulae might just have left the RSG branch — as stellar evolution models argued for the case of SN 1987A (Woosley 1988 (1988), Langer 1991a ()) and furthermore, that binarity may not be required to obtain multiple ring emission geometries.
Acknowledgements.
We are grateful to the anonymous referee for helpful remarks which lead to significant improvements of this paper. We would like to thank Karolien Lefever for providing us with a grid of atmospheric models for hot stars. We would like to thank Anthony Marston, Nathan Smith and Bob van Veelen for helpful discussions. A.J.v.M. acknowledges support from NFS grant AST-0507581. AH was supported by the DOE Program for Scientific Discovery through Advanced Computing (SciDAC; grants DOEFC02- 01ER41176 and DOE-FC02-06ER41438) and performed this work under the auspices of the National Nuclear Security Administration of the U.S. Department of Energy at Los Alamos National Laboratory under Contract No. DE-AC52-06NA25396. This work was supported by the Dutch Stichting Nationale Computerfaciliteiten (NCF).References
- (1) Bjorkman, J.E. & Casinelli, J.P. 1993, ApJ, 409, 429
- (2) Blondin, J.M. & Lundqvist, P. 1993, ApJ, 405, 337
- (3) Brandner, W., Grebel, E. K., Chu, Y.H. & Weis, K. 1997, ApJ, 475, L45
- (4) Burrows, C.J., Krist, J., Hester, J. Jeff et al. 1995, ApJ, 452:680
- (5) Clark, D.A. 1996 ApJ, 457, 291
- (6) Crotts, A.P.S & Heathcote, S.R. 2000 ApJ, 528, 426
- (7) Eldridge, J.J., Genet, F., Daigen, F. & Mochkovitch, R. 2005, MNRAS, 367, 186
- (8) García-Segura,G. & Franco, J. 1996, ApJ, 469, 171
- (9) García-Segura,G., Mac Low, M.M. & Langer, N. 1996a, A&A, 305, 229
- (10) García-Segura,G., Langer, N. & Mac Low, M.M. 1996b, A&A, 316, 133
- (11) García-Segura,G., Langer, N., Różyczka, M. & Franco, J. 1999, ApJ, 517, 767
- (12) García-Segura,G. 2007, JKAS, 40, 147
- (13) Heger, A., Langer, N. 1998, A&A, 334, 210
- (14) Heger, A., Langer, N., Woosley, S.E. 2000, ApJ, 528, 368
- (15) Heger, A., Langer, N. 2000, ApJ, 544, 1016
- (16) Hendry, M.A., Smartt, S.J., Skillman, E.D. et al. 2008, submitted arXiv:0803.4262
- (17) Hunter, I., Brott, I., Lennon, D.J. et al. 2008, ApJL, 676, L29
- (18) Langer, N. 1991a, A&A, 243, 155
- (19) Langer, N. 1991b, A&A, 252, 669
- (20) Langer, N. 1998, A&A, 329, 551
- (21) Langer, N. 2000 Science, 287, 2430
- (22) Langer, N., García-Segura,G. & Mac Low, M.M. 1999, ApJ, 520L, 49L
- (23) Lloyd, H.M., O’Brien, T.J & Kahn, F.D. 1995, MNRAS, 273, L192
- (24) Lefever, K., Puls, J. & Aerts, C. 2007, A&A, 463, 1093
- (25) MacDonald, J. & Bailey, M.E. 1981, MNRAS, 197, 995
- (26) Mac Low, M.-M., McCray, R. & Norman, M.L. 1989, ApJ, 337, 141
- (27) Martin, C.J. & Arnett, D. 1995, ApJ, 447, 378
- (28) Meyer, F. 1997, MNRAS, 285, L11
- (29) Nieuwenhuijzen, H. & Jager, C. 1990, A&A, 231, 134
- (30) Nota, A., Livio, M., Clampin, M.& Schulte-Ladbeck, R. 1995, ApJ, 448, 788
- (31) Owocki, S., Cranmer, S.R. & Gayley, K.G. 1996, ApJL, 472, L115
- (32) Podsiadlowski, P., Fabian, A.C. & Stevens, I.R. 1991, Nature, 354, 43
- (33) Podsiadlowski, P. & Morris, T.S. 2006, ASP, Conf.series, Vol.355, p.259,Stars with B[e] Phenomenon, Eds. M.Kraus & A.S.Miroshnichenko
- (34) Puls, J., Urbaneja, M.A., Venero, R. et al. 2005, A&A, 435, 669
- (35) Smith, N. 2007, AJ, 133, 1034
- (36) Smith, N., Bally, J. & Walawender, J 2007, AJ, 134, 846
- (37) Stone, J.M. & Norman, M.L. 1992, ApJS, 80, 753
- (38) van Marle, A.J., Langer, N.,García-Segura,G. 2005, A&A, 444, 837
- (39) van Marle, A.J., Langer, N.,García-Segura,G. 2007, A&A, 469, 941
- (40) van Marle, A.J., Langer, N., Yoon. S.-C.,García-Segura,G. 2008, A&A, 478, 769
- (41) Woosley, S.E. 1988, ApJ, 330, 218
- (42) Woosley, S.E., Heger, A., Weaver, T.A. & Langer, N. 1997, astro-ph/9705146
A
Appendix A Additional information