Slip and flow of hard-sphere colloidal glasses
Abstract
We study the flow of concentrated hard-sphere colloidal suspensions along smooth, non-stick walls using cone-plate rheometry and simultaneous confocal microscopy. In the glass regime, the global flow shows a transition from Herschel-Bulkley behavior at large shear rate to a characteristic Bingham slip response at small rates, absent for ergodic colloidal fluids. Imaging reveals both the ‘solid’ microstructure during full slip and the local nature of the ‘slip to shear’ transition. Both the local and global flow are described by a phenomenological model, and the associated Bingham slip parameters exhibit characteristic scaling with size and concentration of the hard spheres.
pacs
82.70.y, 83.50.-v, 83.60.-a, 83.85.EiWall slip in fluid flow has received considerable attention for many years [1, 2, 3, 4, 5, 8, 6, 7, 9, 10, 11, 12, 13]. Even for simple fluids it has been realized that the no-slip boundary condition may be inappropriate on length scales relevant for nanoporous media or nanofluidics [1]. More widespread is the presence of slip in complex fluids like suspensions and emulsions [2, 3, 4, 5, 8, 6, 7, 9, 10, 11, 12, 13]. Despite the more accessible length scales in these systems, it has remained challenging to gain microscopic insight into the nature of slip and understand its dependence on material composition, wall properties and flow rate. Recently, considerable progress has been made for soft particle pastes [7], but for hard sphere (HS) suspensions the situation remains unclear. Slip was observed both in solid- [11, 12] and liquid-like [13] particulate suspensions, but its possible relation to Brownian motion and the glass transition was mostly ignored.
Experimentally, a proper interpretation of slip requires not only precise rheological data but also detailed spatial characterization of the flow. Various imaging methods have been employed the last decades [5, 7, 14, 13, 15, 16]; however they either lack the resolution to study flow near the wall on the single particle level [5, 7, 14, 13], or they do not provide simultaneous rheological and microscopic information on the same sample [15, 16].
Here, we use confocal imaging in a cone-plate rheometer to address slip and yielding of dense HS colloids on both the microscopic and macroscopic scales. Slip appears as a yield stress emerges on entering the glass regime, with plug-flow persisting down to the colloid-wall interface. We find a ‘Bingham’ slip response, unlike emulsions [7]. The physics of slip is thus not universal between different classes of soft glassy materials.
We used polymethylmethacrylate colloids of various radii ( nm, nm, nm, polydispersity , all from light scattering), stabilized with poly-12-hydroxystearic acid, suspended in a mixture of decalin and tetralin (viscosity mPas) for refractive index (RI) matching and seeded with of fluorescent colloids of the same kind ( nm) for confocal imaging. In these solvents, the colloid interaction is very nearly HS-like [17]. Batches of different volume fractions were prepared by diluting samples centrifuged to a random close packed sediment, taken to be at [18]. When comparing data from different colloid sizes, however, we report results in the reduced variable , which is independent of the numerical value of .
Measurements were performed in a controlled stress rheometer (AR2000, TA Instr.) in cone-plate geometry (radius mm, cone angle ) with a modified base on which a glass slide (radius mm, thickness m [19], local roughness nm from AFM) is mounted. A solvent trap minimizes evaporation. By coupling in a piezo-mounted objective (, oil immersion) and optics via an adjustable arm connected to a confocal scanner (VT-Eye, Visitech Int.) we measure the velocity profile (with the velocity-gradient direction) from movies taken at - m intervals at a frame rate Hz at various distances from the cone center, Fig. 1(a). To prevent slip, both the glass and the cone can be made rough on the colloid scale by spincoating a suspension and sintering the resulting disordered colloidal monolayer. Experiments with both smooth and coated glass plates were performed; the cone is always coated to ensure stick boundary conditions at the top. All data were collected with controlled applied shear rate (going from high to low ) but stress controlled measurements gave the same results.
We first discuss how the rheology depends on and the wall conditions. Fig. 1(b) presents the measured stress versus for coated and uncoated glass slides at various for nm. For a concentrated fluid () below the colloidal glass transition ( from mean squared displacement measurements) we find linear behavior at the smallest and shear thinning at higher , independent of boundary condition.
However, for the coated and uncoated results differ markedly. With coated glass and cone, we observe (as before, [20]), Herschel-Bulkley (HB) behavior: , with the yield stress. For , shear localization occurs for , to be discussed elsewhere [21]. On the other hand, for the smooth surface, shows two regimes. For stresses somewhat below , we find apparent flow described by , Fig. 1(c), with a threshold and an effective viscosity (regime I). As explained below, this corresponds to full wall-slip and solid-body rotation of the sample over the entire geometry. This ‘Bingham’ slip differs from non-Brownian suspensions [12], where no threshold is seen. It is also distinct from the behavior in soft particle pastes [7]. In regime II, deviates from the Bingham form, the sample starts to yield and approaches the HB curve.

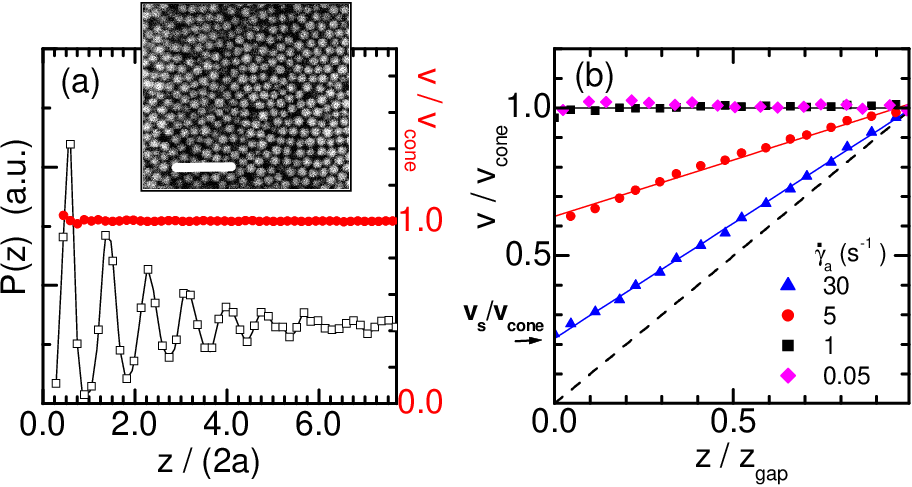
To check if the slip in regime I reflects full sliding from the first colloid layer or, instead, local yielding of the structure near the wall, we used the fluorescent batch ( nm, ) and performed 3D imaging and tracking [22] of the flow directly above the glass. The density profile, Fig. 2(a), shows that the surface induces layering. Nevertheless, the corresponding microscopic velocity profile, Fig. 2(a), reveals full sliding with respect to the glass, with down to the first layer and no yielding. Further analysis (data not shown) confirmed that colloids remained caged. The data are unchanged for an RI and density matching solvent, i.e. sedimentation is not affecting these larger particles. Moreover, as the large and small particles display the same Bingham response in Regime I (data not shown), we expect that the behavior in Fig. 2 is particle size independent.
We now turn to the velocity profiles associated with the rheology in Fig. 1(b). Fig. 2(b) presents at a distance mm from the center of the cone for at various . We observe linear profiles for all but with a finite slip velocity, defined as the intercept of , and a slope corresponding to a bulk shear rate . On reducing , the profiles exhibit increasing slip and eventually show a transition to plug flow, , , as in Fig. 2(a). For , around the transition, we observe shear localized near the cone, while away from the cone we have plug flow with down to the plate. Somewhat below , we again find , see Fig. 2(a).
As seen for the profile at s-1 in Fig. 2(b), plug flow can occur locally even when the global flow curve is close to that for rough walls. To bring out the behavior as function of when entering regime II, we show in Fig. 3(a) the local shear rate obtained from imaging at various distances at fixed s-1. Solid body rotation () is present at small , while for larger . This evidences that, at fixed , the stress is -dependent [3], even where the sample has yielded.

The local and global rheology described above can be rationalized using a simple model similar to [3, 12]. First, as suggested by the phenomenology of the data in Figs. 1(b),(c), we relate the local stress to the slip velocity of the colloids along the wall by:
| (1) |
with a hydrodynamic term and a threshold stress . For the bulk flow, we use the HB form with :
| (2) |
The local bulk shear rate and are related by:
| (3) |
We solve the flow by approximating, at each , the cone-plate as parallel plates with a gap and balancing the stress in the bulk and at the wall. For , and the stress is given by Eq. (1). Shear starts when the local stress induced by slip exceeds , i.e., when , which in a cone-plate is equivalent to . Slip and shear are then both present, and balancing the stress in Eqs. (1),(2) gives . The measured stress is thus:
| (4) |
with for , while for we have:
| (5) |
The transition from regime I to II occurs when , i.e. for and . Eq. (4) also gives the relation . A calculation of the radial shear reveals that the parallel plate approximation is valid for all except .

To test this model, we extracted the parameters and from the smooth and rough wall flow curves respectively, for various and . Figure 4 shows the dependence of , which we discuss later. We verified the form using different cones. The predictions for the smooth-wall flow curves, using Eq. (4) and the extracted parameters, agree well with measurements; an example is shown in Fig. 1(b). Additionally, Eqs. (3),(5) reasonably describe the -dependence of the local shear rate in Fig. 3(a); the predicted curve follows directly from the rheological parameters, without fitting. We also test the dependence of the local shear rate on by plotting the reduced local shear rate versus the reduced applied rate , Fig. 3(b). With this normalization, our model predicts a master curve . The data indeed follow this behavior for various and , lending strong support for our model. For discrepancies can occur for smaller , e.g. due to localized shear near the cone around yielding [21, 23].
Summarizing thus far, a HS colloidal suspension driven along a smooth wall shows slip for , where a finite yield stress appears. The global and local rheology at different concentrations and colloid sizes in a cone-plate geometry are described by a model with a Bingham relation between the local stress and slip velocity, which should be applicable to flow of HS’s in other geometries. As evidenced in Fig. 2, the Bingham form is associated with plug flow down to the first colloid layer.
The slip parameters and in Fig. 4 both increase strongly for , but their physical origins are less clear. A possible source for is van der Waals attraction [24], but we minimized this by RI matching. Experiments with an RI mismatch , controlled by changing temperature (), displayed no change in either [25]. However, using decalin as solvent (), we observed no slip and follows the HB form at all for [20], as with coated walls. Indeed, imaging dilute suspensions with nm at equilibrium showed that in decalin colloids were stuck to the glass, while with RI matching such sticking was absent. Therefore we must seek a different origin for in our system.
In an equilibrium HS fluid next to a wall, the contact value of the distribution function, , is proportional to the pressure [26]. For quiescent HS glasses next to walls, little information exists [27]. Nevertheless, consistent with Fig. 2(a), we expect colloid-wall contacts in our system. Therefore may reflect a Coulomb-like friction associated with these contacts. The osmotic pressure, , may then play the role of ‘normal force’ in the Coulomb law, so we expect . For HS glasses, is uncertain, but a widely used form is [28], with . Thus should collapse data for different colloid sizes, as is indeed the case, Fig. 4(b). But the data evidence with -3, apparently inconsistent with Coulomb friction. However, our colloids are polydisperse, and the colloidal glass is under finite shear strain during slip, so that the above form of may be inappropriate.
The parameter reflects lubrication between the first layer of colloids and the wall. While these colloids fluctuate (with a fraction in wall contact), we can deduce the thickness of an effective lubrication layer via [12]. Indeed, temperature-dependent experiments confirmed the scaling for fixed . As shown in Fig. 4(a), scaling by collapses data (plotted as ) for different colloid sizes [29], with a small and decreasing fraction of as . Empirically we find . In principle, should follow from integrating the distribution of colloid-wall gap sizes, , with an appropriate form for the lubrication force [30]. However, this gives a logarithmic form , in contrast to the data. Instead, we can identify with the mean spacing between the first layer of colloids and the wall. The latter is obtained by assuming that the contact value of the density and using for the density away from the wall, , a form suggested in [26]. This equilibrium estimate gives , very similar to our empirical form and to previous observations [12].
The above discussion of and led to correct scaling of the data for different particle sizes. However, we did not obtain the correct functional dependence of on , and having to use a mean spacing to predict appears rather ad hoc. Possibly other aspects of the physics must be taken into account. For example, we only observed slip for , so that the finite strain in the slipping sample due to ‘cage elasticity [31] may play a crucial part.
To conclude, we have demonstrated Bingham-like slip in dense HS suspensions above the glass transition, flowing along smooth, non-stick walls. The apparent simplicity of Eq. 1, however, emerges from the complex physics of HS glasses next to walls, which is not yet well understood. Our findings contrast with observations in dense emulsions [7], showing that details matter in accounting for slip in soft glassy materials. Interestingly, emulsions may be HS-like at [32], implying a possible crossover in slip response from that found in [7] to that reported here on reducing in dense emulsions.
We thank A.B. Schofield for colloids and M.E. Cates and A. Morozov for discussions. The work was funded by the UK EPSRC (EP/D067650, EP/D071070 and EP/E030173) and the EU (network MRTN-CT-2003-504712, ToK ‘Cosines’ MTCD-CT-2005-029944 and NoE ‘SoftComp’ NMP3-CT-2004-502235).
References
- [1] Y. Zhu and S. Granick, Phys. Rev. Lett. 87, 096105 (2001); ibid, 88, 106102 (2002); J.L. Barrat and L.Bocquet, Phys. Rev. Lett. 82, 4671 (1999).
- [2] R.G. Larson, The Structure and Rheology of Complex Fluids (Oxford University Press, New York, 1999); H.A. Barnes, J. Non-Newtonian Fluid Mech. 56, 221 (1995).
- [3] A. Yoshimura and R.K. Prudhomme, J. Rheol. 32, 53 (1988); W.B. Russel and M.C. Grant, Colloids Surf. A 161, 271 (2000).
- [4] R. Buscall et al., J. Rheol. 37, 621 (1993).
- [5] H.M. Princen, J. Colloid Interface Sci. 105, 150 (1985); D.M. Kalyon et al.,. J. Rheol. 37 35 (1993) ;
- [6] J.B. Salmon et al., Eur. Phys. J. E 10, 209 (2003).
- [7] S.P. Meeker, R.T. Bonnecaze, and M. Cloitre, Phys. Rev. Lett. 92, 198302 (2004); J. Rheol. 48, 1295 (2004).
- [8] L. Bécu et al., Phys. Rev. Lett 93, 018301 (2004); ibid. 96, 138302 (2006); Phys. Rev. E 76, 011503 (2007).
- [9] V. Bertola et al., J. Rheol. 47, 1211 (2003).
- [10] G. Katgert et al., Phys. Rev. Lett. 101, 058301 (2008).
- [11] U. Yilmazer and D.M. Kalyon, J. Rheol. 33, 1197 (1989).
- [12] D.M. Kalyon, J. Rheol. 49, 621 (2005).
- [13] S.C. Jana et al., J. Rheol. 39, 1123 (1995); P.J. Hartman-Kok et al., J. Col. Int. Sci 280, 511 (2004).
- [14] J.B. Salmon et al., Eur. Phys. J. Appl. Phys. 22, 143 (2003); S. Manneville et al., Eur. Phys. J. Appl. Phys. 28, 361 (2004); P. Coussot et al., Phys. Rev. Lett. 88 218301 (2002); H. Wassenius and P.T. Callaghan, Eur. Phys. J. E 18, 69 (2005).
- [15] L. Isa et al., Phys. Rev. Lett. 98, 198305 (2007).
- [16] I. Cohen et al., Phys. Rev Lett. 97, 215502 (2006).
- [17] G. Bryant et al., Phys. Rev. E 66, 060501 (2002).
- [18] W. Schaertl, H. Sillescu, J. Stat. Phys. 77, 1007 (1994).
- [19] We checked that bending of the cover slide is negligible.
- [20] G. Petekidis et al., J. Phys. Cond. Mat. 16, S3955 (2004).
- [21] R. Besseling et al., in preparation.
- [22] R. Besseling et al., Phys. Rev. Lett. 99, 028301 (2007).
- [23] Another cause for small deviations from the model is a slight reduction of in the HB form for .
- [24] J.R. Seth et al., J. Rheol. 52, 1241 (2008).
- [25] Different glass cleaning methods could lead to unsystematic changes of within a factor .
- [26] J.R. Henderson, F. van Swol, Mol. Phys. 51, 991 (1984).
- [27] R.P.A. Dullens et al., Phys. Rev. Lett. 92, 195702 (2004); C.R. Nugent et al., Phys. Rev. Lett.99, 025702 (2007).
- [28] L.V. Woodcock, Ann. N. Y. Acad. Sci. 37, 274 (1983)
- [29] We also find that the dimensionless slip velocity at the onset of yielding, , with the Brownian time, is independent of for fixed .
- [30] A.J. Goldman et al., Chem. Eng. Sci. 22, 637 (1967).
- [31] G. Petekidis et al., Phys. Rev. E 66, 051402 (2002).
- [32] H. Gang et al., Phys. Rev. E 59, 715 (1999).