,
The Role of Second Trials in Cascades of Information over Networks
Abstract
We study the propagation of information in social networks. To do so, we focus on a cascade model where nodes are infected with probability after their first contact with the information and with probability at all subsequent contacts. The diffusion starts from one random node and leads to a cascade of infection. It is shown that first and subsequent trials play different roles in the propagation and that the size of the cascade depends in a non-trivial way on , and on the network structure. Second trials are shown to amplify the propagation in dense parts of the network while first trials are dominant for the exploration of new parts of the network and launching new seeds of infection.
pacs
89.75.-k, 02.50.Le, 05.50.+q, 75.10.HkI Introduction
The propagation of information and new ideas has long been a fundamental question in the social sciences. Propagation may be driven by exogenous causes, when people are informed in a mean-field way by an external source, e.g. television, but also by endogenous mechanisms, when a few early adopters may influence their friends, who may in turn influence their own friends and possibly lead to a cascade of influence [1]. This self-organizing process, which reminds of the dynamics of an epidemic, is usually called the word-of-mouth phenomenon. It has attracted more and more attention in the last few years due to the emergence of the internet and of online social networks, which have led to more decentralized media of communication. A typical example is the blogosphere, where blogs are written and read by web users and where debates/discussions may take place among the bloggers. As of today, the blogosphere is extremely influential in the adoption or rejection of products but also in politics, as more and more citizens voice their opinions and mobilize community efforts around their candidates. From a practical point of view, the emergence of these participative media has changed the way elections take place, by allowing politicians to reach new audiences, raise money, communicate to voters and even consider all of them as a gigantic think tank [2], and also to open new ways to promote commercial products via recommendation networks or viral marketing methods. It is therefore interesting to better understand how such information cascades take place in social networks [3, 4, 5, 6, 7, 8].
A good description of the word-of-mouth phenomenon requires two elements: a model of propagation and a network structure. The model of propagation defines the way information (e.g. a marketing campaign for a specific product, an information) flows between acquaintances. One of the most common models of propagation is the Independent Cascade Model (ICM)[4, 5], where one starts from an initial set of infected nodes. When a new node becomes infected, it tries one single time to infect each of its neighbors with independent probability . The process stops when no new node has been infected. The size of the information cascade is given by the number of infected nodes and one says that an epidemic outbreak (keeping in mind that the models described in this paper apply only to information diffusion, not to the epidemical spread of diseases) takes place when the fraction of people who are infected does not vanish as the network size increases. It is straightforward to show that ICM is equivalent to the epidemiological SIR model, where nodes are divided in three classes, i.e. susceptible/infectious/removed [9], and where infectious nodes infect their neighbors with rate and are removed with rate . It is also possible to view ICM as a bond percolation problem, the final number of infected nodes being the sum of the sizes of the connected components the initial nodes belong to. Second, this viral process has to be applied on a realistic social network, where each node defines a member of the society and edges are drawn between acquaintances. For a long time the design of these social networks was purely theoretical and real social networks were generally limited in size, but the advent of the Internet and of cheap computer power now allows to study social networks composed of millions of individuals and to characterize the statistical properties of their topology. For instance, it has been shown that social networks typically exhibit the small-world property [10], heavy-tailed degree distributions [11], assortative mixing [12], modular structure [13], etc. An important challenge is therefore to understand how the topology of the social network affects the propagation of information but also to find statistical indicators for the most influential nodes in the network [4, 16, 14, 15].
The ICM is a direct implementation of an epidemiological model in a social context. There are, however, drastic differences between the propagation of a virus and the propagation of ideas. Indeed, recent experiments have shown that the memory of the individuals may play a dominant role in the latter case. For instance, in the case of recommendation networks, the probability that people buy an item depends in a non-trivial way on the number of times they received a recommendation for this item [17]. In the case of online social networks, it was also shown that the probability to join a community depends on the number of your friends in that community [18]. In general, empirical studies show that the probability of getting infected increases with the number of contacts and saturates for large values of . Several models have been introduced in order to take into account this property, such as general ICM, threshold and cascade models [19, 20, 21, 22, 23] or generalized voter models [24, 25]. The way such dynamics is affected by the network topology is, however, still poorly understood [26], even though some studies focus on specific topologies [27, 28, 29, 30]. The goal of this paper is to bridge this gap by focusing on a generalization of ICM which includes in the simplest way a dependence on the number of contacts. The model is applied on small-world networks in order to highlight the importance of the network randomness. As a first step, we focus on simplified cases where the network is directed, which allows us to obtain an analytical description of the propagation. It is shown that the birth of large cascades of information is strongly influenced by the network topology and that first and subsequent trials play very different roles in the propagation. Computer simulations are also performed on directed and on more realistic undirected networks, and confirm the above observations.
II Properties of the model
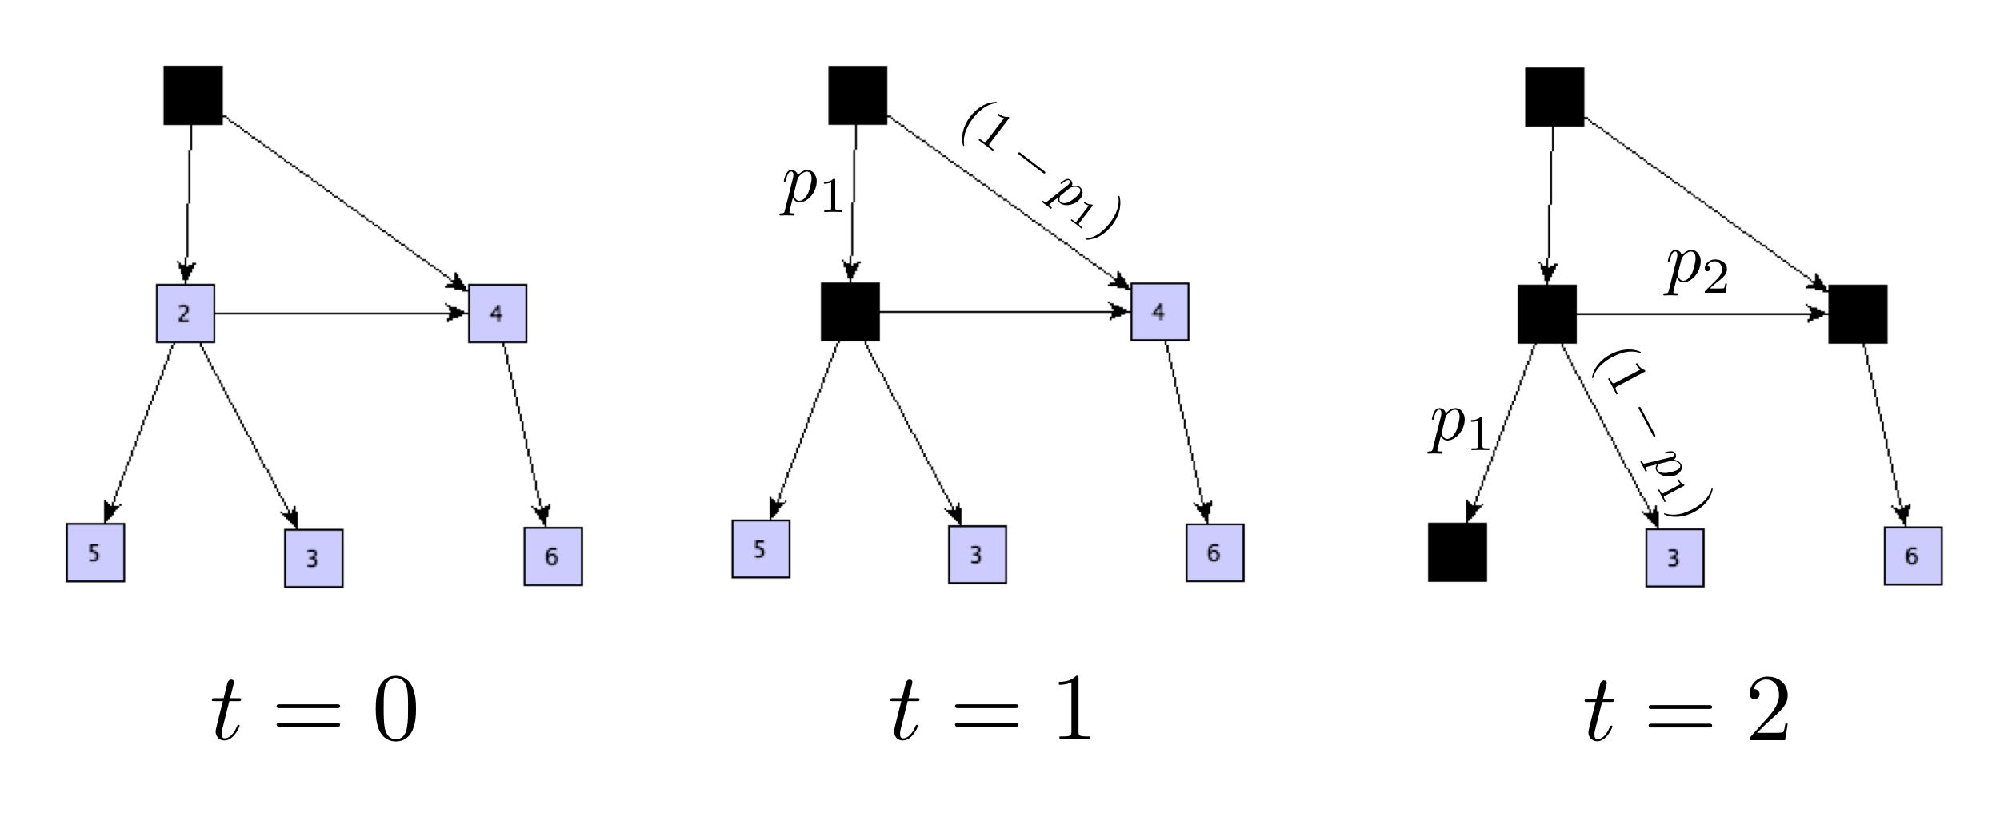
Our generalization of ICM is defined as follows. The network is composed of nodes and one node is initially infected. Each time a new node is infected, it contacts all of its neighbours, and they each get infected with a probability if it is the first time they are contacted and with a probability for all subsequent contacts. The dynamics stops when no new node is infected. The classical ICM is therefore recovered when . Since the ICM and SIR model are equivalent, one can also interpret the generalized ICM as an extension of the SIR model. The dependence in the number of contacts leads to a new class of nodes, namely contacted nodes, which have already been unsuccessfully attacked by infectious nodes. In that framework, the probability of a susceptible node to be infected by a neighboring infectious node is while it becomes contacted with probability . When a contacted node is attacked by an infectious node, its probability to become infected is . Finally, an infectious node becomes removed once it has attacked each of its neighbors. The model can also be related to threshold models [3, 4] where each node receives a random threshold generated following a given distribution. A node becomes infected when the number of infected neighbors exceeds his threshold. The probability of having a threshold of value 1 is the probability of being infected at the first trial, in our case . In this way, one can generate for every couple (,) the thresholds of the equivalent threshold model with the following expressions
| (1) | |||||
| (2) |
It is also interesting to note that our model may be related to percolation. The case is well-known to be equivalent to bond percolation but the case can also be seen as a node percolation problem. Indeed, in that case, each neighbour of an infected node is infected with a probability only if it is the first time it is in contact with the information. The total number of infected nodes may therefore be obtained by removing nodes from the network with a probability and by looking at the size of the connected components. For general values of and , however, the system is much more complicated and the probabilities of infection are not straightforward to compute.
III Random Networks
In this paper, we are interested in the conditions for a large cascade to emerge. We therefore look for the critical couple (,) such that a random node infects a non vanishing fraction of the network for any couple (,) (,) where the inequalities are componentwise. This couple determines the epidemic threshold of this network. Let us first focus on a directed random Erdös-Renyi network, composed of nodes and where the probability to have a link between two randomly selected nodes is . As we will show, the proportion of second attacks vanishes when tends to infinity when one is below the epidemic threshold. Therefore the threshold in such topology hardly depends on and we recover the same threshold as for the ICM model. Even though this result was predictable, the probability still plays a role when the size of the network is finite. Let , , and be the number of susceptible, contacted, infectious and removed nodes respectively at time . By using a mean-field approximation, one obtains the number of links between different types of nodes. For instance, the number of links going from infectious nodes to susceptible nodes is , which also represents the number of attacks at time from infectious nodes on susceptible nodes. The average number of susceptible nodes that become infected at time is therefore given by . Similar calculations lead to the set of equations
| (3) |
for the densities , , and , where , , , , and where is the average degree of the network.
The epidemic threshold is found by linearizing this nonlinear dynamical system around the stationary solution where all nodes are susceptible, and looking at the eigenvalues of the linearized matrix. The behaviour of the system is then essentially governed by the linearized equation , which implies that is stable if and therefore that the infection will not reach a non vanishing fraction of the network in that case. This result, which is well known in percolation theory when , also shows that the epidemic threshold does not depend on the parameter . This may be understood by noting that second and subsequent trials are statistically relevant only when a finite fraction of nodes have been infected, which implies that the epidemic threshold may be evaluated without taking them into account. This also implies that for a non-vanishing initial fraction of contacted nodes, we then have a dependency on and the threshold will change accordingly. Above the epidemic threshold, the system of equations (3) ceases to be valid because it does not incorporate multiple attacks (i.e. several edges attacking a node at the same time), thereby leading to an overestimation of the number of infections. In that case, we have therefore performed computer simulations of the model which show that the total fraction of nodes having been infected increases with , as expected. This becomes even more obvious for decreasing. Finally, when is relatively small, the proportion of second attacks is no more negligible and the threshold varies with and .
IV Directed Small-World network
In order to highlight the role played by the network topology, we have applied the model on a directed version of the well-known Watts-Strogatz model for small-world networks [10]. The main reason for looking at this directed version rests in the equations of propagation that becomes tractable. However the simulations show that both cases, directed and undirected, exhibit similar couple of thresholds. The directed version is built from a directed one-dimensional lattice of sites, with periodic boundary conditions, i.e., a ring, each vertex pointing to 2 neighbors , , see Fig. 2. With probability , these “regular” links are removed and replaced by random links. This network therefore exhibits an interplay between order and randomness. By increasing the parameter , one increases the randomness of the topology and one recovers a random network when .

It is instructive to first consider the case of a regular lattice, i.e., . In that case, the information propagates in the system in an ordered way and the state of each site is only influenced by the sites and . For this reason one does not need to store separately the state “contacted” anymore. Let , with be the probability that node is and node is , with the correspondence: infectious, not infectious. By definition, for any . Let us assume that one starts the propagation at node , so that . Then, it is straightforward to show that the quantities satisfy the recurrence
| (4) | |||||
| (5) | |||||
| (6) |
while the probability that the dynamics ends grows monotonically like
| (8) |
This corresponds to the states Markov chain represented in Fig. 3. By definition, the expected number of infected nodes is .
The asymptotic number of infected nodes grows like the largest eigenvalue of the matrix associated with the linear system (4)
This largest eigenvalue is smaller than for any , , except when or , which implies that an epidemic outbreak takes place only in these trivial cases. In contrast, when and are different from , only a finite number of nodes gets asymptotically infected. This is due to the one-dimensionality of the topology, which implies that two nodes at most may spread the infection at each step and that the probability that no new node gets infected is different of zero when and . As expected, increasing values of or increase the total number of infected nodes. The analytical expression for when is given by
| (19) | |||||

Let us now focus on a topology where a fraction of the links is displaced in a random way. In order to generalize the results of the previous section, it is useful to label each node with its position on the underlying one-dimensional lattice. By construction, each node points to and when but such links only exist with probability in general. In a system where is sufficiently small and where only a vanishing fraction of the nodes gets activated, one may decouple the dynamics as follows [31]. The initial seed may infect a segment of nodes which are contiguous on the underlying lattice, thereby leading to contiguous infected nodes. This number may be evaluated by generalizing the set of equations (4) and taking into account the fact that some links are missing. The associated matrix with this linear system is
where we consider three cases: no missing link, this occurs with probability , and then we recover the matrix in Eq. IV, secondly we have with probability one missing link and the corresponding transition matrix, and finally we have with probability no link accompanied by a simple transition matrix. By using similar arguments that for the regular lattice, one finds that the average number of contiguously infected nodes is
| (28) |
This segment of infected nodes may in turn infect distant nodes which will play the role of a new seed, each of them infecting a new segment of average size , etc. Below the epidemic threshold, only a vanishing proportion of nodes is infected and one may assume that the different segments do not overlap. The total number of infected links is therefore
| (29) |
which converges to
| (30) |
if
| (31) |


The line therefore separates two regimes, one in which the spreading dies out and another one in which an infinite number of nodes is asymptotically infected. By using Eq.(28) and solving Eq.(31), one finds an analytical formula for the critical value
| (32) |
such that an epidemics takes place when (see Fig. 4). It is interesting to note that the epidemic threshold depends both on and for general values of , but that these parameters are associated with different mechanisms. The probability plays an important role in the local propagation of the infection among neighbouring sites. The probability also plays a role for such propagations but it is also responsible for the infection of new distant seeds, a process that is crucial for exploring several disconnected parts of the network and that favours the emergence of an epidemic. One observes from (28) and (31) that is less and less important as increases. In the limit of a random network, the length of infected segments goes to 1, which implies that the epidemic threshold is , independently of , as predicted in our analysis of the Erdös-Rényi network. It is also interesting to note that the total number of infected nodes (11) may decrease when is increased, which is in contradiction with the usual belief that short-cuts promote the propagation [29, 30].
We have checked the validity of (31) by performing computer simulations of the generalized ICM on a directed small-world network with nodes and by averaging the results over realizations of the dynamics. As shown in Fig. (5), the critical threshold for a given is evaluated by looking at the probability for which the slope of is maximal when the Y-axis is in log-scale. In Fig. (4) these critical points are drawn for , and . The case is not shown because of the very small number of short-cuts in that case and therefore of the very large fluctuations from one realization of the network to another one. The simulation results show large fluctuations but are nonetheless in good agreement with the theoretical predictions.
Finally, we have also studied numerically our model when it is applied to an undirected small-world network made of nodes and with an average degree . As expected (the mean degree is twice larger), the frontiers are shifted to the left meaning that smaller probabilities are sufficient to observe significant cascades in the network (see Fig. 6). Qualitatively, however, the system behaves in the same way as in the directed case and the lines determining the epidemic threshold have similar shapes. Theoretically, when , the network is random and the epidemic threshold should not depend on , i.e. it is a vertical line. However, the finite size of the network implies that the proportion of triangles does not vanish and therefore that second attacks may occur due to finite size effects. Consequently the experiments show a slight dependency on and the frontier is not exactly vertical when . However we recover the threshold of the ICM model when .

V Conclusion
In this paper, we have focused on a very simple model for the cascade of information in social networks. The novelty of the model consists in considering different probabilities for being infected depending on the number of contacts with the information. The model has been applied on a directed small-world network in order to show how the randomness of the network topology affects the propagation. It is shown that first and subsequent trials play very different roles: first trials are primordial in order to discover unexplored parts of the network and launch new seeds of infection, while second and subsequent trials influence the propagation in ordered parts of the network, where triangles (and other dense motifs) are frequent. The epidemic threshold, which determines the success of the cascade, depends in a non-trivial way on these two mechanisms and on the randomness of the network topology, but it is dominated by the success of first trials.
The importance of first trials should be put in perspective with Granovetter’s famous work on “The Strength of Weak Ties” [32, 33], which states that weak links keep the network connected whereas strong links are mostly concentrated within communities. In the context of information diffusion, our model shows that the first trials play a similar cohesive role by connecting different communities, while second and subsequent trials accelerate the propagation inside the communities. This is due to the fact that dense parts in the network make possible the existence of several infected paths to each node, and therefore increase the number of time one node is contacted. In the extreme scenario of a clique, for instance, where nodes are fully connected, after the first step, all further steps will be considered as second trials.
To conclude, our model is motivated by recent experiments which have shown that an accumulation of contacts favours the propagation of information and that, in particular, second and subsequent trials are more successful than first trials. Interestingly, our model also reproduces the fact that locally dense subnetworks accelerate the propagation [34, 35], a property which has been observed for the adoption of new services among users of a mobile phone networks [36] and which is not reproduced by the original ICM.
Acknowledgements
This work has been supported by the Concerted Research Action (ARC) “Large Graphs and Networks” from the “Direction de la recherche scientifique - Communauté française de Belgique.”, by the EU HYCON Network of Excellence (contract number FP6-IST-511368), and by the Belgian Programme on Interuniversity Attraction Poles initiated by the Belgian Federal Science Policy Office. The scientific responsibility rests with its authors.
References
- [1] D. Sornette, F. Deschatres, T. Gilbert and Y. Ageon, Phys. Rev. Lett. 93, 228701 (2004).
- [2] http://www.ohboyobama.com/
- [3] M. Granovetter, American Journal of Sociology 83, 1420 (1978).
- [4] D. Kempe, J. Kleinberg, and É. Tardos, Maximizing the spread of influence through a social network. In Proceedings of the ninth ACM SIGKDD international conference on Knowledge discovery and data mining, 137–146 (2003).
- [5] J. Goldenberg, B. Libai, and E. Muller, Marketing Letters 12, 211–223 (2001).
- [6] D. Gruhl, R. Guha, D. Liben-Nowell, and A. Tomkins, Information diffusion through blogspace. In Proceedings of the 13th international conference on World Wide Web, 491–501 (2004).
- [7] J. Leskovec, A. Singh, and J. Kleinberg, Patterns of influence in a recommendation network. In Pacific-Asia Conference on Knowledge Discovery and Data Mining (PAKDD) (2006).
- [8] D. Watts and P. Dodds, Journal of Consumer Research 34, 441–458 (2007).
- [9] M.E.J. Newman, Phys. Rev. E 66, 016128 (2002).
- [10] D.J. Watts and S.H. Strogatz, Nature 393, 440 (1998).
- [11] A.-L. Barabási and R. Albert, Science 286, 509 (1999).
- [12] M.E.J. Newman, Phys. Rev. Lett. 89, 208701 (2002).
- [13] M. Girvan and M.E.J. Newman, Proc. Natl. Acad. Sci. USA 99, 7821 (2002).
- [14] V. Blondel, C. de Kerchove, E. Huens, and P. Van Dooren, Lecture Notes in Control and Information Sciences 3̱41, 231 (2006).
- [15] V. Blondel, J.-L. Guillaume, J.M. Hendrickx, C. de Kerchove and R. Lambiotte, Phys. Rev. E 77, 036114 (2008)
- [16] M. Kimura and K. Saito, Lecture Notes in Computer Science 4213, 259 (2006).
- [17] J. Leskovec, L. Adamic, and B. Huberman, ACM Transactions on the Web 1, Article 5 (2007).
- [18] L. Backstrom, D. Huttenlocher, J. Kleinberg and X. Lan. Group formation in large social networks: Membership, growth, and evolution. In Proc. 12th ACM SIGKDD International Conference on Knowledge Discovery and Data Mining, 2006.
- [19] J. Joo and J.L. Lebowitz, Phys. Rev. E 69, 066105 (2004)
- [20] D. Watts, Proc. Natl. Acad. Sci. USA 99, 5766–5771 (2002).
- [21] P. Dodds and D. Watts, Phys. Rev. Lett. 92, 218701 (2004).
- [22] J. Kleinberg, Cascading Behavior in Networks: Algorithmic and Economic Issues. In Algorithmic Game Theory (Cambridge University Press, Cambridge, England, 2007).
- [23] P. Klimek, R. Lambiotte and S. Thurner, Europhys. Lett. 82, 28008 (2008).
- [24] S. Galam, Europhys. Lett. 70, 705 (2005).
- [25] R. Lambiotte and S. Redner, Europhys. Lett. 82, 18007 (2008).
- [26] M. Draief, A. Ganesh and L. Massoulié, Thresholds for virus spread on networks. In ACM International Conference Proceeding Series 180, 2006.
- [27] J.P. Gleeson and D.J. Cahalane, Phys. Rev. E 75, 056103 (2007).
- [28] J.P. Gleeson, Phys. Rev. E 77, 046117 (2008).
- [29] D. Centola, V. M. Eguiluz and M. W. Macy, Physica A 374, 449-456 (2007).
- [30] D. Centola and M. W. Macy, American Journal of Sociology 113, 702-734 (2007).
- [31] C. Moore and M.E.J. Newman, Phys. Rev. E 61, 5678Ð5682 (2000).
- [32] M. Granovetter, American Journal of Sociology 78, 1360 (1973).
- [33] J.P. Onnela, J. Saramäki, J. Hyvönen, G. Szabó, D. Lazer, K. Kaski, J. Kertesz, and A.-L. Barabási, Proc. Natl. Acad. Sci. U.S.A. 104, 7332 (2007).
- [34] D. McAdam, American Journal of Sociology 92, 64 (1986).
- [35] D. McAdam, R. Paulsen, American Journal of Sociology 99, 640 (1993).
- [36] C. Prieur, Private Communication.