Upper critical field, penetration depth and depinning frequency of the high-temperature superconductor LaFeAsO0.9F0.1 studied by microwave surface impedance.
Abstract
Temperature and magnetic field dependent measurements of the microwave surface impedance of superconducting LaFeAsO0.9F0.1 ( 26K) reveal a very large upper critical field (T) and a large value of the depinning frequency (GHz); together with an upper limit for the effective London penetration depth, , our results indicate a strong similarity between this system and the high- superconducting cuprates.
Keywords:
microwave response, upper critical fields, penetration depth.pacs
74.25.Nf, 74.25.Op, 74.25.Qt.The recent discovery of superconductivity in LaFeAsO0.9F0.1 [1] has lead to the rapid growth in the number of superconducting layered oxypnictides with larger and larger ( 55K in SmO0.8F0.2FeAs). [2] Apart from their high , the interest in these materials stems primarily from the proximity of superconductivity to a spin-density-wave (SDW) ground state, and from the fact that multiple bands resulting from the orbitals of the conventionally pair-breaking magnetic ion Fe2+ appear to be here directly responsible for the formation of the superconducting condensate. Both ab initio band structure and LDA calculations[3, 4, 5, 6] show that the Fe-pnictide layers are responsible for the (super)conductivity; specifically, the orbitals of the Fe2+ ions weakly hybridized with the As3- orbitals, form two electron and two hole pockets, while the [(OF)] ( = La,Pr,Ce,Sm) layers act as charge reservoirs, F1- causing the electron doping, the size of the element generating chemical pressure. The electronic structure thus consists of multiple quasi-two-dimensional Fermi surface sheets in the presence of competing ferromagnetic and antiferromagnetic fluctuations[4, 6]. The microscopic nature of the superconducting pairing and the symmetry of the order parameter on the other hand are still far from established, with theoretical proposals ranging from extended s-wave mediated by antiferromagnetic spin fluctuations [3] to spin-triplet -wave [7]. The possibility of anomalously strong electron phonon coupling effects has also been emphasized [8], while a very small value of the electron-phonon coupling constant ( has been calculated [9]. The expected large moment for the undoped compound () is experimentally not observed, low temperature values of [10] and [11] being reported instead. In this parent compound a structural phase transition from tetragonal to orthorhombic occurs at K, closely related to the formation of a spin-density-wave (SDW) below K. Electron doping rapidly suppresses both structural and SDW transitions leading to superconductivity, possibly allowing short-range magnetic fluctuations to survive in the region of the phase diagram where superconductivity becomes the preferred ground state. Whether or not these local fluctuations are responsible for the pairing is here the fundamental question. Further evidence for possible unconventional pairing with nodal order parameter comes from specific heat[12], tunneling[13], magnetisation[14] and NMR[15] measurements.
Here we report on temperature (4.2K ) and magnetic field dependence (T) of the microwave surface impedance of LaFeAsO0.9F0.1. The results allow us to estimate the upper critical field , the effective London penetration depth and the depinning frequency for this material.
Polycrystalline samples of LaFeAsO0.9F0.1 were prepared by a solid state reaction method and annealed in vacuum [16]. Inspection with a polarized light microscope revealed dense crystallites of sizes varying between 1 and 100 m. The resistivity of the sample under study was measured by means of a standard DC method with four-point contact geometry and current polarity inversion. The magnetic susceptibility, both zero-field (ZFC) and field cooled (FC), was measured using a SQUID magnetometer. The microwave measurements were carried out in a high-Q elliptical copper cavity at four different frequencies corresponding to four different resonant modes: the eTE111 mode at 9.1GHz, the eTE112 mode at 12.8GHz, the eTE211 mode at 15.1GHz and the eTE113 mode at 16.7GHz. The sample was mounted on a sapphire sample holder and placed in the center of the resonator. In that position, the sample lies in a microwave electric field maximum in modes eTE111 and eTE113 and in a microwave magnetic field maximum in modes eTE112 and eTE211. The temperature was varied between 5 and 50 K, and the applied DC magnetic field between 0 and 16 T. Directly measured quantities are the -factor and the resonant frequency of the cavity loaded with the sample. The -factor was measured by a modulation technique described elsewhere.[17] The empty cavity absorption was subtracted as background from the measured data: the presented experimental curves therefore display changes occurring exclusively in the physical properties of the samples themselves. An automatic frequency control (AFC) system was used to track the source frequency always in resonance with the cavity. Thus, the frequency shift could be measured as the temperature of the sample or the static magnetic field were varied. The two measured quantities represent the complex frequency shift .


The temperature dependence of resistivity and susceptibility are shown in Fig. 1 and Fig. 2 respectively. Remarkably, the normal state resistivity has a quadratic temperature dependence up to about 200K. The midpoint of the resistive transition yields =23.7K with a width K (90% - 10% criterion), while the onset of diamagnetism from the susceptibility curve (ZFC) becomes discernible below K. Both data sets reveal a sample with some degree of inhomogeneity, with a fluorine content slightly different from the nominal value of 0.1. The field-cooled (FC) susceptibility shows significant flux penetration for fields as low as 20 Oe.
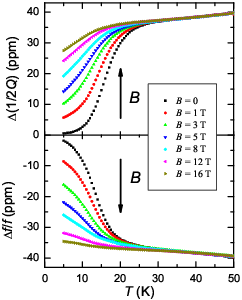
The two panels of Fig. 3 show the measured complex frequency shift for various values of the applied DC magnetic field in the microwave mode eTE112. For a thick sample there is a proportionality between the complex frequency shift and the surface impedance: . The factor of proportionality can be determined from the normal state resistivity . From the surface impedance one can determine the complex penetration depth through[18]
| (1) |
The resulting temperature dependencies of and in zero applied magnetic field are shown in Fig. 4.

In the normal state one has , where is the normal metal skin depth. In the opposite limit (), where the real part of the complex conductivity disappears, the complex penetration depth becomes real and identical to the London penetration depth . This analysis was performed for all four microwave modes leading to an estimate of the penetration depth at to be . This is an effective value for the polycrystalline sample and can be taken as the upper limit of the intrinsic value of the London penetration depth in the plane. It is clear from Fig. 4 that does not saturate at 5 K; for a nodal order parameter, it would have a linear dependence at very low temperatures[19] due to the gradual excitation of quasiparticles from the superconducting condensate. By linearly extrapolating down to 0K, a value substantially smaller than 200 nm for the zero temperature London penetration depth would be obtained. From the data in Fig. 3 the upper critical field can be estimated. An empirical criterion for the onset of superconductivity at a given applied field would be the deviation from the apparently linear (normal state) behaviour of the absorption in the top panel of Fig. 3. This method, however, is not very precise, and we therefore decided to apply a quantitative, arguably more rigorous, way of determining such a point. From the complex frequency shift one can extract the complex conductivity ; the emergence of is the sign of the establishment of the coherent superconducting state. In Fig. 5 we have plotted the upper critical fields determined by the criterion that exceeds 1% of the normal state . The solid line is the plot of the following formula derived from Ginzburg-Landau theory[20]
| (2) |
where , with and . The slope of near , , is T/K; this value is substantially unaffected if a different criterion (percentage) for the onset of superconductivity from microwave measurements is adopted. We have neglected in the fit the points above K, the critical temperature as deduced from resistivity measurements. Taking these points into account (points that may possibly only be representative of crystallites with a slightly higher ) would lead to a somewhat smaller value of but more importantly to an underestimate of the slope of near .

We have also measured the field dependence of the complex frequency shift at several constant temperatures. We could not observe the low field signal changes typical of intergrain Josephson junctions. It therefore appears that the preparation of the sample under 1GPa pressure resulted in a very compact granular structure. From this frequency shift the mixed state effective complex conductivity can be analytically extracted. The effective conductivity[18, 21, 22] in an oscillating electric field is given by:
| (3) |
The parameter represents the volume fraction of the sample occupied by the normal vortex cores. is the depinning frequency which depends on sample, field and temperature, ranging from the strongly pinned case () to the flux flow limit (), where is the driving microwave frequency.

By numerical inversion of Eq. (3), we have determined the values of and . For the driving frequency , the field dependence of is plotted in Fig. 6. The highest value of the depinning frequency is obtained for at low fields: . With increasing field, and/or temperature, decreases. Thus, most of the microwave measurements are close to the flux-flow regime.
The normal state resistivity reveals a reasonably good metal (cm, RRR=(300K)/(30K)=12.1) with up to K. This feature is remarkable, but indeed more experimental evidence is needed to prove this to be a signature of Fermi liquid behavior. Our measured effective penetration depth (an upper limit to the London penetration depth) is somewhat smaller than the value of measured by SR experiments on LaFeAsO0.9F0.1[23]; with a value for , this would position our compound closer than previous results to the line of the electron-doped cuprates on the Uemura plot[23, 24]. Note that our measurement does not rely on any assumption regarding the distribution and arrangement of the vortex lattice within the sample in order to extract . The obtained values of upper critical field, =56T, and slope near , T/K, are in substantial agreement with other resistivity measurements: for compounds with nominally the same doping, Zhu et al obtain the same value of and a similar slope (T/K) using formula 2 for their fit[25], while Hunte et al obtain in the range 62-65T and a similar slope by applying the conventional one-band Werthamer-Helfand-Hohenberg theory[26]. Their result is closer to that reported by Fuchs et al on As-deficient LaFeAsO0.9F0.1 samples[27], whose value of near though is considerably larger. The measurement of the depinning frequency yields GHz: a number well into the microwave range. Typically, copper based high- superconductors have depinning frequencies slightly higher than 10GHz[28], while the depinning frequencies in classical bulk superconductors are below 100MHz[29]. This result therefore also points to a substantial communality of features between these novel materials and the cuprates.
In summary, microwave surface impedance measurements on the novel superconductor LaFeAsO0.9F0.1 provide estimates of the upper critical field (=56T) and the penetration depth (nm); the latter appears to be substantially smaller than the values estimated from measurements carried out by other techniques.[25, 23]. Together with the large value of the depinning frequency (GHz), these results yield a phenomenological picture of this system that closely resembles that of the high- cuprate superconductors.
We thank S.-L. Drechsler, G. Fuchs and I. Vekhter for their valuable comments. We acknowledge financial support from the Croatian Ministry of Science, Education and Sports (project no. 119-1191458-1022 “Microwave Investigations of New Materials”).
References
- [1] Y. Kamihara, T. Watanabe, M. Hirano and H. Hosono, J. Am. Chem. Soc. 130, 3296-3297 (2008).
- [2] Z. A. Ren, W. Lu, J. Yang, W. Yi, X. L. Shen, Z. C. Li, G. C. Che, X. L Dong, L. L. Sun, F. Zhou and Z. X. Zhao, Chin. Phys. Lett. 25, 2215 (2008); R. H. Liu, G. Wu, T. Wu, D. F. Fang, H. Chen, S. Y. Li, K. Liu, Y. L. Xie, X. F. Wang, R. L. Yang, L. Ding, C. He, D. L. Feng and X. H. Chen, arXiv:0804.2105v3.
- [3] I.I. Mazin, D.J. Singh, M.D. Johannes, and M.H. Du, arXiv:0803.2740.
- [4] D.J. Singh and M.-H. Du, arXiv:0803.0429v1.
- [5] S. Raghu, X.-L. Qi, C.-X. Liu, D.J. Scalapino and S.-C. Zhang, arXiv:0804.1113.
- [6] I. Eremin and M. M. Korshunov, arXiv:0804.1793.
- [7] P. A. Lee and X. G. Wen, arXiv:0804.1739.
- [8] H. Eschrig, arXiv:0804.0186v2.
- [9] L. Boeri, O.V. Dolgov and A.A. Golubov, arXiv:0803.2703v1.
- [10] C. de la Cruz, Q. Huang, J. W. Lynn, Jiying Li, W. Ratcliff II, J. L. Zarestky, H. A. Mook, G. F. Chen, J. L. Luo, N. L. Wang and P. Dai, Nature 453, 899 (2008).
- [11] H.-H. Klauss, H. Lütkens, R. Klingeler, C. Hess, F.J. Litterst, M. Kraken, M.M. Korshunov, I. Eremin, S.-L. Drechsler, R. Khasanov, A. Amato, J. Hamann-Borrero, N. Leps, A. Kondrat, G. Behr, J. Werner and B. Büchner, arXiv:0805.0264v1.
- [12] G. Mu, X. Zhu, L. Fang, L. Shan, C. Ren and H.-H. Wen, arXiv:0803.0928v2.
- [13] L. Shan, Y. Wang, X. Zhu, G. Mu, L. Fang and H.-H. Wen, arXiv:0803.2405.
- [14] C. Ren, Z.-S. Wang, H. Yang, X. Zhu, L. Fang, G. Mu, L. Shan and H.-H. Wen, arXiv:0804.1726v1.
- [15] H.-J. Grafe, D. Paar, G. Lang, N. J. Curro, G. Behr, J. Werner, J. Hamann-Borrero, C. Hess, N. Leps, R. Klingeler and B. Büchner, arXiv:0805.2595v1.
- [16] S.-L. Drechsler., M. Grobosch, K. Koepernik, G. Behr, A. Köhler, J. Werner, A. Kondrat, N. Leps, Ch. Hess, R. Klingeler, R. Schuster, B. Büchner and M. Knupfer, arXiv:0805.1321v1.
- [17] B. Nebendahl, D.-N. Peligrad, M. Požek, A. Dulčić, and M. Mehring, Rev. Sci. Instrum. 72, 1876 (2001).
- [18] M. W. Coffey and J. R. Clem, Phys. Rev. Lett. 67, 386 (1991); M. W. Coffey and J. R. Clem, Phys. Rev. B 46, 11757 (1992).
- [19] W. N. Hardy, D. A. Bonn, D. C. Morgan, R. Liang, and K. Zhang, Phys. Rev. Lett. 70, 3999 (1993).
- [20] M. Tinkham, Introduction to superconductivity, McGraw Hill, New York, USA, 2nd edition, 1996;
- [21] E. H. Brandt, Phys. Rev. Lett. 67, 2219 (1991).
- [22] A. Dulčić and M. Požek, Physica C 218, 449 (1993); A. Dulčić and M. Požek, Fizika A (Zagreb) 2, 43 (1993).
- [23] H. Lütkens, H.-H. Klauss, R. Khasanov, A. Amato, R. Klingeler, I. Hellmann, N. Leps, A. Kondrat, C. Hess, A. Köhler, G. Behr, J. Werner and B. Büchner, arXiv:0804.3115v1.
- [24] A. J. Drew, F. L. Pratt, T. Lancaster, S. J. Blundell, P. J. Baker, R. H. Liu, G. Wu, X. H. Chen, I. Watanabe, V. K. Malik, A. Dubroka, K. W. Kim, M. Rössle and C. Bernhard, arXiv:0805.1042v1.
- [25] X. Zhu, H. Yang, L. Fang, G. Mu, H. Wen, arXiv:0803.1288.
- [26] F. Hunte, J. Jaroszynski, A. Gurevich, D. C Larbalestier, R. Jin, A.S. Sefat, M.A. McGuire, B.C. Sales, D.K. Christen, D. Mandrus, Nature 453, 903 (2008).
- [27] G. Fuchs, S.-L. Drechsler., N. Kozlova, G. Behr, A. Köhler, J. Werner, K. Nenkov, C. Hess, R. Klingeler, J.E. Hamann-Borrero, A. Kondrat, M. Grobosch, M. Knupfer, J. Freudenberger, B. Büchner, and L. Schultz, arXiv:0806.0781.
- [28] M. Golosovsky, M. Tsindlekht, H. Chayet, D. Davidov, Phys. Rev. B 50, 470 (1994); M. Golosovsky, M. Tsindlekht, and D. Davidov, Supercond. Sci. Technol. 9, 1 (1996).
- [29] J. I. Gittleman and B. Rosenblum, Phys. Rev. Lett. 16, 734 (1966).