Enhanced superconductivity in Hf–base metallic glasses
Abstract
Systematic study of electrical resistivity of Hf100-xFex , Hf100-xCux , and Ti65Cu35 metallic glasses has been done in the temperature range K, and in magnetic fields T. All Hf–base alloys are superconducting with K, which is well above of pure crystalline Hf (K). From the initial slopes of the upper critical fields, , and resistivities we determined the dressed electronic densities of states, , for all alloys. Both and decrease with increasing (Fe, Cu content). The results are compared with those for corresponding Zr–base metallic glasses and ion-implanted Hf films.
pacs
74.70.-b, 74.25.Op, 71.23.Cq, 74.81.Bd1 Introduction
Glassy TE–TL alloys (TE and TL being the early and late transition metal, respectively) have been extensively studied in recent decades [1] and the interest in these alloys further increased after the discovery of TE–TL base bulk metallic glasses [2, 3, 4]. These studies revealed several unusual phenomena [5, 6, 7, 8], which has lead to the development of novel concepts for the calculation of their properties [9, 10]. In TE–TL alloys the composition range for the formation of the amorphus state by rapid quenching from the melt is quite wide and in favourable cases it spans from at. % of TL component. Such a broad composition range enables a detailed study of the changes in the electronic band structure and properties on alloying, through comparison between the model and experiment [1, 11, 12].
In nonmagnetic amorphous TE–TL alloys, several properties which are related to the electronic density of states (DOS) show simple, sometimes linear variation with TL content [1, 6, 7, 11, 12, 13, 14, 15, 16]. These simple variations of the properties correlate with ultraviolet photoemission spectroscopy (UPS) results for the same alloy systems [1, 17], which showed that DOS at the Fermi level (), , is dominated by TE d–states. Accordingly, in amorphous TE–TL alloys, the effect of alloying with TL can be approximated with the dilution of amorphous TE [13]. So far, a majority of results on TE–TL alloys has been obtained for Zr–TL metallic glasses, rendering a comparison between alloy systems based on different TE (eg. Ti, Zr, Hf) rarely possible [11, 12, 18]. This is particularly true for superconductivity, with only a few results for superconducting transition temperatures of Ti– [19] and Hf–base [20, 21] metallic glasses.
Here we report, to our knowledge first, systematic study of superconductivity in Hf–Fe and Hf–Cu metallic glasses. Our results show that the variation of with in Hf100-xFex and Hf100-xCux glassy alloys is quite similar to that observed in corresponding Zr100-xFex and Zr100-xCux metallic glasses [14, 15, 22]. In particular decreases with and the rate of decrease is much faster for Fe than for Cu. The magnitudes of in Hf–base alloys are about two times lower than those in corresponding Zr–base alloys [14, 15, 22]. The dressed density of states at the Fermi level, , also decreases with increasing . Thus, superconductivity in Hf–base alloys is consistent with “split–band” electronic structure of glassy TE–TL alloys [1, 17, 20].
2 Experimental
Hf100-xFex , Hf100-xCux , and Ti65Cu35 amorphous ribbons were prepared by melt spinning of master alloys with the predetermined concentration in either pure Ar [23] or He [24] atmosphere. The ribbons were typically m (Hf–Fe) and m (all other alloys) thick and their amorphousness was verified by X–ray diffraction [23, 25]. About mm long samples for resistivity measurements were glued by GE–varnish on the sample holder of a 3He cryostat inserted into T superconducting magnet. The current and voltage wires were glued with silver paste onto the samples. The resistivity measurements were performed by low frequency (Hz) ac method with rms current mA in the temperature range K in magnetic field T, perpendicular to the broad surface of the ribbon and to the current direction. The temperature was measured with calibrated Cernox thermometer situated close to the samples. The resistivity was determined from the measurements of resistance, length, mass and density of samples [13, 14, 15]. Due to finite width of the silver paste contacts the uncertainty in the absolute resistivity values was about 5%. This uncertainty propagated into the values of the density of states . Some data relevant to our samples are given in table 1.
| Alloy | (cm) | (K-1) | (K) | ||
|---|---|---|---|---|---|
| (kOe/K) | (states/eV atom) | ||||
| Hf80Fe20 | 206 | 1.86 | 38 | 2.27 | |
| Hf75Fe25 | 200 | 1.12 | 35 | 2.14 | |
| Hf70Cu30 | 206 | 1.36 | 28.5 | 1.64 | |
| Hf60Cu40 | 212 | 0.82 | 26.1 | 1.40 | |
| Hf50Cu50 | 210 | 0.44 | 23.7 | 1.16 |
3 Results and discussion
Figure 1 shows the

variation of resistance with temperature for Ti65Cu35 and selected Hf–Cu, Fe glassy alloys. As is usual for glassy TE100-xTLx alloys with high resistivity (cm) [6, 13, 26] all our samples had negative temperature coefficients of resistivity (TCR). The literature values for resistivities and TCRs of corresponding Hf–Cu and Ti65Cu35 [6, 26] agree quite well with our results (table 1). In particular, our K resitivities, , are a few percent higher than the room temperature resistivites, , of other authors [6, 26, 27].
Figure 2 shows the variations
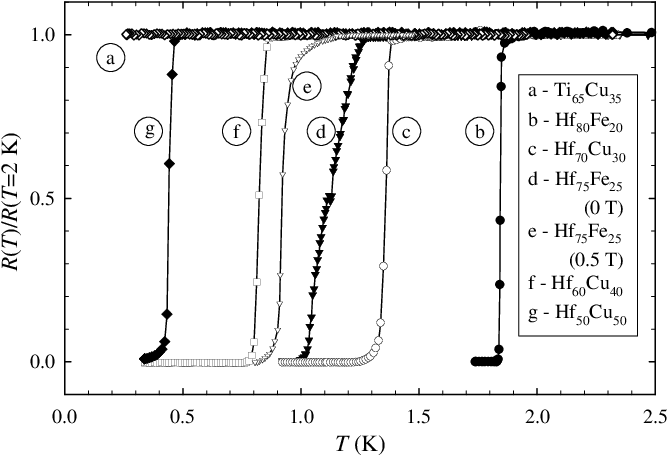
of normalized resistance with temperature below K for all studied alloys. All Hf–Cu,Fe samples become superconducting within the explored temperature range (K). Except for Hf75Fe25 alloy, all other samples show very narrow superconducting transitions with typical widths (from 0.1 to ) K, which can be regarded as an indication of good quality (homogeneity) of studied samples [13, 14, 15, 20, 27]. The transition width for Hf75Fe25 alloy, K, is somewhat larger but not unusual for amorphous alloys. As illustrated in figure 2 the resistive transition of this alloy became narrower in applied field, which allowed reliable determination of the variation of the upper critical field with temperature, , also for this alloy. The values of superconducting transition temperatures (defined as midpoints of resistive transitions) are given in table 1. Sample Ti65Cu35 showed no sign of superconductivity down to K, which is consistent with the reported K for this alloy [19].
In figure 3 we compare the variations of

zero-field s with concentration for our Hf100-xFex and Hf100-xCux alloys, with the literature results for Zr–Fe and Zr–Cu alloys [14, 15, 22]. Also shown are the maximum s (i.e. the highest attainable in given TE100-xCux series) of presumably amorphous Ti–Cu, Hf–Cu and Zr–Cu thin films, obtained by low temperature ion implantation [28], which seem to extrapolate quite well the results for metallic glasses to lower Cu contents. Since there are no previous results for of Hf–Fe,Cu glassy alloys, we can compare our results only with that for splat cooled Hf70Ni30 foil [20] with K. Judging by the relation between s of similar Zr–Ni and Zr–Cu alloys [12, 14, 15, 22], of Hf70Ni30 alloy [20] is consistent with K for our Hf70Cu30 alloy. The transition temperatures of pure crystalline (hcp) Zr and Hf (figure 3) are about an order of magnitude lower than maximum s of Zr–Cu and Hf–Cu amorphous alloys. This is qualitatively consistent with the observed [1, 12, 16, 17] and calculated [11, 12] higher in dilute amorphous TE–TL alloys than those of pure crystalline (hcp) TE metals. As seen from figure 3 the variations of with in Zr–Fe,Cu and Hf–Fe,Cu amorphous alloys are qualitatively very similar, the main difference is that s of Hf–Fe,Cu alloys are about two times lower than those of corresponding Zr–Fe,Cu alloys. Like in Zr–base alloys the rate of decrease of with in Hf–base alloys is much faster for Fe than for Cu alloy. This is due to onset of magnetic correlations such as the spin fluctuations and/or formation of magnetic moments/clusters which cause strong pair-breaking [14, 15, 20, 25].
Lower s of Hf–Fe,Cu alloys, compared to those of Zr–Fe,Cu, are consistent with a decrease of on going from Zr to Hf (due to the increase of the bandwidth), but may also be affected [29] by the different Debye temperatures of Zr– and Hf–base alloys. Unfortunately, there are no measurements of the low temperature specific heat (LTSH) of Hf–base metallic glasses [12] which are necessary in order to explain the difference between s of Zr–base and Hf–base alloy systems. In the absence of LTSH, useful information about nature of superconductivity in metallic glasses can be obtained from the measurements of upper critical field [14, 15, 20, 21, 22, 27, 30]. The variation of with temperature in TE–TL metallic glasses is usually well described by the Werthamer-Helfand-Hohenberg theory [31] and a fit of experimental results to the model enables one to determine the spin-orbit interaction parameter, , and the Maki paramagnetic limitation parameter [32]. However, such fits yield reliable results for the above parameters (especially ) only if the measurements extend to sufficiently low temperature, [21]. The variations for our Hf–Fe,Cu alloys are shown in figure 4.

was defined with , but – as illustrated for Hf80Fe20 alloy – the variation of with for criterion was virtually the same. Due to low s of alloys we have studied, our measurements are limited to which is not sufficient for the accurate estimate of both and . Instead, we can use rather well defined initial slopes of , , for our alloys (table 1) in order to estimate their dressed densities of states, [14, 15, 20, 22, 27]. can be calculated from [31]:
| (1) |
where is Boltzmann constant, the Avogadro number, the molecular weight, the mass density, and . The product can be expressed via resistance , length , and mass of the sample, [14, 15, 27]. The values of for Hf–Cu,Fe alloys calculated by using (1) decrease with increasing Fe,Cu content (table 1) in the same fashion as in corresponding Zr–Fe,Cu alloys [14, 15]. However, the magnitudes of in Hf–base alloys are some 10–12% lower than those in corresponding Zr–base alloys [14, 15]. As in Zr–base alloys [14, 15, 20] a clear correlation exists between the values of and . In metallic glasses the values of calculated from (1) usually agree well with those obtained more directly from the coefficient of a linear term in LTSH, [12, 14, 15, 20, 21, 22, 27, 30]:
| (2) |
The dressed density of states is enhanced by many body interactions in respect to a band (bare) density of states, . In particular, , where and are the electron-phonon and electron-spin fluctuations interaction parameters, respectively. Since our Hf–base alloys were paramagnetic [25] with magnetic susceptibilities well below of those for corresponding Zr–base alloys [14, 15] we expect to be small for Hf–Fe, and negligible for Hf–Cu alloys. For a reliable estimate of the LTSH measurements are required [12]. Since at present no LTSH results for Hf–base glassy alloys exist [12] we cannot make accurate estimates of for studied alloys.
In amorphous TE–TL alloys the electron-phonon enhancement factor can also be estimated from the temperature variation of the thermopower, [6]. Such an estimate for amorphous Hf50Cu50 alloy yields , nearly the same as that obtained for Zr50Cu50 alloy [33]. Another estimate of in Hf–Cu glassy alloys can be obtained by dividing our results for with the calculated values of for amorphous Hf100-xCux alloys [12, 34]. The ratio between our and (interpolated) values of decreased from about 1.4 () to (). This calculation gave values for amorphous Hf–Cu alloys about 10% lower than the values of in corresponding Zr–Cu alloys [12].
In principle, can also be obtained from the approximate proportionality between and derived for disordered transition metal alloys of a given series [35] which was found applicable to several 4d (Zr,Mo)-base metallic glasses [20]. There, the coefficient of vs. variation for 4d and 5d series was found to be quite similar [35], whereas that for 3d series was sizeably smaller. This result is in qualitative agreement with the estimates of from [33] for equiatomic Ti–Cu, Zr–Cu and Hf–Cu amorphous alloys. Thus, the electron-phonon enhancement in Hf–Cu glassy alloys is probably quite similar to that in Zr–Cu alloys and the main reason for lower s in the former system may be higher ionic mass of Hf (lower Debye temperature, [36]) and lower [12].
Near absence of superconductivity in Ti–base metallic glasses [12, 19], also confirmed by us (figures 2 and 3), is puzzling. Since in these systems both and are higher than those in corresponding Zr–base and Hf–base metallic glasses [12], an inefficient electron-phonon coupling is required to explain their low s [34].
4 Conclusion
The first systematic study of superconductivity in Hf–based metallic glasses has been reported. A clear correlation between the values of and the dressed density of states has been established. With exception of Hf75Fe25 alloy, higher corresponds to higher . More rapid suppression of with in Hf100-xFex alloys than in Hf100-xCux is probably caused by magnetic effects. In general, the variations of and in Hf–Fe,Cu metallic glasses with Fe,Cu content are qualitatively the same as those in corresponding Zr–Fe,Cu glassy alloys which is consistent with very similar electronic structures of these alloys. Considerably lower values of in Hf–based metallic glasses than those in corresponding Zr–based alloys are probably due to the lower Debye temperatures , and electronic densities of states in former system. For a more detailed insight into the superconductivity of Hf–based metallic glasses the additional measurements of the low temperature specific heat (yielding ) and perhaps tunnelling experiments (giving more directly electron-phonon coupling) are required.
Acknowledgments
The samples Hf70Cu30 and Hf60Cu40 have been prepared by Dr. L. Varga and Dr. I. Bakonyi from Research Institute for Solid State Physics and Optics, Hungarian Academy of Sciences. This work was supported by the Croatian Ministry of Science, Education and Sports projects Nos. 119-1191458-1023 and 119-1191458-1019.
References
References
- [1] Beck H and Güntherodt H J (eds) 1994 Glassy Metals III (Topics in Applied Physics vol 72) (Berlin: Springer)
- [2] Peker A and Johnson W L 1993 Appl. Phys. Lett. 63 2342
- [3] Das J, Tang M B, Kim K B, Theissmann R, Baier F, Wang W H and Eckert J 2005 Phys. Rev. Lett. 94 205501
- [4] Inoue A, Zhang W, Zhang T and Kurosaka K 2001 Acta Materialia 49 2645
- [5] Gey W, Eschner W and Yu M Galperin 1993 Phys. Rev. B 48 15666
- [6] Howson M A and Gallagher B L 1988 Phys. Reports 170 265
- [7] Marohnić Ž, Babić E, Guberović M and Morgan G 1988 J. Non–Cryst. Solids 105 303
- [8] Whang S H, Polk D E and Giessen B C 1982 4th Int. Conf. On Rapidly Quenched Metals ed Masumoto T and Suzuku K (Sendai) p 1365
- [9] Jank W, Ch Hausleitner and Hafner J 1991 Europhys. Lett. 16 473
- [10] Ch Hausleitner and Hafner J 1990 Phys. Rev. B 42 5863
- [11] Mankovsky S, Bakonyi I and Ebert H 2007 Phys. Rev. B 76 184405
- [12] Bakonyi I 1995 J. Non–Cryst. Solids 180 131
- [13] Babić E, Ristić R, Miljak M, Scott M G and Gregan G 1981 Solid State Commun. 39 139
- [14] Altounian Z and Strom-Olsen J O 1983 Phys. Rev. B 27 4149
- [15] Batalla E, Altounian Z and Strom-Olsen J O 1985 Phys. Rev. B 31 577
- [16] Ristić R and Babić E 2007 Mater. Sci. Eng. A 449-451 569
- [17] Oelhafen P, Hauser E and Güntherodt H J 1979 Solid State Commun. 35 1017
- [18] Bakonyi I 2005 Acta Materialia 53 2509
- [19] Hickey B J, Greig D and Howson M A 1986 J. Phys. F: Met. Phys. 16 L13
- [20] Tenhover M and Johnson W L 1983 Phys. Rev. B 27 1610
- [21] Nordström A, Dahlborg U and Rapp Ö 1993 Phys. Rev. B 48 12866
- [22] Samwer K and v Lohneysen H 1982 Phys. Rev. B 26 107
- [23] Revesz A, Cziraki A, Lovas A, Padar J, Ledvai J and Bakonyi I 2005 Z. Metallkd 96 874
- [24] Babić E, Butcher S, Day R K and Dunlop J B 1985 5th Int. Conf. On Rapidly Quenched Metals ed Steeb S and Warlimont H (Amsterdam: Elsevier Science Publishers B.V.) p 1157
- [25] Pajić D, Zadro K, Ristić R, Živković I, Skoko Ž and Babić E 2007 J. Phys.: Condens. Matter 19 296207
- [26] Pavuna D 1985 Solid State Commun. 54 771
- [27] Karkut M G and Hake R R 1983 Phys. Rev. B 28 1396
- [28] Meyer J D and Stritzker B 1983 Z. Phys. B – Condensed Matter 54 25
- [29] Collings E W and Ho J C 1971 Phys. Rev. B 4 349
- [30] Poon S J 1983 Amorphous Metalic Alloys ed Luborsky F (London: Butterworths) p 432
- [31] Werthamer N R, Helfand E and Hohenberg P C 1966 Phys. Rev. 147 295
- [32] Maki K 1966 Phys. Rev. 148 362
- [33] Gallagher B L and Hickey B J 1985 J. Phys. F: Met. Phys. 15 911
- [34] Cyrot-Lackmann F, Mayou D and Nguyen Manh D 1988 Mater. Sci. Eng. 99 245
- [35] Dynes R C and Varma C M 1976 J. Phys. F: Met. Phys. 6 L215
- [36] McMillan W L 1968 Phys. Rev. 157 331