Theoretical evidences for enhanced superconducting transition temperature of CaSi2 in a high-pressure AlB2 phase
Abstract
By means of first-principles calculations, we studied stable lattice structures and estimated superconducting transition temperature of CaSi2 at high pressure. Our simulation showed stability of the AlB2 structure in a pressure range above 17 GPa. In this structure, doubly degenerated optical phonon modes, in which the neighboring silicon atoms oscillate alternately in a silicon plane, show prominently strong interaction with the conduction electrons. In addition there exists a softened optical mode (out-of-plan motion of silicon atoms), whose strength of the electron-phonon interaction is nearly the same as the above mode. The density of states at the Fermi level in the AlB2 structure is higher than that in the trigonal structure. These findings and the estimation of the transition temperature strongly suggest that higher is expected in the AlB2 structure than the trigonal structures which are known so far.
I Introduction
The calcium di-silicide, CaSi2, has a rhombohedral crystal structure at the ambient pressure. In this layered structure, superconductivity does not appear down to 0.03 K.[1] In a high pressure phase of the -ThSi2 type structure, which is tetragonal, CaSi2 is known to become a superconductor with the superconducting transition temperature K.[2] At the pressure of 10 GPa, CaSi2 in the rhombohedral structure undergoes a structural phase transformation into another trigonal structure (Phase III) and superconductivity appears with rising up to about 3 K.[3, 4] In this structure, silicon atoms form corrugated honeycomb networks. Between two Si honeycomb planes, Ca atoms are intercalated, forming another plane of a triangular lattice. Each Ca atom locates just above the center of one corrugated hexagon formed by six Si atoms in the adjacent Si plane. If the pressure increases up to 15 GPa, another phase transformation takes place (Phase IV) and the corrugated Si planes become nearly flat. This phase is called Phase IV. The atomic structure of Phase IV is rather close to the AlB2 structure, which has perfectly flat silicon planes. Since corrugation remains in Phase IV, it is sometimes called the AlB2-like structure.[3, 4] In this structure, further rises up to around 14 K, which is the highest record in CaSi2. Here, we note that before these experimental findings, the structural transition from the trigonal structure to the AlB2 structure has been predicted theoretically by one of the authors of this study and his coworkers.[5]
The superconductivity in the AlB2 structure attracted much attention after finding of a high-temperature superconductor. MgB2,[6] As for CaSi2, theoretical studies were done in low-pressure phases.[7, 8] Satta et al. considered possibility of the AlB2 structure in a high pressure condition, but they could not find this structure with fixed cell parameters.[9] The electron-phonon interaction and the superconducting transition temperature were rarely estimated theoretically.[10] Thus, CaSi2 has not been studied so often in the literature compared with MgB2. This another superconductor, however, has its own interest and importance. This is because CaSi2 provides us with an ideal testing ground on which we can compare several polymorphs showing superconductivity. Some of these polymorphs resemble each other, but the superconducting transition temperature changes its value when the structural phase transition takes place. If we could find a key factor determining the change of with the structural phase transition, it would help us to understand this superconducting Zintl-phase compound.
The purpose of the present study is to clarify the nature of CaSi2 in high pressure phases above 10GPa. Using the first-principles calculations, we did the optimization of the atomic structures in CaSi2 at high pressures. We obtained an indication of the pressure-induced phase transition from the known trigonal structure to another high-pressure phase with the AlB2 structure. Then we studied the electronic structures, the phonon dispersion relations, and the superconducting transition temperature. Those results were compared with those of MgB2. We estimated the superconducting transition temperature by means of the strong-coupling theory using the electron-phonon coupling constants obtained by the first-principles calculations. Our results tell us that CaSi2 undergoes a structural phase transformation to the phase of the AlB2 structure and that the new phase is expected to be a superconducting phase with much higher transition temperature than that of the trigonal structure phase.
II Calculation Methods
In this study, we consider the pressure range of GPa. For the structural optimization, we started simulations from lattices whose unit cell contain one Ca atom and two Si atoms and without any symmetry requirements. The space-group of the trigonal lattices of CaSi2 is and that of AlB2 structure is . The Wyckoff position of the calcium atom at the site of is given by , while those of two silicon atoms are and with the internal parameter . When , the structure becomes identical to the AlB2 structure.
For the determination of the electronic structure, we utilized the density-functional theory[11, 12] in the generalized gradient approximation [13] with the ultra-soft pseudopotentials for the atomic potential.[14] The wave functions and the electronic charge density are expanded in the plane-wave basis.
For the pseudopotentials, 3s, 3p and 4s electrons of the calcium atom are treated as the valence electrons, and for silicon atom 3s and 3p electrons are used. Calculations are performed by the use of software package, the Quantum ESPRESSO.[15]

|

|

|
 |
 |
III Results of the Calculations
III.1 Optimizations of the Structures in High Pressure Phases
The lattice constants and the internal parameter were optimized by the constant-pressure variable-cell relaxation using the Parrinello-Rahman method.[16] In this calculation we used a -point grid in the Monkhorst-Pack grid and set the energy cut-off for the wave functions at 16 Ry and that for the charge density is at 64 Ry for the trigonal and the AlB2 structure. Though these values may be comparatively small, the accuracy is enough. This is confirmed by the calculations with larger energy cut-offs of 40 Ry and 160 Ry, resulting in almost the same optimized structure.
In Fig. 2 we show the optimized lattice parameters. In the pressure range from 10 to 17 GPa, the calculated lattice constants are in good agreement with the experimentally observed values. The relative error of each constants, is less than 2%. Above 17 GPa, however, the calculated lattice parameters disagree with those of the AlB2-like structure. Especially, internal parameter becomes 0.5 in our calculation while in the experiment[4] it is less than 0.5 and does not reach that value. Our result of optimization shows that CaSi2 becomes the AlB2 structure above 17 GPa.
This discrepancy is not due to the pseudopotential method adopted in our simulation. We checked the results by the use of all electron methods: The full potential linear muffin tin orbital method which is embodied in the packaged code developed by S. Y. Savrasov and D. Y. Savrasov[17] and the full potential linearized augmented-plane wave method which is embodied in the WIEN2k code.[18] We optimized the structure with constant cell volume and obtained the same results. In all methods, the calculated results indicate that the AlB2 structure is more stable than trigonal structure at high pressure. Here we note that the value of the pressure obtained by the first-principles calculation could have an error in some cases. In fact, the pressures of pure calcium estimated by the generalized gradient approximation calculation, which is the same method as the present one, are much lower than those of experimental values.[19] We expect that the AlB2 structure will be observed at higher pressures in the experiment.
To test stability of the AlB2 structure, we calculated the phonon frequency in the whole Brillouin zone. The density functional perturbation theory was employed[20] for the phonon calculation, where -point grid was used.[21] Phonon dispersion of each phase is shown in Fig. 2. We observe that only real frequencies appear all over the Brillouin zone, which indicates that the AlB2 structure is stable in the pressure range higher than 17 GPa.
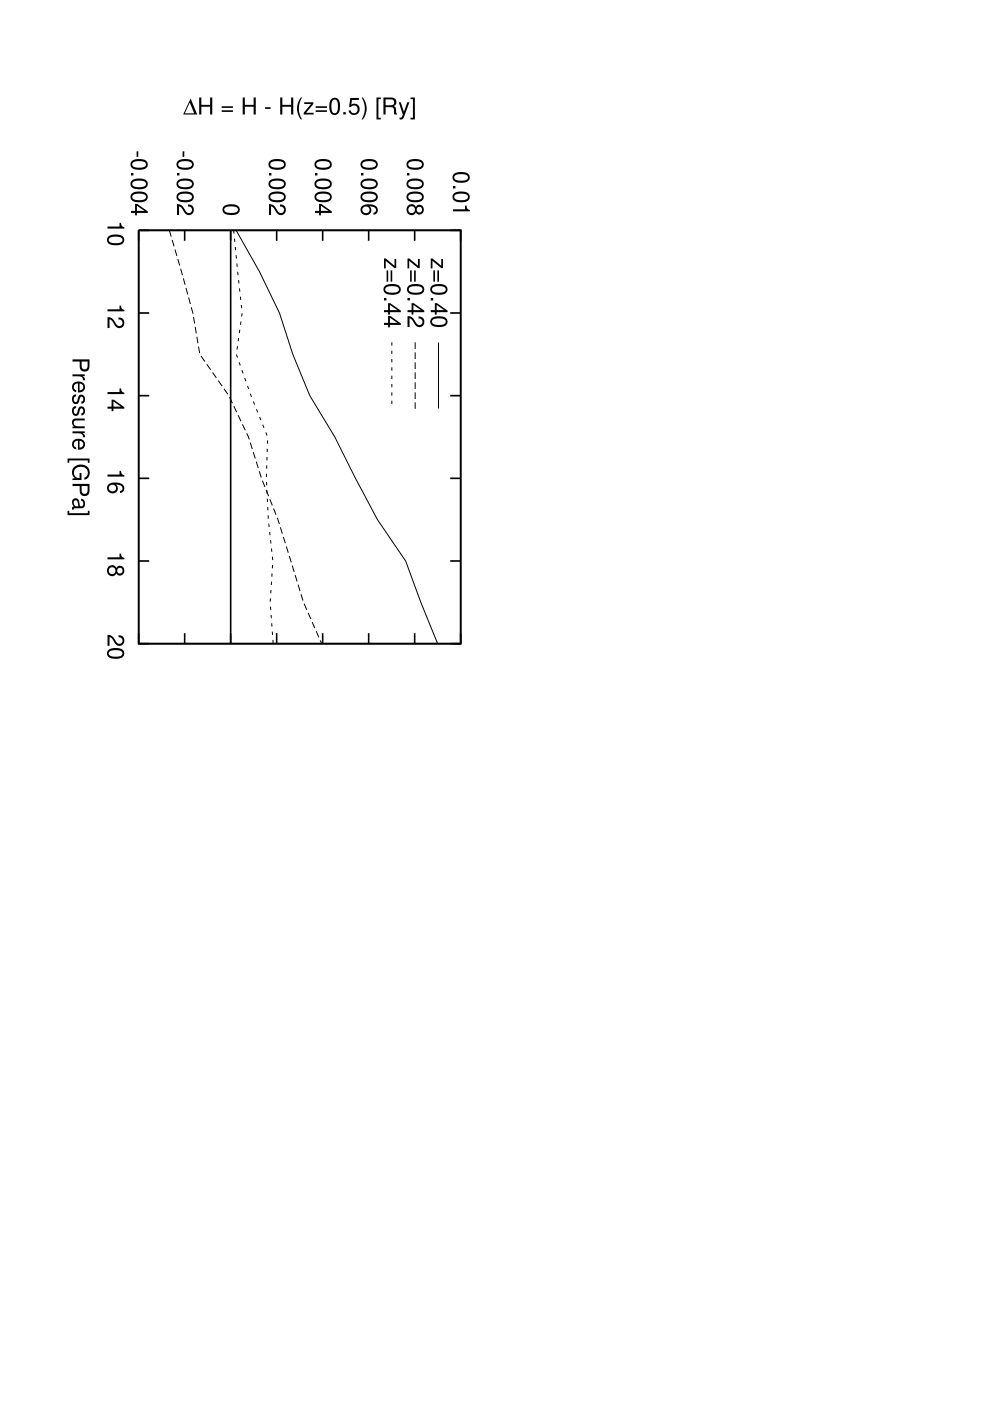
In Fig. 3, we show pressure dependence of enthalpy of some atomic structures. Each structure is given by optimizing with fixing the value of . This graph indicates that CaSi2 abruptly transforms from the trigonal structure () to the AlB2 structure(). In our simulation, thus no transition from the trigonal structure to the AlB2-like structure (z=0.44) occurs.

|

|

|
III.2 The Electronic Band Structure
We now analyze the band structures of CaSi2 obtained by the Kohn-Sham equations. (Fig. 4(a), (b)) The electronic band structure of CaSi2 in the AlB2 structures was studied in earlier works.[5, 9] Global features of dispersion relations are roughly the same, but we can find some important differences between the present results and the earlier ones. This is partly due to optimization of the crystal structure. In the present work, we have fully optimized structure for the Phase III and the AlB2 phase.
In Fig. 4 (a), the band structure of the trigonal structure is shown. The Si bands, Ca -band and a - hybridized band touch the Fermi level. Since the Si planes are corrugated, bands of Si should rather be called ”-like” band.
In Fig. 4 (b), we show the band structure of CaSi2 in the AlB2 structure. First, we can observe -character in some hybridized bands near the Fermi level. One of those branches is seen at the point. We should note that for a Ca compound in a high pressure phase Ca -orbitals often appear at the Fermi level. Appearance of the character was pointed out theoretically for CaSi in the CuAu structure and CaSi3 in the CuAu3 structure.[7] Second, the band lies also near the Fermi level. At the point, the crossing of the and bands is observed, which is a characteristic of the AlB2 structure. It looks that the electrons are doped in the and bands of CaSi2. Third, the doubly degenerated - hybridized bands at the point are occupied. Along the - symmetry line, one of those bands becomes almost dispersionless, which enhances the density of states around the Fermi level as shown below.
We calculated the pressure dependence of electronic density of states at the Fermi level(Fig. 5). Through the structural transition, density of states at the Fermi level increases from 0.65 [state/eV] at 10 GPa to 1.28 [state/eV] at 20 GPa. As shown in Fig. 4, in the AlB2 structure, the , and - bands go down to Fermi level and make electron pockets. This is the reason for the enhancement of the density of states.
Here we compare the electronic band structure of CaSi2 with that of MgB2 (Fig. 4 (c)). Although these materials have a close resemblance with each other, the band structure of MgB2 has some important differences from that of the CaSi2. These AlB2 structures have both - and -bands of sp2-hybridized orbitals. The bands of MgB2 looks to be partly hole-doped creating small two-dimensional hole pockets.[22] In CaSi2, on the other hand, bands are fully occupied and a flat band lies along the - line around the Fermi level. The MgB2 is known to be a two-band system which has - and -bands. CaSi2, however, has additional bands around the Fermi level, which are Ca bands, Si band, and - hybridized bands.

III.3 The Electron-Phonon Interaction and the Superconductivity
Assuming the phonon-mediated superconductivity, we estimated the superconducting transition temperature using the strong coupling theory,[23, 24] in which the electron-phonon matrix are calculated by the density functional perturbation theory. Our results of the shows that when the structural transition occurs, rises rapidly and reaches to a value one order of magnitude larger than those in the low pressure phase. The estimated superconducting transition temperature are shown in Fig. 6. In the trigonal structure, calculated results are almost one-tenth of the experimentally observed values,[25] which is about 34 K. This discrepancy may be due to utilization of an isotropic approximation in the Eliashberg theory. In spite of the low values of the estimated , we can discuss the pressure dependence of .
Let us examine the origin of the pressure dependence of in our theoretical data. According to the McMillan’s formula,[24] is given by three parameters; the electron-phonon coupling constant , the logarithmic average of the phonon frequency , and the Coulomb parameter , in the following form.
Here and are obtained by the first-principle calculations using the density functional perturbation theory. As for , we assume the value 0.1 which holds for simple metals. In the present substances, the critical temperature is mainly determined by and . The table 1 shows and for the AlB2 and the trigonal structures. Of the two parameters, the more significant increase is seen in . While drops about 10%, the increase of the by a factor of 1.5 in the AlB2 structure leads to the enhancement of .
Here we analyze the electron-phonon interaction. The parameter is given explicitly as follows.
using the electron-phonon spectral function,
Here is the density of electronic states with a single spin component at the Fermi level, and are phonon and electron energies, and is the electron-phonon matrix elements. For the mode analysis, we introduce partial electron-phonon interaction constant , defined by
from which the mean value is obtained as .
Using , we find the most influential phonon mode for the superconductivity and , which give large contribution to the electron-phonon interaction parameter . The contribution is shown in Fig. 2, where is shown by a circle on each phonon dispersion, and the radius is proportional to the contribution to electron-phonon interaction parameter . This figure indicates that, in the AlB2 structure, the highest mode at the point is effective. This mode is the E2g mode, in which the neighboring silicon atoms oscillate in the anti-phase within a Si plane. This feature is the same as that observed in the MgB2, in which the E2g mode is the key mode of the high-temperature superconductivity.[26] We can see, however, appearance of the high-frequency peak in the phonon density of states and due to the E2g mode of CaSi2 is much similar to the result of AlB2.

|
In addition, we see another important mode in the AlB2 structure, which is the softened optical mode around the point. This mode is the B1g mode corresponding to out-of-plane motion of silicon atoms, whose displacement makes the Si plane corrugated. Due to the softening, has a large value. However, the softening may reduce given by
and does not necessarily work to increase the transition temperature as exemplified in iodine.[27] In the case of CaSi2 in the AlB2 structure, we observe the high-frequency optical branch containing the mode at the point. In this branch, phonon frequency becomes even higher than that of corresponding branch in the trigonal structure in the low pressure phase. As a result, is kept almost in the same order of magnitude though in the low-frequency range the spectral function increases (Fig. 2). Consequently is not decreased by the phonon softening. This means that both B1g and E2g phonon modes contribute to enhancement of electron-phonon interaction and .
| structure | ||
|---|---|---|
| trigonal | 0.27 | 300 |
| AlB2 | 0.41 | 280 |
IV Summary
In this study, we found that the AlB2 structure appears as the high-pressure phase of CaSi2, and the enhancement of the superconducting transition temperature, , is expected in the AlB2 phase. The enhancement of is due to the enhancement in the electron-phonon interaction. If we assume that CaSi2 has the phonon-mediated superconductivity, the E2g and B1g phonon modes play an important role in the enhancement of through the transformation from the structure with corrugated Si plane to the structure with the flat one.
This work was supported by a Grand-in-Aid for scientific research (No.15GS0213, No.17064006, No.17064013, No.19051016), the 21st century COE program “Core Research and Advanced Education Center for Materials Science and Nano Engineering”, and also by the next generation integrated nanoscience simulation software from the Ministry of Education, Culture, Sports, Science, and Technology, Japan.
References
- [1] M. Affronte, O. Laborde, G. L. Oleese, and A. Palenzona, J. ALloys Compd. 274, 68 (1998).
- [2] D. B. McWhan, V. B. Compton, M. S. Silverman and J. R. Soulen, J. Less-Common Met. 12, 75 (1967).
- [3] S. Sanfilippo, H. Elsinger, M. Nunez-Regueiro, O. Laborde, S. LeFloch, M. Affronte, G. L. Olcese and A. Palenzona Phys. Rev. B 61, R3800 (2000).
- [4] P. Bordet, M. Affronte, S. Sanfilippo, M. Nunez-Regueiro, O. Laborde, G. L. Olcese, A. Palenzona, S. LeFloch, D. Levi, and M. Hanfland Phys. Rev. B 62, 11392 (2000).
- [5] K. Kusakabe, T. Ogitsu and S. Tsuneyuki, J. Phys. Condens. Matt. 10, 11561 (1998).
- [6] J. Nagamatsu, N. Nakagawa, T. Muranaka, Y. Zenitani and J. Akimitsu, Nature 410, 63 (2001).
- [7] J.H. Weaver, A. Franciosi and V.L. Moruzzi, Phys. Rev. B 29, 3293 (1984).
- [8] S. Fahy and D.R. Hamann, Phys. Rev. B 41, 7587 (1990).
- [9] G. Satta, G. Profeta, F. Bernardini, A. Continenza and S. Massidda, Phys. Rev. B 64, 104507 (2001).
- [10] J.L. Wang, Z. Zeng and Q.Q. Zheng, Physica C 408-410, 264 (2004).
- [11] P. Hohenberg and W. Kohn, Phys. Rev. 136, B864 (1964).
- [12] W. Kohn and L. J. Sham, Phys. Rev. 140, A1133 (1965).
- [13] J. P. Perdew, J. A. Chevary, S. H. Vosko, K. A. Jackson, M. R. Pederson, D. J. Singh, and C. Fiolhais, Phys. Rev. B 46, 6671 (1992).
- [14] David Vanderbilt, Phys. Rev. B 41, 7892 (1990).
- [15] S. Baroni, A. Dal Corso, S. de Gironcoli, P. Giannozzi, C. Cavazzoni, G. Ballabio, S. Scandolo, G. Chiarotti, P. Focher, A. Pasquarello, K. Laasonen, A. Trave, R. Car, N. Marzari, A. Kokalj, http://www.pwscf.org.
- [16] M. Parrinello and A. Rahman, Phys. Rev. Lett. 45, 1196 (1980).
- [17] S. Y. Savrasov and D. Y. Savrasov, Phys. Rev. B 54, 16487 (1996), and the references therein.
- [18] P. Blaha, K. Schwarz, G. K. H. Madsen, D. Kvasnicka and J. Luitz: WIEN2k, An Augmented Plane Wave + Local Orbitals Program for Calculating Crystal Properties (Karlheinz Schwarz, Tech. Universities Wien, Austria, 2001) ISBN 3-9501031-1-2.
- [19] Takahiro Ishikawa, Ayako Ichikawa, Hitose Nagara, Masaaki Geshi, Koichi Kusakabe, and Naoshi Suzuki, Phys. Rev. B 77, 020101 (2008).
- [20] S. Baroni, S. de Gironcoli, A. Dal Corso, and P. Giannozzi, Rev. Mod. Phys. 73, 515 (2001).
- [21] H. J. Monkhorst and J. D. Pack, Phys. Rev. B 13, 5188 (1976).
- [22] J. Kortus, I. I .Mazin, K. D. Belashchenko, V. P. Antropov, and, L. L. Boyer. Phys. Rev. Lett. 86, 4656 (2001).
- [23] G.M. Eliashberg, Zh. Eksp. Teor. Fiz. 38, 966 (1960); Sov. Phys. JETP 11, 696 (1960).
- [24] P. B. Allen and R. C. Dynes, Phys. Rev. B 12, 905 (1975).
- [25] For a test calculation, we estimated of MgB2 in the present scheme. The estimation tells K, which is close to the known value obtained with approximations same as the present study.
- [26] K.-P. Bohnen, R. Heid and B. Renker, Phys. Rev. Lett. 86, 5771 (2001).
- [27] S.U. Maheswari, H. Nagara, K. Kusakabe and N. Suzuki, J. Phys. Soc. Jpn. 74, 3227 (2005).