OBSERVED BIMODALITY OF THE EINSTEIN CROSSING TIMES OF GALACTIC MICROLENSING EVENTS
T Wickramasinghe11 1 Department of Physics, The College of New Jersey, Ewing, NJ 08628 , M Struble22 2 Department of Physics & Astronomy, University of Pennsylvania, Philadelphia, PA 19104, and J Nieusma1
ABSTRACT
The OGLE data1 for Einstein ring crossing times, , for microlensing events toward the galactic bulge are analyzed. The analysis shows that the crossing times are bimodal, indicating that two populations of lenses could be responsible for observed microlensing events. Given the possibility that microlensing in this direction can be due to both main-sequence stars and white dwarfs, we analyze and show that the observed bimodality of can be derived from the accepted density distributions of both populations. Our Kolmogorov-Smirnov (KS) one sample test shows that that a white dwarf population of about of all stars in the galaxy agrees well with the observed bimodality with a KS significance level greater than .
1 Introduction
The Einstein crossing time (measured in days) of a galactic microlensing event can be written as2
where is the mass of the lens, the relative orbital speed of the lens and the source, and the distance of the lens, and the distance of the source.
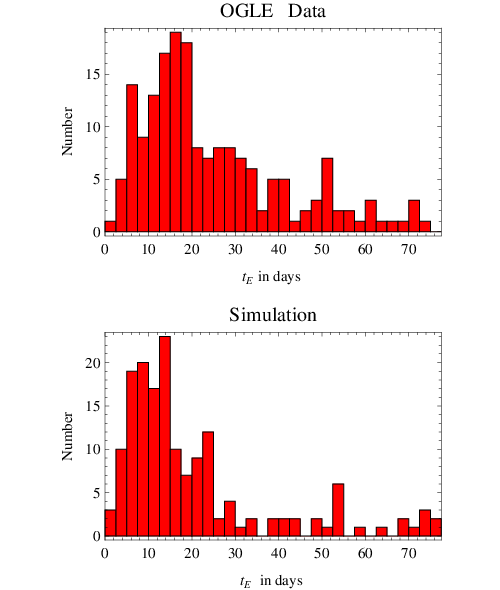
OGLE data for events (Fig. 1) show a certain bimodality in the Einstein crossing times. In order to reproduce this bimodality, we use Eq. (1) with respective galactic mass distributions of main-sequence stars and white dwarfs. Once we have chosen all the relevant parameters satisfying their respective density distributions, we carry out a Monte Carlo simulation to obtain a distribution for . This distribution is then tested against the observed distribution utilizing the KS one sample test to investigate the agreement.
2 Analysis
For our statistical analysis, the parameters in Eq. (1) were chosen as follows. About of values were chosen from the galactic bar. The density profile of the bar was assumed to be3
where
and kpc-3. The scale lengths are kpc, kpc, and kpc, respectively. In these coordinates, the galactic center is at the origin. The rest of values were chosen from a disc population, whose density profile is given by
where is the mass density in the local solar neighborhood, the scale height, and and form a system of cylindrical galactocentric coordinates.
The lens distances were chosen only from the disk. The orbital speeds were chosen from a standard galactic rotation model.
Both main-sequence stars and white dwarfs were used for masses. For main-sequences masses, a combination of Scalo initial mass function4 and a rapidly falling three-power law form due to Kroupa, et al.5 was used as follows:
Both DA and DB types of white dwarfs were used in our simulations. Their masses obey normal distributions such that and respectively.6,7
3 Analysis and Results
Figure 1 shows the OGLE data and our simulated values of Einstein crossing times. The KS one sample test was used to see if the two distributions had been drawn from the same parent distribution. For any acceptable agreement, two different mass distributions were essential. In our calculations, these masses were chosen from both main-sequence stars and white dwarfs including both types DA and DB. We find that the white dwarf contribution should be as high as about to explain the data well. Out of this contribution, for a better agreement, we needed about of DA and about of DB dwarfs.
There was only very poor agreement if all the source stars were chosen only from the bar. This is contrary to the findings of Alcock et al.8,9who had taken all the sources to be in the bar. Our analysis shows that of the sources could come from the bar while the rest must be drawn from a disk population. Excellent agreement was obtained for all the lens distances chosen equally from the disk and bulk populations.
The KS test indicate that our simulation agrees with the observed distribution with significance level greater than . Our analysis shows that the possible bimodality of could be due to a high percentage of white dwarfs() and main-sequence stars.
References
- [1] Udalski, A., et al., 2000, Acta Astr., 50, 1
- [2] Schneider, P. 2006, Extragalactic Astronomy and Cosmology, p. 69
- [3] Han, C. & Gould, A. ApJ 1995, 447, 53
- [4] Scalo, J. M., 1986, Fundamentals of Cosmic Physics, 11, 1
- [5] Kroupa, P., Tout, C. A., Gilmore, G., 1993, MNRAS, 262, 545
- [6] DeGennaro, S., arXiv:0709.2190v[astro-ph] 14 Sep 2007
- [7] Kepler, S. O., et al., 2007, MNRAS, 375, 1315
- [8] Alcock, C., et al., 1995, ApJL, 454, L125
- [9] Alcock, C., et al., 2000, ApJ, 518, 44