Transparency of 0.2 GdCl3 Doped Water in a Stainless Steel Test Environment
Abstract
The possibility of neutron and neutrino detection using water Cerenkov detectors doped with gadolinium holds the promise of constructing very large high-efficiency detectors with wide-ranging application in basic science and national security. This study addresses a major concern regarding the feasibility of such detectors: the transparency of the doped water to the ultraviolet Cerenkov light. We report on experiments conducted using a 19-meter water transparency measuring instrument and associated materials test tank. Sensitive measurements of the transparency of water doped with 0.2 GdCl3 at 337nm, 400nm and 420nm were made using this instrument. These measurements indicate that the use of GdCl3 in stainless steel constructed water Cerenkov detectors is problematic.
Keywords:
Water Cerenkov Detercors; Neutron; Neutrino, DSNB, Transparency; GadoliniumPACS: 29.40.Ka
, , ,
1 Introduction
Water Cerenkov Detectors (WCDs) have played a significant role in advancing the field of particle physics. The combination of large mass coupled with low cost led to their use in the detection of cosmic ray[1] , solar[2, 3], and accelerator neutrinos[4] and resulted in some of the most definitive evidence for neutrino oscillations. In addition, WCDs have been used to set limits on proton decay[5, 6] and to detect neutrinos from supernovae[7].
The principle of operation of current detectors is rather simple. Water has a refractive index (n) of roughly 1.33 and so charged particles moving at a speed greater than c/n (where is the speed of light in a vacuum) will emit Cerenkov photons at an angle (1/n) to their direction of travel. These photons have a characteristic spectrum, which means that much of the detectable light is emitted in the ultraviolet. Pure water happens to have a ‘transparency window’ with attenuation lengths greater than 50 m in the spectral region from about 320 to 480 nm. This is well-matched to the Cerenkov spectrum and the sensitivity of bi-alkali photomultiplier tubes. Figure 1 shows the attenuation coefficient () plotted against wavelength for purified water contained in the 50K ton Super-Kamiokande neutrino detector[8].
Unfortunately, water from typical public potable water supplies has a much shorter attenuation length in the UV, often 5-10 meters or less. The reason for this is not well-understood. Nevertheless, standard water purification systems that remove dissolved solids have empirically been found to solve this problem. Thus all operating water Cerenkov neutrino detectors have an associated water treatment plant. This component is a significant percentage of the construction expense. In addition, it is found that the water in the detector will deteriorate in transparency - even under a nitrogen atmosphere and in a stainless steel or high-density polyethylene (HDPE) tank. Thus the water treatment plant must be run continuously to maintain detector water quality and stability. This is often the largest operational expense of WCDs.

Recently Super-Kamiokande has published limits on a search for ‘relic supernovae’[9]. While nearby supernovae are rare, the expected rate integrated over the entire universe is substantial and is predicted to produce a diffuse supernova neutrino background [DSNB]. This flux, if observable, could provide information about stellar collapse and nucleo-synthesis, and the rate of stellar formation as a function of red shift. These limits are still a factor of 4-5 away from the most optimistic models of stellar formation. In this case, most of the expected interactions come from interactions with hydrogen in the water due to the so-called ‘inverse beta decay’ reaction:
There are significant backgrounds for this reaction from atmospheric neutrino interactions in the same range. Many of these are from muon neutrino interactions that produce a muon below the Cerenkov threshold which subsequently decays to produce a Michel electron or positron in the middle of the SN neutrino energy range. In reactor neutrino experiments using this same interaction, the capture of the daughter neutron and subsequent gamma emission are used as an effective tag to discriminate against background. Unfortunately, the 2.2 MeV gamma from capture on hydrogen in the water results in relatively little Cerenkov emission. Thus there is interest in dissolving in the water nuclei with large capture cross section and higher energy gamma emission.
Use of CdSO4 in water has been previously discussed [10]. Beacom and Vagins[11] have also suggested the use of GdCl3 in order to boost the capture gamma energy via an 8 MeV gamma cascade. They pointed out that the addition of only small amounts of GdCl3 (0.2 by weight) would result in about 90 of the neutrons being captured on Gd. This would reject a substantial part of the atmospheric neutrino background and greatly improve the sensitivity of Super-Kamiokande for DSNB events. This would also be advantageous to separate ‘cooling’ from ‘neutronization’ neutrinos should we be fortunate enough to detect a supernova in our own galaxy. Thus there is substantial motivation to use chemical additives in both Super-Kamiokande and in possible future megaton scale detectors.
In addition to neutrino detection, WCDs are now being considered as active water shields for some next-generation Dark Matter (DM) / Weakly Interacting Massive Particle (WIMP) detectors. Such particles could comprise all or part of the DM in the universe. Experimental searches for WIMPs have been going on for 20 years with ever increasing sensitivity. Recently, liquid nobel gas detectors have shown great promise for further extending the search one or two more orders of magnitude. In these detectors, WIMPs would show up as low energy nuclear recoil events in a heavy liquid target such as xenon or argon.
Nuclear recoil events produced by the interaction of non-thermal neutrons in the target are a significant background for these experiments. A transfer via elastic scatter, followed by neutron escape from the detector, can mimic a WIMP recoil. While tagging of a large fraction of muon-induced events is possible with a simple muon veto system, direct rejection of un-vetoed or non-muon initiated nuclear recoils is more difficult. Pulse Shape Discrimination (PSD) is of no help here, since single neutron-induced recoils are essentially identical in light and charge deposition and timing to WIMP-induced ones. A dangerous source of background are radioactive U/Th contaminants in the materials of the detector itself, with a major worry being (,n) reactions on boron and silicon in the PMTs.
One way to reduce internal neutron backgrounds is to efficiently tag those neutrons that leave the central detector sensitive volume. Estimates from the LUX collaboration show that this could potentially reduce such backgrounds by an order of magnitude. Thus there is great interest in gadolinium doping of water for DM searches.
There are three potential problems associated with gadolinium doping of water:
- 1.
The additive might reduce the transparency of water in the UV, seriously reducing detector sensitivity.
- 2.
The additive might induce corrosion that would affect the mechanical strength of the detector components.
- 3.
Corrosion product ions might absorb light in the UV, reducing detector sensitivity.
Thus before any of these experiments can be done it is crucial to understand the effect of the gadolinium dopant on the detector itself to avoid the ‘law of unintended consequences.’
One of the least expensive and most readily available gadolinium compounds is gadolinium chloride (GdCl3). It is highly soluble and known to be relatively benign environmentally and from a health safety point of view. In this paper, we report the first results from a three year study on the effect of GdCl3 on detector materials and water transparency relevant to existing and future water Cerenkov detectors.
2 Experiment Description
2.1 Experimental Apparatus
Figure 2 is a schematic of the LLNL Water Cerenkov Transmission Facility (WCTF). It consists of a water purification system (water resin demineralizers, conductivity sensor, 0.22m and 5m filters, polypropylene transfer piping, a mixing tank, and 1.27cm diameter 304L grade stainless steel transfer piping which is used to fill the Light Transmission Arm (LTA). The LTA is a 9.6m, 20.3cm diameter 304L stainless steel pipe which can be filled with pure or doped water. During the process of mixing the GdCl3, nitrogen gas is bubbled through the mixing tank to reduce the dissolved oxygen content in the system.

The water purification system is capable of providing high purity water (Resistivity 17.5M cm) to the stainless steel LTA at a flow rate of 5.711.4 lpm. This resistivity value corresponds to total dissolved solids of 40 ppb. The mixing tank, LTA and transfer piping contain a total of about 570 liters and the turnover time (at a typical flow rate of 9.5 lpm) is approximately one hour.
The effects of exposure to GdCl3 on materials used in Super-Kamiokande was previously reported in [12]. Additional testing was conducted by placing two 50.8cm Super-Kamiokande PMTs in a 2470 liter stainless steel storage tank filled with GdCl3. The results of these tests will be reported at a later date.
The system is capable of testing the attenuation length of water at three wavelengths. The output of an L.S.I. VSL-337ND-S pulsed nitrogen laser can produce a 337nm beam directly. In addition, the N2 laser output can pump organic dyes. The two dyes used were Stilbene-420 which produces a 420nm pulse and PPBO which produces a 400nm pulse.
Figure 3 shows the detector optics arrangement used for the conduct of the transparency testing. The optics are arranged on optical tables and enclosed in two light-tight boxes at both ends of the LTA. The LTA is closed at both ends by 0.8cm thick ultraviolet light transmitting (UVT) acrylic windows. Except for a 3cm 20cm slit, the two acrylic windows at each end of the LTA are covered by black plastic to prevent unwanted external light from entering. The LTA contains four identically sized baffles spaced at intervals in the interior to remove scattered light. The L.S.I. laser generates a 337nm 4ns pulse at approximately 2 Hz. The laser beam is collimated by two apertures of 6.3mm and 3.0mm diameter. The beam is then split by a UV non-polarizing cube beam-splitter.
One part of the beam - designated the primary (P) beam - is sent directly into a coated integrating sphere and then through a UV transmitting liquid lightguide (Lumatec Series-250) to a white rectangular integrator which houses a mu-metal shielded PMT (Hamamatsu H3378-50). The other beam - designated the reflected (R) beam - is transmitted directly through the UVT acrylic window into the LTA. The R beam exits the far end of the LTA into a light-tight enclosure which houses a 5.08cm diameter UV mirror (Newport Optics BBDS-PM-2037-C 99 reflectivity). This mirror is aligned to reflect the R beam back through the LTA and into the laser enclosure. After re-entering the laser enclosure, the R beam is transmitted through a 10 transmitting neutral density filter (ND) into a spherical integrator (for 337nm) or an acrylic ‘light-box’ containing a solution of LUDOX (HS-40 12nm diameter colloidal silica) and pure water (for 400nm and 420nm). The R beam is then transmitted through a separate Lumatec lightguide into the rectangular enclosure housing the PMT. Use of the same PMT to measure both the reflected and primary pulses allows us to cancel PMT gain variations.

2.2 Description of Measurements
The change in the attenuation length of the GdCl3-water solution can be determined by measuring the change in the ratio of the R laser pulse to the P laser pulse over time.
Let
| (1) |
where is the intensity of the pulse at the distance through the LTA, is the initial intensity and is the attenuation coefficient in m-1. Assuming that P, R are proportional to Io and I respectively, then:
| (2) |
where is the intensity of the reflected pulse and and are constants of proportionality. We define the ratio:
| (3) |
Letting be the ratio in pure water and be the ratio after adding GdCl3, then:
| (4) |
where the unknown constants and cancel. The uncertainty in is then given by:
| (5) |
Typical values for pure water at UV wavelengths are 0.01 m-1 0.02 m-1.
2.3 Methods
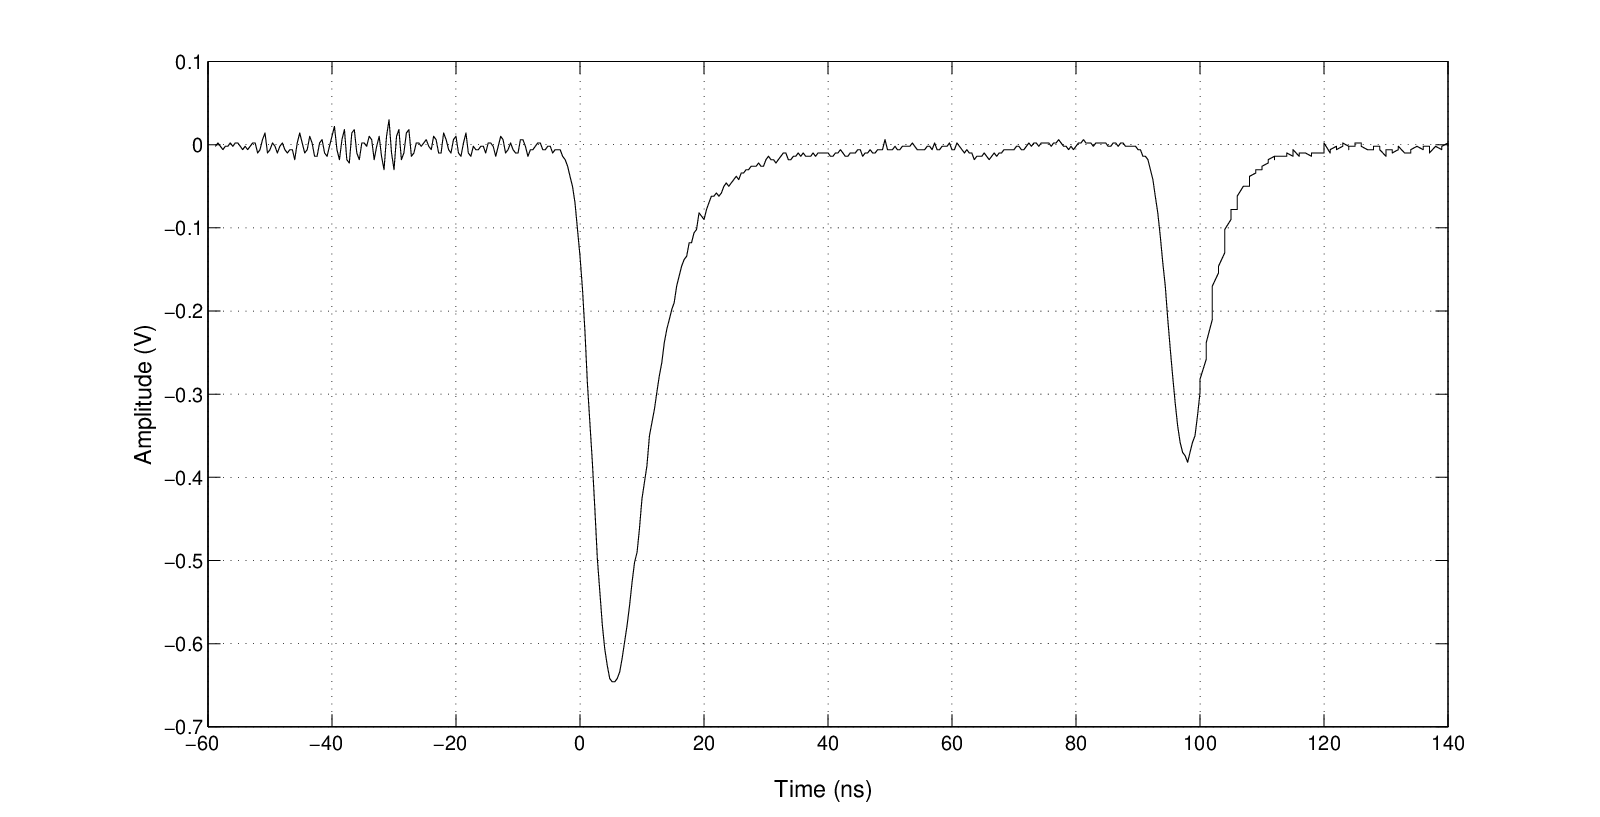
The P and R beams were observed as two pulses well separated by about 90ns on a Tektronix DPO 4034 digital oscilloscope. Figure 4 shows a typical trace for a double pulse at 337nm. To determine the intensities, we integrate over the area of the single P and R pulses and then calculate the ratio R / P. To obtain , we find the mean and variance of one-hundred separate pulses taken over a duration of about three minutes. This set of 100 pulses will be referred to as a ‘measurement’.
In order to understand the response of the detector to changes in transparency caused by the addition of GdCl3, we conducted a series of ‘control’ experiments by adding only pure water to the LTA and performing measurements identical to those to be performed with the GdCl3 water solution.
Before each measurement, the reflected beam was aligned to the same point at the entrance of the R beam light integrator and re-checked for alignment after completing each measurement. Typically it took about 10 minutes to take all readings between alignment checks. If the beam moved more than about 2cm from the initial point of alignment, the measurement was discounted and a new measurement was taken after the apparatus had come to equilibrium.
To prove the stability of our detector, another control experiment conducted was to circulate pure water through the water purification system and the LTA, secure the recirculation and then take measurements of over a two week period while it remained sitting in the LTA (i.e. no circulation). These measurements are shown as a function of time in Figure 5 and indicate a 12.5 decrease in over the period of more than two weeks. While the cause of the loss of transparency is unclear, it is of interest to note that the 1.0 per day fall off in transparency is less than that typically observed in SK with the recirculation turned off, even though the stainless steel surface to volume ratio of our apparatus is almost 200 times larger.

For the 337nm and 420nm measurements, the amplitudes of both P and R were approximately equal for the pure water measurements. This condition ensured that the response of the detector to both the P and R pulses is the same. However, this condition was not met for the case of the 400nm measurements due to the poor efficiency of the PBBO dye. Because of this fact, an independent alignment of the optical system at 400nm was not possible. As a consequence, the alignment uncertainty is greater for 400nm than the other two wavelengths as discussed in the section on uncertainties.
3 Uncertainty
Our measurements are affected by four significant sources of uncertainty. The first of these is associated with the variation in the pulse-to-pulse measurement of over short time intervals due to thermal turbulence in water and the the vibrational motion of optical components. To quantify this uncertainty, we take the average of the measured 100 pulse variation at each wavelength for each measurement of in pure water. The values determined are: for 337nm: ; for 400nm: ; and for 420nm: .
A second uncertainty was associated with reproducibility of the the R beam alignment. This uncertainty was quantified by conducting alignments of 10 randomly ‘misaligned’ beams in rapid succession and obtaining the variations in the measurements of . Based on these measurements, the following estimates for the uncertainty were obtained: for 337nm: ; and for both 400nm and 420nm: .
Another uncertainty is associated with the linearity of the system response to changes in light transparency. In this report no measurement of below 45 were made so only the detector response above this value is addressed. To determine the detector linearity uncertainty, UV transmitting ND filters were inserted between the beam-splitter and the LTA and the measured compared to the expected light transmission. The transmission of each of the ND filters was measured using a calibrated monochromometer to better than 0.5. Figure 6 shows the normalized value plotted against the filter transmittance. In this case, ‘normalized’ means that the value with no filter present is taken to be 1. The uncertainty in the light transmission linearity is conservatively taken to be the difference in the slope of a fitted line from 1. The corresponding uncertainties are: for 337nm; for 400nm and for 420nm.


Lastly, there was an uncertainty associated with the longterm stability of our detector. This uncertainty was quantified by determining the value of after the GdCl3 had been removed from the LTA and pure water re-added. We were able recover the original pure water baseline to within 1.0, 2.5 and 2.0 for 337nm, 400nm and 420nm wavelengths, respectively. These values are taken as conservative estimates of the long-term drift. Table 1 lists the estimated uncertainties for our measurements at each wavelength.
| Wavelength | |||
| Uncertainty | 337nm | 400nm | 420nm |
| ShortTerm Stability | 0.6 | 4.4 | 2.0 |
| Alignment | 1.0 | 2.0 | 2.0 |
| LongTerm Stability | 1.0 | 2.5 | 2.0 |
| Linearity | 0.8 | 1.1 | 1.6 |
| Total | 1.7 | 5.6 | 3.8 |
4 Results
4.1 The Addition of GdCl3 to Pure Water
To ensure instrument stability and determine the longterm uncertainty as described in Section 3, a pure-water baseline from which to measure the relative change in transparency was obtained prior to adding the GdCl3.
To ensure that this procedure did not effect transparency, we the addition of GdCl3 by mixing pure water from the mixing tank through the m and m filters, and the UV sterilizer. The pure water was not sent through the de-ionizer since after the GdCl3 is mixed with water this solution does not go through the de-ionizer. The pure water was then circulated through the LTA for 3 hours, the same length of time used for mixing the GdCl3 with water. No significant change was observed at any of the three wavelengths immediately after the chemical addition.
1.23Kg of GdCl36H2O was added and mixed with 610L of pure water contained in the mixing tank and stainless steel piping to give a concentration of GdCl3 by weight. The procedure for adding the GdCl3 to the LTA was as follows:
- 1.
The GdCl3 was initially mixed in a 1 liter beaker of pure water.
- 2.
The GdCl3 - water solution was then added to the poly-propylene mixing tank and mixed using the stainless steel motor-driven stirrer for 1015 minutes.
- 3.
The system valve-alignment was changed to by-pass the de-ionizer.
- 4.
The GdCl3 - water solution was circulated from the mixing tank through the m and m filters and UV sterilizer.
- 5.
The inlet and outlet valves to the LTA were opened and the GdCl3 - water solution was circulated through the LTA for approximately three hours (roughly 3 turn-over times).
- 6.
The LTA inlet and outlet valves were closed and the water pump was secured.
The results of measurements obtained after addition of GdCl3 observed for roughly a 2 day period are shown Figure 7. Two results are clear. First, the decrease in over time was consistent with a linear decrease. In fact, since the GdCl3-water solution remains undisturbed in the LTA after it is mixed, this result suggests a proportionality between decreasing transparency and a change in water quality due to increasing water exposure (with time) to the stainless steel LTA surface. This point should be stressed: following the mixing of the GdCl3 with the water, the LTA is isolated. The GdCl3 solution has no contact with anything except the LTA surface, the PVC baffles in the LTA and the acrylic LTA windows.


Table 2 provides the fitted slope and the y-intercept values (for T 0) for all three wavelengths. The last column of Table 2 indicates the level of dissolved oxygen at the time that the GdCl3 was mixed with the pure water. The slope and intercepts in Table 2 correspond to the following values for at the 90 confidence level: = 3.4 28.0 m-1, = 5.3 66.0 m-1 and = 1.2 53.0 m-1.
| pure water | slope | intercept | reduced | O2 | |
|---|---|---|---|---|---|
| nm | mean | 10-4 (hr-1) | (ppm) | ||
| 337 | 0.62 | -42.0 1.7 | 0.619 0.006 | 0.60 | 0.90 |
| 400 | 0.10 | -6.2 0.4 | 0.100 0.002 | 0.33 | 0.15 |
| 420 | 0.73 | -30.0 2.9 | 0.744 0.019 | 0.61 | 0.15 |
At all three wavelengths, the fitted line intercepts the t = 0 axis at a value consistent with the pure water baseline value. This provides strong evidence that the addition of the GdCl3 alone does not instantaneously decrease water transparency. Rather, it suggests that the drop in results from the introduction of impurities to the GdCl3 water solution from it’s exposure to the walls of the stainless steel pipe.
4.2 Change in Transparency due to the Presence of Iron in Water
As discussed above, measurement of made after the addition of GdCl3 indicates that the addition alone does not cause a direct loss of transparency and that the loss of transparency over time is linear. These results suggest that exposure of the solution to the surface of the stainless steel LTA may be a source of the decrease in . Clearly, one source of potential contamination is Iron (Fe) since it is a strong absorber of UV.
To investigate the concentrations of iron required to reduce transparency in our apparatus, small amounts FeCl3 were added to pure water in the mixing tank after by-passing the DI and removing the filters in the water purification system. The filters were removed from the system to ensure that any iron in the water would not accumulate on the filters. Table 3 shows the change in due to the addition of 14ppb and 28ppb of FeCl3 in pure water at a wavelength of 337nm.
| pure water value | 14ppb FeCl3 in water | 28ppb FeCl3 in water |
|---|---|---|
| 0.901 0.018 | 0.355 0.018 | 0.156 0.008 |
As seen in the table, the change in due to the addition of only 14ppb of FeCl3 to pure water results in a reduction in to about of 40 of the pure water value while the addition of 28ppb of FeCl3 to water drops to 16 of the pure water value.
It is clear that the presence of extremely small amounts of FeCl3 significantly reduce water transparency.
5 Conclusion and Future Work
We have shown that GdCl3 is problematic for use as a dopant for detectors lined with stainless steel (e.g. Super-Kamiokande) due to it’s effects on water transparency. At concentrations of 0.2 by weight, the transparency of the GdCl3 doped water decreases rapidly over time scales of a few days for all three UV wavelengths tested. However, since the addition of GdCl3 by itself does not reduce transparency, it may be suitable for detectors made of non-corrosive materials.
The significant benefits of using gadolinium doped WCDs suggest that additional investigation is required to test the effect of GdCl3 on other materials. In this vein, we plan additional tests to examine the effect on transparency of materials such as polyethylene jacketed steel and acrylic. Additionally, other chemicals such as Gd2(SO4)3 and Gd(NO3)3 should be tested for suitability as a gadolinium WCD dopant.
6 Acknowledgment
The authors gratefully acknowledge useful discussions with Henry Sobel, William Kropp, Mark Vagins and Michael Smy. This work was performed under the auspices of the U.S. Department of Energy by Lawrence Livermore National Laboratory under Contract DE-AC52-07NA27344 and was supported by Livermore Directed Research Program funding (LDRD 06-FS-011) and U.S. Department of Energy grants DE-GF02-91ER40674 and DE-FG02-91ER40617.
References
- [1] K.S. Hirata et al.,Phys. Rev Lett. D38 (1998) 448.
- [2] Y. Fukuda et. al., Phys. Rev Lett., 77 (1996) 1683.
- [3] K.S. Hirata et. al., Phys. Rev Lett., D44 (1991) 2241.
- [4] S.H. Ahn et. al., Phys. Rev Lett., B511 (2001) 178.
- [5] T. Hakaya Nucl. Phys. B (Proc. Suppl.) 138 (2005) 376.
- [6] Y. Hayato et al., Phys. Rev. Lett., 83 (1999) 1529 - 1533.
- [7] M. Shiozawa et. al., Phys. Rev Lett., 81 (1998) 3319.
- [8] The SK Collaboration Nucl. Instrum. Meth., A501 (2003) 418-462.
- [9] M. Malek et. al., Phys. Rev Lett., 90 061101 (203)
- [10] A. Bakalyarov et. al., Kurchatov Institute Unpublished Report UAE-5853/2 1995
- [11] J. Beacom and M. Vagins, Phys. Rev Lett., 93 171101 (204)
- [12] R. Svoboda, Results from Long-Term Soak Testing of Super-Kamiokande Materials in a 2 GdCl3 Aqueous Solution Unpublished D.O.E. report (2004)