Hidden quantum spin gap state in the static stripe phase of La2-xSrxCuO4
Abstract
Low energy spin excitations were investigated in the static stripe phase of La2-xSrxCuO4 using elastic and inelastic neutron scattering on single crystals. For in which long-range static stripe order exists, an energy gap of = 4 meV exists in the excitation spectrum in addition to strong quasi-elastic, incommensurate spin fluctuations associated with the static stripes. When increases, the spectral weight of the spin fluctuations shifts from the quasi-elastic continuum to the excitation spectrum above . The dynamic correlation length as a function of energy and the temperature evolution of the energy spectrum suggest a phase separation of two distinct magnetic phases in real space.
pacs
Valid PACS appear hereAfter two decades of extensive investigation, some universal characteristics of the magnetic excitations in hole-doped high transition temperature () superconducting cuprates are beginning to emerge. Recent high-energy inelastic neutron scattering studies have shown that, regardless of whether the phase is superconducting or not, YBa2Cu3O6+y (YBCO) [1], La2-xBaxCuO4 (LBCO) [2] and La2-xSrxCuO4 (LSCO) [3, 4] exhibit strong incommensurate spin fluctuations with an hour-glass type dispersion at high energies: downward and upward dispersing branches of excitations meeting at the point. Several conflicting theories have been proposed to explain the hour-glass excitations that can be grouped into two categories: dynamic stripe models [5, 6] and interacting itinerant fermion liquid models [7, 8]. At the heart of this controversy lies the issue concerning the role of the spin stripes in the mechanism of superconductivity. There is now a consensus that the static stripes suppress superconductivity as observed when the hole concentration, , corresponds to the magic number of 1/8 in LBCO and LSCO. When moves away from 1/8, rapidly increases and the static stripes disappear. On the other hand, the incommensurate spin fluctuations remain strong in the superconducting region of the phase diagram and the incommensurability is proportional to the superconducting phase transition temperature in the underdoped region [9]. Thus, understanding how the static stripes and incommensurate spin fluctuations are related may provide useful insights towards resolving the controversy. This calls for an investigation of the low energy magnetic excitations in the static stripe phase.
In addition to the formation of static stripes as observed in [10, 11], spins respond at low energies by opening a spin gap as observed in 0.15, the optimal doping concentration [12, 13]. So far, the two features seem to be exclusive of each other: namely, when static stripes exist, the spin gap does not open and vice versa. Here we show that this is not the case. By performing low-energy inelastic neutron scattering experiments in the static stripe phase of LSCO, we show that even in the presumed static stripe phases ( and 0.13), a spin gap feature exists in addition to quasi-elastic incommensurate spin fluctuations. The spectral weight shift occurs gradually from above to below as changes from 0.14 to 0.125 while their characteristic wave vectors remain the same. Furthermore, the dynamic correlation length of the spin fluctuations, , determined by the inverse of the intrinsic -linewidth of constant energy scans, is shorter for the excitations above , 50 Å, and is essentially constant for all the concentration considered, than for those below for , 300 Å. These suggest that there might be a phase separation in the spin stripe phase (): the superconducting regions with the gapped excitations and the non-superconducting regions of static stripes.
We have grown several single crystals of LSCO with four different nominal concentrations, , 0.13, 0.135, and 0.14, using the traveling solvent floating zone (TSFZ) method [14]. Typically, 7 mm diameter and 10 cm long crystals were made for each composition. The crystal was cut into several pieces, two large ones for neutron scattering and small pieces for other characterization measurements. The small pieces from different parts of the original crystal along the rod were used to determine the composition of La, Sr, Cu ions using the inductively coupled plasma (ICP) analysis. The results are listed in Table 1. The two large pieces for neutron scattering weighed about 17 g in total for each composition. Bulk susceptibility was measured using a superconducting quantum interference magnetometer (SQUID). Elastic and inelastic neutron scattering measurements were performed in the (,,0) scattering plane at the cold-neutron triple-axis spectrometer, SPINS, at the NIST Center for Neutron Research and also at the thermal-neutron triple-axis spectrometer, TOPAN, at the Japan Atomic Energy Agency. The experimental configurations for neutron scattering measurements are described in the caption of the figure with the corresponding data. Elastic and inelastic intensities from different compositions were normalized to their sample volumes.
| nominal | (midpoint) | (onset) | ||
|---|---|---|---|---|
| 0.130(5) | 36.3 K | 37.1 K | ||
| 0.125(5) | 33.7 K | 35.8 K | ||
| 0.120(6) | 30.9 K | 34.9 K | ||
| 0.115(6) | 27.8 K | 32.1 K |
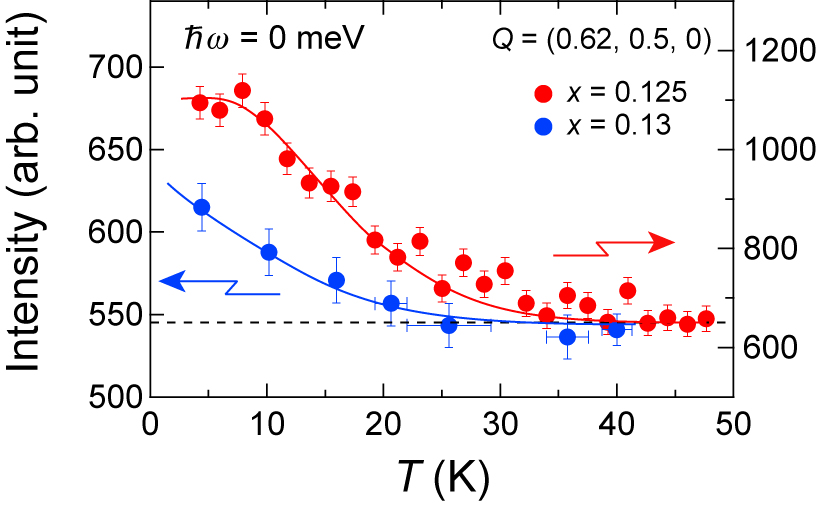


As listed in Table 1, the superconducting (SC) transition temperatures are consistent with previously reported measurements [15]. Near = 1/8, static magnetic incommensurate (IC) peaks appear at low temperatures due to the formation of spin stripes[16]. Fig. 1 shows that the spin stripe ordering temperature is K for LSCO (). When moves away from 1/8, the spin order appears at a lower temperature, K for , and the peak intensity weakens (see blue circles in Fig. 1). By , the peak becomes undetectable. Previous neutron scattering studies have reported that when the hole concentration is close to the optimal doping , the static order disappears and a spin gap opens up at meV [12, 13].
In order to investigate how the two features, the static stripe and the spin gap state, evolve with the hole concentration, , we have systematically performed low energy inelastic neutron scattering measurements on La2-xSrxCuO4 with the four different Sr concentrations from = 0.125 to = 0.14. Fig. 2 shows constant energy () scans performed as a function of momentum transfer along the (0.5,,0) direction as shown in Fig. 2 (d). For 6 meV (Fig. 2 (a)), strong inelastic IC spin fluctuations are present in all concentrations. When the energy transfer is lowered to meV and 2 meV (Fig. 2 (b) and (c)), the spin fluctuations are still strong for and 0.13 that have the static spin stripe order. For when the static order is absent, however, the low energy spin fluctuations become very weak. This suggests an opening of a spin gap for at 3 meV, as expected since is approaching the optimal [12, 17, 13]. More interesting in Fig. 2 is that even for and 0.13 the spin fluctuations are weaker for meV than for meV and 6 meV, that will be discussed below in more detail.
We have performed similar constant- scans at 4 K with several different values up to 11 meV in order to study the low energy dependence of the IC spin fluctuations. The data were fit to the four scattering rods stemming from the four IC reflections convoluted with the instrumental resolution function to extract the imaginary part of the -integrated spin susceptibility, and the intrinsic linewidth, . Fig. 2 (e) and (f) show the results. Fig. 2 (e) shows that for and 0.14, there is a spin gap of meV below which no magnetic scattering was observed. For = 0.13 and 0.125, the spin gap is filled but there seems to be a dip at meV. In order to investigate more carefully the dip feature in the energy spectrum, we have performed inelastic neutron scattering measurements with a sub-meV energy resolution available at the cold-neutron triple-axis spectrometer, SPINS. Fig. 3 (a)-(c) shows constant- scans measured at and at 4 K as a function of for , 0.13 and 0.135. It is clear that when there is no static IC order for the spectrum has a spin gap of meV above which increases with increasing (see Fig. 3 (a)). When there is static IC order in and 0.13, on the other hand, additional IC spin excitations appear below the gap. A similar low energy spin gap feature has also recently been observed in La1.8Sr0.14Ce0.06CuO4 [21]. Two features should be noted here: (1) Even in the static spin stripe phase ( and 0.125) the energy spectrum has a dip at meV at which is weak (see Fig. 3 (b) and (c)) [22]. (2) The low energy IC spin excitations below appear at the expense of those above . As shown by filled triangles in Fig. 4, our values divided by the Boltzmann constant, , are close to the previously determined spin gaps for higher doping concentrations (open triangles), all of which seem to be close to (dashed line). For comparison, for YBCO [24, 25]. Further studies near the critical concentration () are necessary in order to clarify the relationship between and in LSCO.
What is the origin of the dip in the energy spectrum of ? The intrinsic -linewidth, , as a function of , that is inversely proportional to the dynamic spin correlation length, can provide important information on this issue. As shown in Fig. 2 (f), at 4 K , 0.02 Å-1 (or 50 Å) for meV for all concentrations considered, while it is much shorter, Å-1 (or 300 Å) for meV for the static stripe phase ( and 0.125). This suggests that the low energy spin fluctuations that exist below the energy dip () for have different characteristics than the fluctuation above the dip. We also studied how the low and high energy excitations of the samples evolve upon warming by performing the energy scan on the = 0.13 sample at various temperatures. As shown in Fig. 3 (d), the dip feature in the energy spectrum seems to survive at 15 K at which the static spin stripe exists, while for at which the static spin stripe is melted the dip is now replaced by a single lorentzian behavior as expected for a paramagnetic phase. Furthermore, measured at 60 K becomes nearly constant for all up to 8 meV (red symbols in Fig. 2 (f)). These suggest that the dip feature may be an indication of the existence of two magnetic phases in LSCO () that are distinctly separated in real space.
There is an additional feature in the energy spectrum of x = 0.125 (Fig. 3 (c)): a dip below meV. This is not uncommon in a system that undergoes a spin freezing upon cooling that a static central mode appears and very low energy spin excitations become damped. Such behaviors have been observed in cuprates such as meV in the spin glass phase of LSCO () [26] and meV in the SC phase of YaBa2Cu3O6.353 [27]. Recently, similar behavior was also observed in LSCO () and was interpreted as related to the spin gap of the optimal concentration. [28] As shown in Fig. 4, however, the gap value of 1 meV (the open triangle at ) lies on the dotted dashed line connecting the two values for and 0.125, which suggests that the gap is associated not with superconductivity but with observed for and in the spin glass phase. This interpretation is supported by a very recent work on LBCO () [29] that showed the 1 meV gap is insensitive to the external magnetic field.
Our neutron scattering data showed that for LSCO () a static stripe order appears along with low energy spin excitations below the spin gap at the expense of spin fluctuations above the gap, leaving the spin gap intact. The features observed in the spin excitation spectrum above and below have the same characteristic incommensurate wave vector, and the gradual shift in their spectral weight with changing indicates that the two features have the same origin. On the other hand, our finding that the intrinsic -linewidth, dramatically changes at in the static stripe phase suggests a real space phase separation of two distinct magnetic phases: the superconducting regions with gapped spin fluctuations and nonsuperconducting regions with static spin stripes. Another scenario can be that low frequency motions of the domain walls between the spin stripes may be responsible for the observed exotic low energy spin fluctuations.[30] A recent SR study suggested that in cuprates there are two distinct phases separated in real space: regions with fluctuating moments and other regions with frozen moments, and their volume fractions change with [31], supporting the first scenario of phase separation. However, the exact origin of the spin gap feature in LSCO () could be fully understood by further studies, such as magnetic field effects on the spin fluctuations below and above .
We thank J. M. Tranquada, Y. B. Kim, M. Matsuura, T. Matsumura for helpful discussions, C. H. Lee, K. Hirota and T. J. Sato for their support during sample growth and bulk property characterization. Work at University of Virginia was supported by the US DOE through DE-FG02-07ER46384 and the US DoC-NIST through 70NANB7H6035.
References
- [1] M. Arai et al., Phys. Rev. Lett. 83, 608 (1999); P. Bourges et al., Science 288, 1234 (2000); S. M. Hayden et al., Nature 429, 531 (2004); D. Reznik et al., Phys. Rev. Lett. 93, 207003 (2004); C. Stock et al., Phys. Rev. B 71, 024522 (2005); V. Hinkov et al., Nature Physics 3, 780 (2007)
- [2] J. M. Tranquada et al., Nature 429, 534 (2004)
- [3] N. B. Christensen et al., Phys. Rev. Lett. 93, 147002 (2004); M. Kofu et al., cond-mat/0710.5766 (2007)
- [4] V. Vignolle et al., Nature Physics 3, 163 (2007)
- [5] C. D. Batista et al., Phys. Rev. B 64, 172508 (2001)
- [6] G. S. Uhrig et al., Phys. Rev. Lett. 93, 267003 (2004); C. D. Batista et al., cond-mat/0511303; G. Seibold et al., Phys. Rev. B 73, 144515 (2006); M. Vojta et al., Phys. Rev. Lett. 97, 097001 (2006)
- [7] D. K. Morr et al., Phys. Rev. Lett. 81, 1086 (1998)
- [8] I. Eremin et al., Phys. Rev. Lett. 94, 147001 (2005); M. R. Norman, Phys. Rev. B 75, 184514 (2007); I. Eremin et al., Phys. Rev. B 75, 184534 (2007)
- [9] K. Yamada et al., Phys. Rev. B 57, 6165 (1998)
- [10] T. Suzuki et al., Phys. Rev. B 57, R3229 (1998)
- [11] H. Kimura et al., Phys. Rev. B 59, 6517 (1999)
- [12] S. Petit et al., Physica B 234-236, 800-802 (1997).
- [13] C. H. Lee et al., J. Phys. Soc. Jpn. 69, 1170 (2000).
- [14] M. Kofu et al., Phys. Rev. B 72, 064502 (2005).
- [15] H. Takagi et al., Phys. Rev. B 40, 2254 (1989).
- [16] J. M. Tranquada et al., Nature 375, 561 (1995).
- [17] K. Yamada et al., Phys. Rev. Lett. 75, 1626 (1995).
- [18] K. Hirota, Physica C 357-360, 61-68 (2001).
- [19] B. Lake et al., Nature 400, 43 (1999).
- [20] R. Gilardi et al., Europhys. Lett. 66, 840 (2004).
- [21] M. Enoki et al., arXiv:0804.2723.
- [22] The dip in the energy spectrum is very clear for (Fig. 3 (b)) while it is less obvious for (Fig. 3 (c)). However, as shown in Fig. 2 (f) shows the same sharp change in energy at meV for both concentrations, which we believe manifests the existence of the dip even in the compound.
- [23] C. H. Lee et al., Phys. Rev. B 67, 134521 (2003).
- [24] J. Rossat-Mignod et al., Physica B 192, 109-121 (1993); P. Bourges et al., Physica B 215, 30-40 (1991); P. Dai et al., Phys. Rev. B 63, 054525 (2001).
- [25] Note that for YBCO was determined as the mid-point of the upturn of the intensity [24] while for LSCO is the energy above which the excitations appear.
- [26] W. Bao et al., Phys. Rev. B 76, 180406(R) (2007).
- [27] C. Stock et al., Phys. Rev. B 73, 100504(R) (2006).
- [28] J. Chang et al., Phys. Rev. Lett. 98, 077004 (2007).
- [29] J. S. Wen et al., arXiv:0810.4085.
- [30] J. Zaanen et al., Phys. Rev. B 53, 8671 (1996).
- [31] A. T. Savici et al., Phys. Rev. Lett. 95, 157001 (2005).