Thickness dependence of the exchange bias
in epitaxial manganite
bilayers
Abstract
Exchange bias has been studied in a series of La2/3Ca1/3MnO3/La1/3Ca2/3MnO3 bilayers grown on (001) SrTiO3 substrates by ozone-assisted molecular beam epitaxy. The high crystalline quality of the samples and interfaces has been verified using high-resolution X-ray diffractometry and Z-contrast scanning transmission electron microscopy with electron energy loss spectroscopy. The dependence of exchange bias on the thickness of the antiferromagnetic layer has been investigated. A critical value for the onset of the hysteresis loop shift has been determined. An antiferromagnetic anisotropy constant has been obtained by fitting the results to the generalized Meiklejohn-Bean model.
I Introduction
Since the work of Meiklejohn and Bean,[1] structures in which ferromagnetic (F) and antiferromagnetic (AF) materials are juxtaposed, have been known to exhibit additional unidirectional anisotropy. This anisotropy was attributed to the exchange interaction between the F and AF spins at the interface between the materials and manifested itself in hysteresis loop measurements as a shift of the magnetization curve along the field axis. The shift is traditionally used to measure the size of the effect and is referred to as “exchange bias.” For the last 50 years, a vast amount of research, both experimental and theoretical, as well as (more recently) numerical calculations, has been undertaken to discern the nature of interfacial AF/F exchange coupling.[2, 3, 4, 5, 6] A complete theory, which would explain and correctly predict the various manifestations of exchange anisotropy, is still lacking. However, a number of models have been proposed and mechanisms have been identified, by which this anisotropy may occur. The models also predict values of the magnetization curve shift and enhanced coercivity, their relationship to material properties, as well as dependencies on the cooling field, temperature, strain, and thicknesses of AF and F layers. Experiments with AF/F interfaces involving various measurement techniques have been carried out to quantify the exchange bias effect in many material systems and structures. For instance, the experimentally measured dependence of exchange bias on the AF layer thickness allows one to test theoretical predictions and at the same time is important from the applications standpoint.
Here, we report measurements of the dependence of the exchange bias effect in epitaxial La2/3Ca1/3MnO3/La1/3Ca2/3MnO3 bilayers on the thickness of the AF layer. Heterostructures of calcium doped lanthanum manganites are particularly suitable for investigations of interfacial effects such as exchange bias. Their rich phase diagram allows for the possibility of both ferromagnetic and antiferromagnetic compounds, which have similar and well matched crystal structures. Growth conditions for these materials are similar, which allows one to fabricate heterostructures with atomically sharp interfaces. Exchange-biased manganite multilayers have been grown on LaAlO3 and SrTiO3 substrates by laser ablation[7, 8, 9, 10] and by molecular beam epitaxy (MBE).[11, 12, 13, 14]
II Experimental Procedures:
Fabrication and Characterization
The bilayers under study were grown using the method of ozone-assisted MBE in the block-by-block mode.[15] This approach has been successfully employed in the fabrication of high quality thin films and heterostructures of a variety of perovskite oxides.[16, 15, 17, 18, 11, 12, 13, 14, 19, 20, 21, 22] Our films were grown at 700-750 ∘C on SrTiO3 (001) substrates, which offer a good lattice match to La(1-x)CaxMnO3.[23] The ozone partial pressure was Torr while the base pressure was in the high to low 10-10 Torr range. The details of the growth apparatus and procedures have been described elsewhere.[24] A layer of La2/3Ca1/3MnO3 (F) about 190 Å in thickness was deposited first. It was followed by layers of La1/3Ca2/3MnO3 (AF) that were 50 to 250 Å in thickness depending upon the sample. The total thickness of each bilayer was kept below 500 Å to avoid strain relaxation. The growth rate was about 8 Å/min. for La2/3Ca1/3MnO3 and about 6.5 Å/min. for La1/3Ca2/3MnO3. The reflection high energy electron diffraction (RHEED) patterns observed during growths oscillated with periods corresponding to one monolayer deposition times. Streaky patterns and the absence of extra features indicated a smooth growth without the formation of non-stoichiometric phases. Oscillations were normally stronger during the growth of the ferromagnet.
The crystal quality of the films was also characterized

using high-resolution x-ray diffractometry (XRD). The XRD data obtained from the series of bilayers suggest highly-ordered epitaxial crystal structures. The two distinct peaks seen in Fig. 1 correspond to two manganite layers (192 Å F and 250 Å AF) with slightly different lattice parameters in the direction of growth. The out-of-plane lattice parameters determined from the positions of these peaks are 3.84 Å and 3.76 Å for La2/3Ca1/3MnO3 and La1/3Ca2/3MnO3, respectively. This is consistent with the films being under tensile strain set by the substrate. The full widths at half maxima (FWHM) of the rocking curves at the (002) Bragg peaks have remarkably low values of - for all of the films studied. This confirms the high quality of these samples. In all instances, the FWHM of the F peak was found to be smaller than that of the AF peak, in agreement with the in-situ RHEED observations. Intensities of the AF peaks vary with layer thickness, the diffraction signal being at the background level for the thinnest (50 Å) AF specimens.
In order to check the stoichiometry of the compounds, single (either F or AF) layer reference samples were grown and analyzed by Rutherford back scattering and inductively coupled plasma mass-spectroscopy.

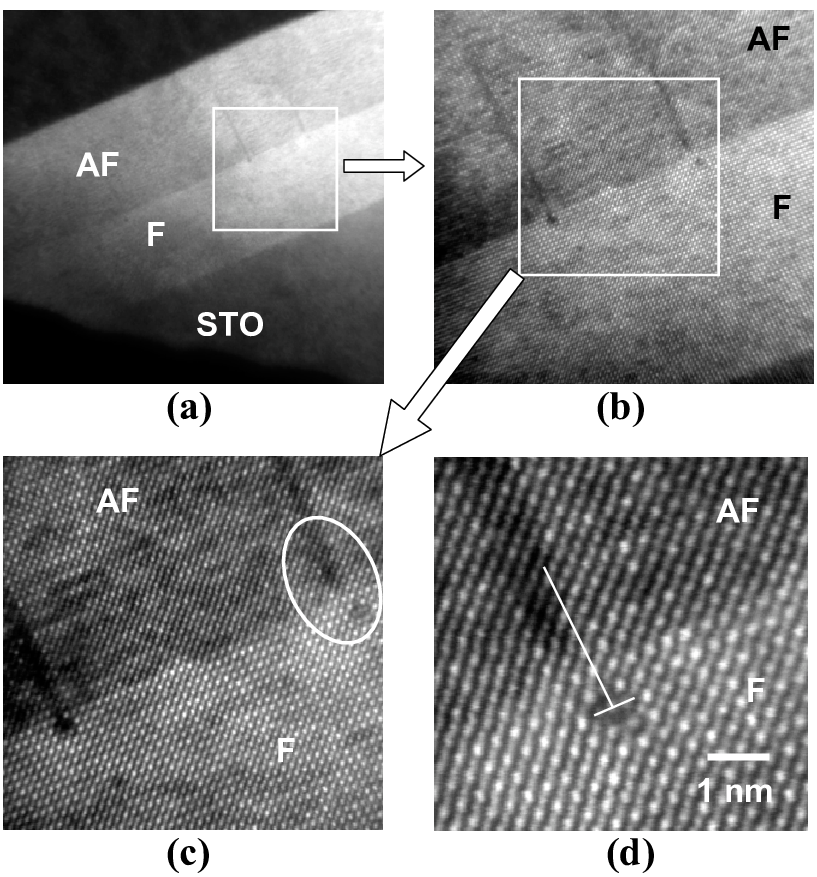
Scanning transmission electron microscopy (STEM) studies provided further insight into the structures under investigation.[25] The measurements were carried out in a VG Microscope HB501UX equipped with a Nion aberration corrector and a Gatan Enfina electron energy loss spectrometer. The microscope was operated at 100 kV. The Z-contrast images (Fig. 2) revealed sharp interfaces between the substrates and the films, as well as between the F and the AF layers. The layers are flat and continuous over large lateral distances with occasional monolayer height steps, and their observed thicknesses are in a good agreement with the values programmed for growths. The samples are free of major defects. However, in rare spots (Fig. 3), dislocations were observed.
These edge dislocations are possibly due to the mismatch between the film and the substrate, as well as between the two manganite layers, with an extra semiplane propagating into the AF layer and serving to relax the strain. We note that no such defects were observed in the sample with the thinnest AF layer, which supports the argument, because the strain relaxation of epitaxial films develops with increasing thickness. The fact that dislocations occur in bilayers near the interface and propagate into the AF layers is in agreement with our earlier assertion that the F layers are of higher crystalline quality than the AF bilayers.

Along with STEM imaging, electron energy loss spectroscopy (EELS) measurements were carried out, which allowed us to look closely at the chemical composition of the samples.[25] Figure 4 shows the electron energy loss spectra acquired while scanning the electron beam across the structure. The Ca L2,3, Ti L2,3, O K, Mn L2,3, and La M4,5 edges are shown. Panel (f) shows the average spectrum for a full line scan. Principal component analysis[26] (PCA) was applied to remove random noise. Panel (g) expands the O K region of an energy loss spectrum from the F layer. The inset shows the O K edge portion of the line scan after PCA. The agreement between the raw data and the PCA treated data is excellent. Figure 5 shows the elemental EELS integrated intensity profiles across a bilayer. The profiles are consistent with atomically sharp interfaces, of course considering that the specimens are thick in the electron beam direction and some electron beam broadening is to be expected. The upper panel in Fig. 5 shows that the compositional change occurs within a region as narrow as two unit cells (a nm or less) for the AF-F interface. The substrate-film interface appears to be broader, with a width under 2 nm (4-5 unit cells). This effect is most likely due to an enhanced beam broadening due to the fact that the STEM specimen was considerably thicker in this area. Nevertheless, this interface has no bearing on the main subject of this paper: the effect of the AF layer thickness on the exchange bias properties.

The properties of manganites are very sensitive to even small variations in both the doping level and the degree of oxygenation. As the structure of a sample is scanned in the direction of growth in the STEM-EELS study, calcium and lanthanum signals are expected to change at the bilayer interface by a factor of 2, while those of oxygen and manganese should remain at a constant level throughout the film. Our data are in a reasonably good agreement with these predictions.
The Mn oxidation state can be quantified from the analysis of the fine structure of the O K edge around 530 eV. It can be obtained from the measurement of the difference in energy between the pre-peak feature and the adjacent main peak of the O K edge. This difference, , increases linearly with Mn oxidation state in La(1-x)CaxMnO3. A linear fit can be obtained from this La(1-x)CaxMnO3 series and it can be used as a calibration for obtaining Mn valences from measurements.[27] Principal component analysis was used to remove random noise. Both the result of the analysis of raw EELS data and the PCA-treated data are plotted in Fig. 5.
Based on the information available from the EELS experiments, we conclude that manganese valence is reduced as compared to its nominal stoichiometric values of and for the F and AF compounds, respectively, which we attribute to possible oxygen vacancies and the lanthanum content being slightly above the target level within the AF layer (0.5 on the upper graph of Fig. 5). We also note that within several unit cells of the surface of SrTiO3 substrate, manganese oxidation state drops down to about . This suggests the presence of a thin (nm) magnetically dead layer. Interestingly, this was not the case in ultrathin films of ferromagnetic La0.8Ca0.2MnO3 grown by codeposition.[21, 22]
The results of the structural characterization demonstrate that the bilayers under study are of a very high crystalline quality, with precisely calibrated thicknesses of both layers. Grown without a seed or a cap layer, they preserve the stoichiometry and oxygen content, and as well are free of major defects and additional phases. The films are chemically clean and possess physically and chemically sharp interfaces, which makes them a good system for a study of the exchange bias effect.
III Experimental procedures:
Physical Measurements
The resistances of the films were measured using a Quantum Design Physical Properties Measurement System. Samples were cooled from room temperature down to 10K in an in-plane field of 100 Oe and the resistance was measured on warming in a four-point van der Pauw geometry. The right-hand graph in Fig. 6 shows the temperature dependence of the resistance of a bilayer sample. The conductivity of the bilayer is determined by that of the ferromagnet, which undergoes a transition from a metallic to an insulating state at a temperature slightly below 200K.

Magnetic properties of the bilayers were studied using a Quantum Design Magnetic Properties Measurement System. Magnetization was measured as a function of temperature on warming, after cooling a sample from room temperature to 10 K in a magnetic field. The field was applied along the [100] direction in the plane of the sample. Figure 6 shows the ferromagnetic-to-paramagnetic transition in a F 192 Å/AF 150 Å bilayer. The onset of ferromagnetism is coupled with the metal-to-insulator transition as expected from colossal magnetoresistive La2/3Ca1/3MnO3. For all of the samples studied, values of the Curie temperature, , determined by the inflection points of temperature dependence graphs, were found to be about 175 K, which is lower than that of bulk material.[28] Below 200 K, there appears a well-defined transition followed by a low-temperature plateau region. We note that this is a behavior different from that seen in magneto-thermal curves obtained for field-cooled Ca-doped lanthanum manganite heterostructures grown by laser ablation on LaAlO3 substrates.[7, 8, 9] The latter exhibit monotonic behavior without saturation of the magnetic moment at low temperatures. The behavior shown in Fig. 6 is similar to that reported in the work by Morán et al. for films and superlattices grown on single crystal (001)-(LaAlO3)0.3(Sr2AlTaO6)0.7 substrates using pulsed laser deposition.[10] Quantitatively, upon cooling in an applied field of 100 Oe, we observe a low-temperature magnetization of about 500 emu/cm3, which is significantly greater than the values reported[8, 10] for laser ablated films cooled in 10 kOe.

The Néel temperature of bulk La1/3Ca2/3MnO3 found by Herrero et al.[30] is 170 K. This value can be taken as the upper limit for in thin films. In order to set the exchange bias, bilayers were cooled from room temperature through and, subsequently, , in a 500 Oe in-plane magnetic field. A typical hysteresis loop is presented in Fig. 7. It was determined from magnetization curves taken at higher temperatures that the hysteresis loop shift vanishes at about 90 K. This is in a good agreement with the previously reported results for La2/3Ca1/3MnO3/La1/3Ca2/3MnO3 heterostructures.[14]
The low temperature magnetic moment (Fig. 6) is close to that measured in a high magnetic field (Fig. 7), which indicates that the magnetic structure of the F layer is close to single domain. For La1-xCaxMnO3 compounds with Ca doping levels , the following expression[31] can be used to estimate the average low temperature magnetic moment per chemical formula unit (i. e. per Mn) as the total of the contributions expected from Mn3+ and Mn4+ ions.
| (1) |
Given that the volume of our ferromagnetic layer is approximately cm3, we obtain a low temperature magnetization of about emu. The saturation magnetic moment measured to be -emu in all studied bilayers is in a good agreement with that calculated.
Consecutive field sweeps resulted in different coercivities for the first and the second loops only, with no noticeable changes occurring in further cycles. Training effects have been observed in a number of exchange bias systems utilizing different AF materials.[32] We note (Fig. 7) that similar to other systems,[29] the effect is stronger on the left coercive field. However, our data (Fig. 7) are different in that the shape of hysteresis loops is much the same for the first and the subsequent field sweeps. The data on the thickness dependence of exchange bias discussed next were obtained by using the values of the “trained” coercive fields[33] and to calculate the value of exchange bias as .
IV Results and Analysis
The results of our study of a series of bilayer films are presented by the plot in Fig. 8. The dependence shown is characterized by the saturation of exchange bias with the antiferromagnetic layer thickness and the existence of a critical value , below which no hysteresis loop shift occurs. In the first theoretical model proposed by Meiklejohn and Bean (MB model),[34, 35] the magnitude of the exchange bias does not depend on and is estimated from
| (2) |
where is spin of AF/F ions at the interface, is their exchange coupling constant, and and are the ferromagnetic layer magnetization and thickness, respectively.

Although there is no AF thickness dependence in Eq. (2), the exchange bias is expected to vanish when the anisotropy energy in the AF layer is not large enough to keep AF spins from reversal caused by their exchange interaction with the interfacial F spins, as the latter switch in an applied magnetic field, i. e.
| (3) |
where is the antiferromagnetic anisotropy constant. This relationship has been used before[36] to estimate .
Binek et al.[37] generalized the simple model of Meiklejonh and Bean and derived an equation, which takes into account the effect of finite magneto-crystalline anisotropy of the AF layer. According to their result, in the case of finite but strong , the exchange bias depends on the AF layer thickness as
| (4) |
where is an interface energy per unit area and the saturation value of the exchange bias at large is . This model does not explain the nature of the AF/F interfacial exchange coupling – the product enters the quantitative analysis as a phenomenological interfacial energy. The energy is a convenient measure of the effect for it does not depend on the nature of the F layer material, nor on its thickness , thus allowing one to compare different exchange-biased systems. From the data in Fig. 8 we take Oe and estimate erg/cm2, which is within the range of values reported for La1/3Ca2/3MnO3 and other antiferromagnetic materials.[2, 9]
Equation (4) can be used to fit experimental data for the AF thickness dependence. Lund et al. recently demonstrated[38] that this fitting procedure does not meet with equal success in systems with different anisotropies of the AF layer: it works reasonably well for MnF2/Fe and fails in the stronger anisotropy FeF2/Fe system. The dependence of Eq. (4) is plotted in Fig. 8 to show that the generalized Meiklejohn-Bean model satisfactory explains the rise and saturation features of the AF thickness dependence. Quantitatively, as compared to the condition (3) for the critical thickness, an additional numerical factor is introduced. Setting in Eq. (4), we get . From the data, the critical thickness is between 50 and 100 Å, based on which the AF anisotropy is erg/cm3.
As far as the assumptions made in the generalized MB approach to obtain the simple dependence of the form shown in Eq. (4), our epitaxial bilayers and the measurement set-up are similar to the model system. However, there are several differences. While uniaxial anisotropy and coherent rotation are assumed in the MB model, calcium doped lanthanum manganite films on SrTiO3 (001) substrates possess a biaxial in-plane anisotropy. Magnetization reversal in such films was shown[12] to occur through domain wall motion. As compared to magnetization curves observed in our experiment (see Fig. 7), magnetization reversal by coherent rotation in a system with a uniaxial anisotropy would likely result in a more square shape of the hysteresis loop. This, as well as some training, affects the values of the loop shift as they are calculated using the coercive fields taken from the measured magnetization curves. One can see from the data of Fig. 7 , however, that the reversal still occurs within a narrow range of field and thus the F layer state may be considered to be close to a single domain through most of the sweep cycle.
V Conclusion
Using the method of block-by-block ozone-assisted molecular beam epitaxy, we have been able to fabricate high quality epitaxial F/AF bilayers of lanthanum manganites by modulating the level of calcium substitution. We have obtained the dependence of the exchange bias on the AF layer thickness and determined the critical thickness . The vanishing of the effect below a critical AF layer thickness and its saturation at large AF layer thicknesses is described relatively accurately within the framework of the generalized model of Meiklejohn and Bean. Using the model, we estimate the low temperature interfacial energy of exchange interaction to be erg/cm2 and the AF anisotropy to be erg/cm3. To the best of our knowledge, the value of the anisotropy energy of antiferromagnetic La1/3Ca2/3MnO3 has not been previously reported. In addition to the classical methods, such as torque magnetometry[39] or neutron diffraction,[40] a torque magnetometry technique utilizing anisotropic magnetoresistance was developed and successfully employed[41, 42, 43] more recently for studies of exchange anisotropy in epitaxial exchange-biased systems. Further experiments are in order to study the exchange anisotropy of the antiferromagnetic manganite La1/3Ca2/3MnO3 in greater detail.
ACKNOWLEDGMENTS
The authors would like to thank Konstantin Nikolaev, Dan Dahlberg, Alexander Dobin, Ilya Krivorotov, Chris Leighton, and Jyotirmoy Saha for useful conversations. They would also like to thank Masaya Nishioka for technical assistance. The authors are grateful to J. T. Luck for helping with STEM specimen preparation, to M. Oxley for performing dynamical simulations of electron scattering, and to M. Watanabe for providing a plug-in to carry out PCA in Digital Micrograph. This work was supported by the National Science Foundation through the University of Minnesota Materials Research Science and Engineering Center under Grant NSF/DMR-0212032. Research at ORNL was sponsored by the Division of Materials Sciences and Engineering of the US Department of Energy.
References
- [1] W. H. Meklejohn and C. P. Bean, Phys. Rev. 102, 1413 (1956).
- [2] J. Nogués and I. K. Schuller, J. Magn. Magn. Mater. 192, 203 (1999).
- [3] A. E. Berkowitz and K. Takano, J. Magn. Magn. Mater. 200, 552 (1999).
- [4] R. L. Stamps, J. Phys. D: Appl. Phys. 33, R247 (2000).
- [5] M. Kiwi, J. Magn. Magn. Mater. 234, 584 (2001).
- [6] Jyotirmoy Saha and R. H. Victora, Phys. Rev. B 73, 104433 (2006).
- [7] I. Panagiotopoulos, C. Christides, N. Moutis, M. Pissas, and D. Niarchos, J. Appl. Phys. 85, 4913 (1999).
- [8] I. Panagiotopoulos, C. Christides, M. Pissas, and D. Niarchos, Phys. Rev. B 60, 485 (1999).
- [9] I. Panagiotopoulos, C. Christides, D. Niarchos, and M. Pissas, J. Appl. Phys. 87, 3926 (2000).
- [10] O. Morán, M. E. Gomez, and J. G. Ramirez, T. Schwarz, D. Fuchs, R. Hott, and R. Schneider, J. Appl. Phys. 97, 10K116 (2005).
- [11] J. N. Eckstein, I. Bozovic, J. O’Donnell, M. Onellion, and M. S. Rzchowski, Appl. Phys. Lett. 69, 1312 (1996).
- [12] J. O’Donnell, M. Onellion, M. S. Rzchowski, J. N. Eckstein, and I. Bozovic Phys. Rev. B 55, 5873 (1997).
- [13] K. R. Nikolaev, A. Yu. Dobin, I. N. Krivorotov, W. K. Cooley, A. Bhattacharya, A. L. Kobrinskii, L. I. Glazman, R. M. Wentzovitch, E. Dan Dahlberg, and A. M. Goldman, Phys. Rev. Lett. 85, 3728 (2000).
- [14] I. N. Krivorotov, K. R. Nikolaev, A. Yu. Dobin, A. L. Kobrinskii, R. Wentzcovitch, A. M. Goldman, and E. D. Dahlberg, J. Appl. Phys. 89, 6964 (2001).
- [15] J.-P. Locquet, A. Catana, E. Machler, C. Gerber, and J. G. Bednorz, Appl. Phys. Lett. 64, 372 (1994).
- [16] B. R. Johnson, K. M. Beauchamp, T. Wang, J-X. Liu, K. A. McGreer, J-C. Wan, M. Tuominen, Y-J. Zhang, M. L. Mecartney, and A. M. Goldman, Appl. Phys. Lett. 56, 1911 (1990).
- [17] I. Bozovic, J. N. Eckstein, and G. F. Virshup, J. Vac. Sci. Technol. B 12, 1170 (1994).
- [18] V. A. Vas’ko, C. A. Nordman, P. A. Kraus, V. S. Achutharaman, A. R. Ruosi, and A. M. Goldman, Appl. Phys. Lett. 68, 2571 (1996).
- [19] A. Yu. Dobin, K. R. Nikolaev, I. N. Krivorotov, R. M. Wentzcovitch, E. Dan Dahlberg, and A. M. Goldman, Phys. Rev. B 68, 113408 (2003).
- [20] Films of La0.8Ca0.2MnO3 as thin as 82 Å, deposited directly on SrTiO3 substrates, were found to undergo a transition to a metallic state.[21] This confirms the capability of our deposition system to produce very high quality films of doped colossal magnetoresistance manganites.
- [21] M. Eblen-Zayas, A. Bhattacharya, N. E. Staley, A. L. Kobrinskii, and A. M. Goldman, Phys. Rev. Lett. 94, 037204 (2005).
- [22] A. Bhattacharya, M. Eblen-Zayas, N. E. Staley, A. L. Kobrinskii, and A. M. Goldman, Phys. Rev. B 72, 132406 (2005).
- [23] The pseudocubic lattice constants are 3.86 Å and 3.78 Å for bulk[28] La2/3Ca1/3MnO3 and La1/3Ca2/3MnO3, respectively, which results in a maximum mismatch of 2% with SrTiO3 substrates.
- [24] V. S. Achutharaman, K. M. Beauchamp, N. Chandrasekhar, G. C. Spalding, B. R. Johnson and A. M. Goldman, Thin Solid Films 216, 14 (1992).
- [25] See EPAPS Document No. for additional STEM-EELS data, analysis, and discussion. For more information on EPAPS, see http://www.aip.org/pubservs/epaps.html.
- [26] M. Bosman, M. Watanabe, D. T. L. Alexander, and V. J. Keast, Ultramicroscopy 106, 1024 (2006).
- [27] M. Varela, W. Luo, J. Tao, M. P. Oxley, M. Watanabe, A. R. Lupini, S. T. Pantelies, and S. J. Pennycook, Phys. Rev. B, submitted (2008).
- [28] E. O. Wollan and W. C. Koehler, Phys. Rev. 100, 545 (1955).
- [29] A. Hoffmann, Phys. Rev. Lett. 94, 037204 (2005).
- [30] M. T. Fernándes-Díaz, J. L. Martínez, J. M. Alonso, and E. Herrero, Phys. Rev. B 59, 1277 (1999).
- [31] M. B. Salamon and M. Jaime, Rev. Mod. Phys. 73, 583, 2001.
- [32] See, for instance, the work by A. Hoffmann [29] and references therein.
- [33] The hysteresis loop shift measured in exchange-biased systems is known (see work by Nogués et al.[44] and references therein) to depend on whether the AF material has a single crystal or a polycrystalline structure. However, it is difficult to verify this in manganite-based systems because their properties are highly sensitive to other factors such as oxygen content and doping level and the overall amount of available data is limited as compared, for instance, to the systems based on metals or metal alloys.
- [34] W. H. Meklejohn and C. P. Bean, Phys. Rev. 105, 904 (1957).
- [35] W. H. Meklejohn, J. App. Phys. 33, 1328 (1962).
- [36] Daniele Mauri, Eric Kay, David Scholl, and J. Kent Howard, J. App. Phys. 62, 2929 (1987).
- [37] Ch. Binek, A. Hochstrat, and W. Kleemann, J. Magn. Magn. Mater. 234, 353 (2001).
- [38] M. S. Lund, W. A. A. Macedo, Kai Liu, J. Nogués, Ivan K. Schuller, and C. Leighton, Phys. Rev. B 66, 054422 (2002).
- [39] Enji Uchida, Nobuo Fukuoka, Hisamoto Kondoh, Tadao Takeda, Yoshihide Nakazumi, and Takeo Nagamiya, J. Phys. Soc. Japan 23, 1197 (1967).
- [40] M. T. Hutchings and E. J. Samuelsen, Phys. Rev. B 6, 3447 (1972).
- [41] E. D. Dahlberg, K. T. Riggs, and G. A. Prinz, J. Appl. Phys. 63, 4270 (1988).
- [42] B. H. Miller and E. D. Dahlberg, Appl. Phys. Lett. 69, 3932 (1996).
- [43] I. N. Krivorotov, C. Leighton, J. Nogués, Ivan K. Schuller, and E. Dan Dahlberg, Phys. Rev. B 65, 100402 (2002).
- [44] J. Nogués, J. Sort, V. Langlais, V. Skumryev, S. Suriñach, J. S. Muñoz, and M. D. Baró, Phys. Rep. 422, 65 (2005).