The Dynamics of Silica Melts under High Pressure: Mode-Coupling Theory Results
Abstract
The high-pressure dynamics of a computer-modeled silica melt is studied in the framework of the mode-coupling theory of the glass transition (MCT) using static-structure input from molecular-dynamics (MD) computer simulation. The theory reproduces the experimentally known viscosity minimum (diffusivity maximum) as a function of density or pressure and explains it in terms of a corresponding minimum in its critical temperature. This minimum arises from a gradual change in the equilibrium static structure which shifts from being dominated by tetrahedral ordering to showing the cageing known from high-density liquids. The theory is in qualitative agreement with computer simulation results.
pacs
64.70.Pf, 62.50.+p, 66.10.-x1 Introduction
The physical mechanisms behind vitrification are still widely debated. Studies taking into account the high-pressure behaviour of glass-forming liquids in addition to their response to temperature variation, are now emerging as a valuable means to provide insight into the glass transition phenomenon. Based on a comparison of colloidal and molecular glass-transition data over large pressure ranges, it has been proposed that pressures well above are needed to significantly change the properties of many well-studied fragile glass formers [1]; only in this extreme pressure regime one would have hope to resolve the long-standing debate whether energetic or entropic interactions are the main cause for the dynamical slowing down in the vicinity of the glass transition.
It has been pointed out [2] that most organic glass formers will cease to exist as such under these conditions, the molecules being irreversibly transformed to polymerized modifications. Even some of the existing measurements on organic glass formers, touching on the regime [3], might have to be reconsidered in light of this finding.11 1 Brazhkin V V, private communication This leaves two material classes as possible candidates for furthering the understanding of pressure-induced vitrification and, by this route, the physics of the glass transition itself: metallic glasses on the one hand, and amorphous silica and relatives on the other.
Silica and silicate melts are special in that they are both ubiquitous in application and known to display ‘anomalous’ changes in thermodynamic and kinetic properties as pressure is increased. This arises essentially because they exist as open tetrahedral-network-forming structures under atmospheric conditions and can be classified as ‘strong’ liquids in Angell’s sense. A prominent feature in silica and a number of alkali silicates is that the diffusivity of the Si and O atoms first increases with increasing pressure [4, 5, 6, 7], contrary to what one expects from the excluded-volume picture of the glass transition, where increased pressure, insofar as it leads to increasing density, drives dynamic arrest. Only at pressures higher than about –, depending on the melt composition, do the diffusion coefficients decrease for silica melts, leading to a maximum in the diffusivity-versus-pressure plot, as predicted from computer simulation [8, 9, 10]. Similarly, the viscosity first decreases with increasing pressure, eventually showing a minimum.
The mode-coupling theory of the glass transition, MCT [11], is commonly accepted to be a theory applicable to relatively high temperatures in ‘fragile’ liquids where it has been tested with great success [12], although MCT signatures such as two-step slow relaxation have also been seen in ‘strong’ liquids displaying nearly-Arrhenius behaviour at low temperatures [13]. Earlier simulation and combined simulation-and-theory studies [14, 15] point out by demonstrating qualitative agreement with microscopic MCT calculations for silica and sodium silicate mixtures, that the theory can in fact yield more detailed predictions also for strong glass-forming liquids. The existence of a MCT- also for silica implies a number of asymptotic predictions, for example that the long-time ‘structural relaxation’ in the system is in fact independent on the details of microscopic motion; this strong MCT prediction has recently been confirmed in a simulation study comparing molecular-dynamics with stochastic Monte-Carlo dynamics for a simulation model of silica [16]. Still, it remains a crucial question towards understanding the theory’s benefits and limitations, how MCT deals with the differences between ‘strong’ and ‘fragile’ liquids. Silica has been argued to undergo a transition from one to the other upon pressurization [9], and so is an ideal candidate for these studies.
In this contribution, we present first MCT results for pressurized silica melts. We demonstrate that the diffusivity maximum is reproduced by the theory, using computer-simulated static structure factors as input. The maximum of diffusivity corresponds to a minimum of the MCT critical temperature as a function of density or pressure , which in turn arises from the interplay of decreasing tetrahedral-network effects and increasing contributions from nearest-neighbour cageing.
2 Model Calculations
Since MCT predicts drastic changes in the dynamics arising from relatively minor changes in the average equilibrium structure, one needs to ensure good-quality input for the latter. For complex liquids such as silica, this can be delivered by computer simulation in conjunction with a reliable model potential. Carré et al [17] have recently developed a pair potential (called CHIK potential) based on Car-Parrinello calculations that reproduces the experimental equation of state reliably and hence improves significantly over the Beest-Kramer-van Santen (BKS) potential [18] widely used so far. The CHIK potential was used in extensive molecular-dynamics (MD) computer simulations described in detail elsewhere in this issue [19]. From these, the matrix of equilibrium partial static structure factors was obtained, where are the Fourier-transformed (wave vector ) number-density fluctuations of species , and the sum runs over all particles belonging to that type with positions . For use in the MCT equations, has been simulated for the isotherms , , , , , and at various densities from to ; at other temperatures, was obtained by linear interpolation between the above values unless otherwise noted.
MCT equations of motion for the resulting binary mixture are solved numerically as outlined in Ref. [20]. They yield the matrix of dynamic partial number-density correlation functions depending on wave number ,
| (1) |
where sets the thermal velocities for the short-time dynamics and . is the memory function matrix of generalized fluctuating forces, which in the MCT approximation is written as
| (2) |
with . Here, is the number density, and are the number concentrations, and in our case. The vertices contain only equilibrium static correlations, viz. the matrix of direct correlation functions defined by through the Ornstein-Zernike relation [21]. denotes the corresponding static triplet correlation function [22], which we set to zero in the following since no simulation data for it are available so far. This neglect of triplet correlations has been studied in detail for silica melts modeled through the BKS potential [14], where was found to give noticeable contributions different than in, for example, dense Lennard-Jones mixtures. Without triplet contributions, the silica results under atmospheric pressure were still qualitatively correct regarding the wave-vector dependence of the correlation functions. We expect the same situation for our model potential, with the quality of this additional approximation to become better on increasing density.
From the resulting , an equation similar to Eq. (1) allows to calculate the -species tagged-particle density correlations , where marks a single tracer particle. The corresponding MCT memory kernel reads . In the limit , the quantity approaches a finite limit which plays the role of the memory kernel for the corresponding mean-squared displacement . The self-diffusion coefficients can thus be determined as . For the numerical solution of Eq. (1) and the corresponding equations determining and , we use a wave-vector grid with a cutoff of and grid spacing .
MCT describes the slowing down of diffusivity, , connected to an increase in relaxation times for the , as the coupling described by the increases smoothly through a variation of control parameters . The divergence of relaxation times defines the MCT critical point . No such divergence is observed in experiment or simulation, but the scaling laws connected to describing the asymptotic shape of the correlation functions and a power-law variation in relaxation times are [12]. Hence, the MCT critical point provides a useful, well-defined concept to discuss the slow dynamics of glass-forming systems.
3 Results
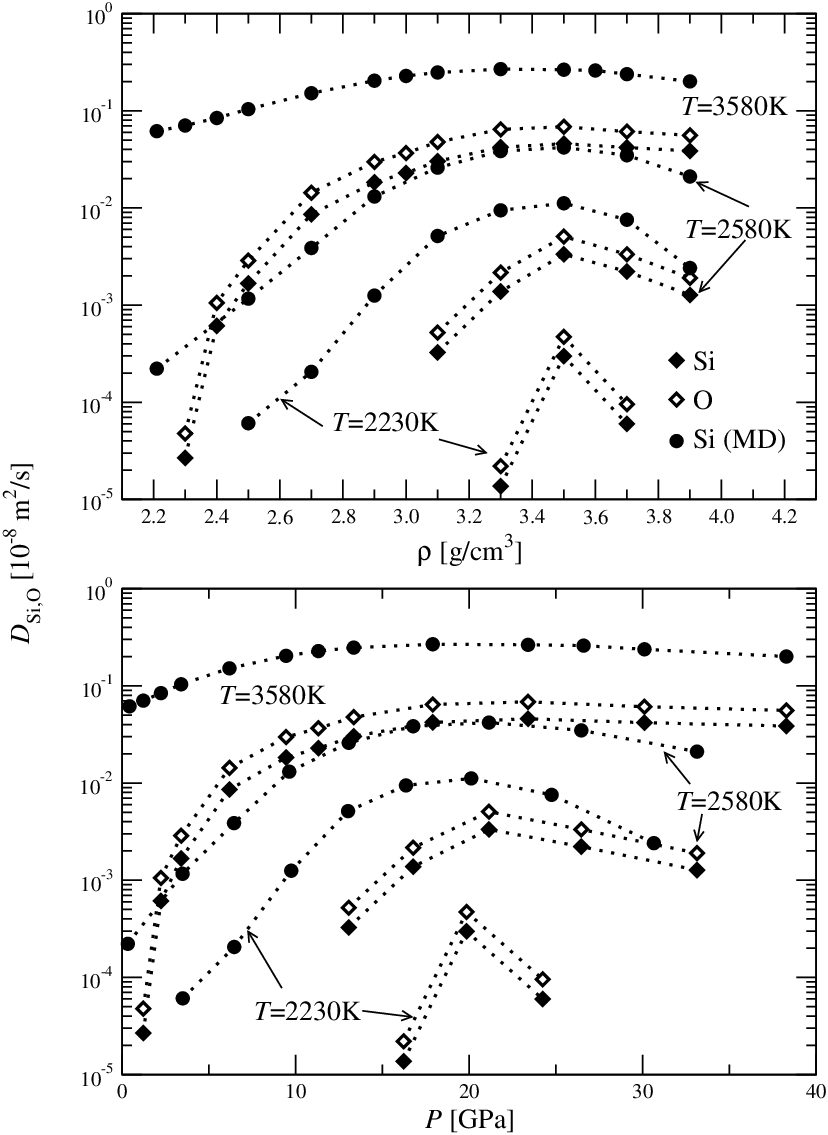
Figure 1 shows the self-diffusion coefficients () calculated from MCT along isotherms as diamond symbols. A maximum is found for all isotherms considered, at a density of about roughly independent of temperature. This corresponds to a diffusivity maximum at a pressure of about , as the lower panel of Fig. 1 shows. There, density values have been translated to pressure by means of the computer-simulated equation of state [17, 19]. In both representations, the maximum is more pronounced at lower temperatures, indicating that it is a feature of slow glassy dynamics. At high temperatures, only the pronounced initial increase of with pressure remains clearly visible, while the region around the maximum becomes rather broad. Note that all the temperatures discussed here are still high compared to the conventional glass transition . The maximum in diffusivity also corresponds to a minimum in viscosity, or more generally a minimum in structural relaxation times. For O diffusion, we find the same behaviour as for Si diffusion, while is slightly larger than ; the ratio for drops from roughly at to about at ; other isotherms give similar behaviour. These ratios are slightly larger than what has been measured in a silicate melts with several alkali-oxyde additions [7] at diffusivities of . Note however that at lower diffusivities, the transport of Si and O will be governed by hopping processes with different activation energies, leading to a much larger .
The diffusion coefficients from MCT are in qualitative agreement with results from MD simulation using the CHIK potential. This is demonstrated for , where Fig. 1 reproduces some simulation data from Ref. [19] as circle symbols. In particular, the density and pressure of maximum diffusivity found in MCT correspond well to the computer-simulation results. Already earlier simulation studies based on the BKS potential for silica have reported a diffusivity maximum at a density of [9, 10] indicating that this feature is robust against slight changes in the potential. The absolute values of disagree between MD and MCT. In particular at low temperatures and low densities, additional relaxation processes not captured in the theory render the divergence of the diffusion coefficient much weaker than predicted by the theory, hence the disagreement is most pronounced in this regime. Here, computer simulations show a temperature dependence of the that is well described by Arrhenius laws, which are not reproduced in MCT.

The strong variation of – it increases by orders of magnitude upon increasing pressure up to – suggests an explanation in terms of a corresponding variation of the critical temperature of mode-coupling theory. The values calculated from a bifurcation analysis of the long-time limit of Eq. (1) are shown in Fig. 2. Indeed, shows a pronounced minimum around . For most densities, it was possible in the simulation to obtain equilibrated configurations also below this , so that the calculation could be based on linear interpolation of a set of state points for which was simulated, and between which the structure factor changes were small. Only around , the critical temperature is too low to equilibrate the system within reasonable time scales in MD. Additionally, at and temperatures around and below , the simulations showed crystallization, preventing access to the liquid regime. Therefore, the values shown for , , and are based on extrapolation of from higher and have higher uncertainty than the rest of the data; the state points at which ‘exact’ MD input for was used are marked in Fig. 2 by diamond symbols. Translating the pairs to by the simulated equation of state, the minimum corresponds to a similar minimum around (lower panel of Fig. 2). In particular, the qualitative behaviour of and is identical, indicating that thermodynamic features governed by the equation of state are not central to understanding the observed dynamics.
Since transport processes slow down dramatically upon approaching , relaxation in the silica melt along an isotherm first becomes faster with increasing pressure as the distance increases. Only once the pressure exceeds , this distance decreases and hence relaxation becomes slower again. For comparison, in the Lennard-Jones system, increases monotonically with increasing density [23] which leads to the expected monotonous decrease of diffusivity with increasing pressure.

To demonstrate the level of agreement between MCT and simulation data, we have also estimated from the MD dynamics by fitting asymptotic power laws of MCT to the temperature dependence of the diffusion coefficients. The theory predicts , and while in principle will depend on density (see below), we anticipate that this change will be relatively small and use for all data sets. Figure 3 shows exemplary rectification plots from which is determined by linear fits to (symbols) in a restricted temperature range not too close and not too far above , shown as solid lines. Deviations from a linear slope at higher temperatures result from preasymptotic corrections, while those at lower temperatures signify non-MCT relaxation process (‘hopping’). In agreement with the observation made in Fig. 1, the latter deviations appear more dominant at lower densities, indicating that the MCT description will be better for pressurized silica than under atmospheric conditions.
Although the determined from simulation, shown as circle symbols in the upper panel of Fig. 2, are systematically lower than the calculated within the theory, the position of the minimum at is in good agreement. There is a slight tendency for the MCT result to better agree with the MD-determined at higher densities, in line with the expectation that MCT deals quantitatively better with dense liquids. at ambient pressure has previously been determined using the BKS potential of silica. MD simulations yielded , while MCT calculations without triplet correlation contributions gave [14]. These values are significantly higher than our results, although the static structure obtained from the BKS respectively the CHIK potential shows relatively small differences [19]. This underlines the importance of obtaining static-structure factor input for MCT as accurately as possible. The inclusion of the static triplet correlation function for the BKS potential led to a better agreement in the length-scale dependence of the glass form factors [14], but worsened the agreement for . Whether the same will also hold for the CHIK potential, is unclear, but a noticable shift of the values presented in Fig. 2 has to be anticipated.

The variation in shown in Fig. 2 can be understood within MCT by looking at specific features of the static structure factors. While at the lower densities, all show a pronounced scattering peak at reflecting tetrahedra as the structural units of the system, this peak vanishes at the expense of the main diffraction peak in , located at at and corresponding to typical interatomic, rather than inter-tetrahedral distances [19]. This trend can be identified also in the total density-density correlations, . Similarly, it is reflected in the glass form factors , i.e., that part of density fluctuations which is frozen in upon crossing the MCT glass transition. Figure 4 shows the critical form factors as a function of wave number, evaluated at several densities along the MCT transition line . While for (filled circles, corresponding to ), two peaks of almost identical height appear at the two -values and , the first peak has almost disappeared at (diamond symbols, corresponding to ). At the same time, the peak at has grown. This evolution reflects a gradual loss of tetrahedral ordering, and a smooth crossover to a system showing signatures of a dense liquid. Around the minimum in , both contributions prevail, as the for (corresponding to ) shown in Fig. 4 demonstrates. Hence we attribute the initial decrease of to a loss of chemical short-range order (the tetrahedral structure), and the subsequent increase to an increase in nearest-neighbour cageing. This crossover visible in corresponds to a change in mean coordination numbers for the Si atoms in with increasing pressure. MD simulations for example show a gradual crossover from predominantly four-fold coordinated Si atoms at to a significant number of five- and six-fold coordinated ones [19].
To demonstrate the approach to a frozen structure that resembles one governed by packing effects, we show in addition in Fig. 4 the obtained from a binary hard-sphere mixture (using the Percus-Yevick approximation for ) with diameters chosen as and and concentration . Considering that the covalent radius of Si yields roughly , the value of appears reasonable if one takes into account the complicated interatomic potentials in the melt. In particular, the comparison with the hard-sphere shows that besides the growing main peak, the emerging shoulder at can be attributed to excluded-volume effects. It can be anticipated that the for the silica melt and the hard-sphere mixture further approach each other, as the silica density is further increased. Only in the limit the two quantities show no convergence, related to the fact that the two systems have rather different isothermal compressibilities.
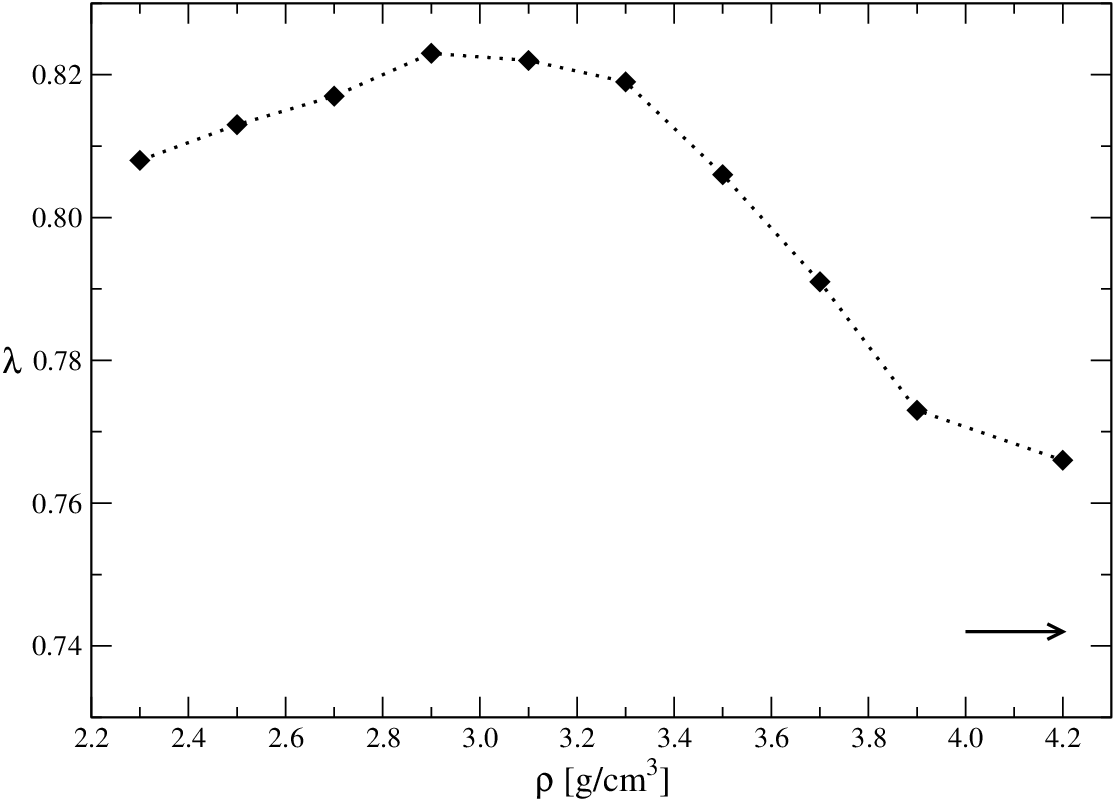
A further corroboration for the crossover from a tetrahedral network former to an excluded-volume influenced glass comes from the analysis of the MCT exponent parameter . This quantity controls the exponents of the asymptotic expansions near the singulary . It is bounded by , but for common ‘fragile’ glass formers, one usually finds as, e.g., for the Lennard-Jones model [12], and values for systems where attractive interactions play comparable role to excluded volume as, e.g., in the square-well system [24]. The evolution of with increasing density in the present silica model is shown in Fig. 5. Interestingly, it shows values larger than for the lower densities corresponding to moderate pressures. At high densities it systematically decreases towards a value of at . For comparison, the value obtained for the binary hard-sphere mixture discussed above, , is indicated in Fig. 5 as a horizontal arrow. This suggests that indeed the asymptotic dynamic behaviour of the high-density silica melt slowly approaches that of a densely packed mixture. Note also that maxima in , similar to the one shown in the Fig. 5, have been argued to arise from an interplay of two different arrest mechanisms [24], consistent with our picture of a gradual crossover with increasing pressure. The parameter in particular determines the exponent for the asymptotic divergence of relaxation times or viscosities at ; smaller values of signify larger and vice versa.

The non-monotonous variation of shown in Fig. 1 leads to a corresponding non-monotonous variation in the mean-squared displacement (MSD) upon varying density or pressure along an isotherm. We show exemplary results for at and various densities in Fig. 6. The variation at long times, i.e., for large displacements reflects the change in . But also at earlier times, in the ps regime, a strong non-monotonous variation in remains. Since asymptotically close to , the plateau visible in the MSD is a measure of the localization length of the individual particle, it is tempting to read off from the intermediate-time window in Fig. 6 a Si-localization length that shows an apparent change of almost a factor as a function of density. This is what is also observed in the MD simulation [19]. In fact, the value of, say, first increases with increasing density or pressure: Si particles are on that time scale less localized for higher pressure, reflecting a change in the microscopic dynamics that becomes less dominated by the strong localization within the tetrahedral network. However, this is not the localization that is responsible for the MCT glass transition, and which can only be read off from the MSD sufficiently close to . To this end, we show as dotted lines in Fig. 6 the at and observe that they agree closely over the entire density range presented, indicating that the cage localization length changes only weakly as a function of pressure in this system. If observed far from , large preasymptotic corrections that are particularly dominant for the MSD [25] give rise to the apparent shift in .
For the O atoms, the same qualitative trend as discussed in connection with Si holds, although the variation of is slightly larger. The ratio of localization lengths monotonically decreases from at to about at , indicating that the role played by the Si and the O atoms in the dynamics assimilates at large pressure. Overall, both localization lengths agree with Lindemann’s criterion for melting, stating that .
4 Conclusions
We have demonstrated that MCT, together with computer-simulation input for the equilibrium liquid structure, reproduces a peculiar change in the dynamics of a pressurized silica melt: upon increasing pressure, atomic-scale transport as monitored through, e.g, self-diffusion coefficients, first becomes faster. At a pressure around , a maximum in diffusivity occurs, and at still higher pressures, transport starts to slow down with increasing pressure. This is in broad agreement with previous simulation data on model silica melts and with experiments on various silicate mixtures.
MCT explains the diffusivity maximum in silica melts as arising from a gradual change in the static structure on mesoscopic length scales, where contributions connected to tetrahedral ordering at wave number become continuously less pronounced at the expense of contributions on the length scale of the Si–Si atom nearest-neighbour distance, . This is a feature found only in silica and similar network-forming melts, whereas in simpler dense liquids such as the Lennard-Jones liquid, the nearest-neighbour contribution in remains dominant at all densities or pressures. Hence, the latter ‘fragile’ liquids do not show diffusivity maxima. As an additional difference, the variation of with pressure in Lennard-Jones liquids is dominated by thermodynamic contributions (viz., a strong variation in the equation of state) arising from the presence of a gas–liquid spinodal [23], while in silica melts it is inherent to the slow glassy dynamics and not governed by the equation of state.
The qualitative correctness of MCT predictions for pressurized silica melts is remarkable, since most experimental observations concern temperatures well below the MCT , where the theory in its present form is not applicable. Nevertheless, the qualitative physical mechanisms responsible for the anomalous pressure dependence of transport coefficients in this strong glass former seem to be there already at far higher temperatures, and captured in the MCT approximation. A similar conclusion might apply to the distinction between ‘strong’ and ‘fragile’ behaviour of the viscosity around . While MCT cannot be applied there, it does yield for silica a gradual crossover of the exponent governing the initial increase in viscosity above , changing from a slower increase at ambient pressure to a stronger one (more akin to a ‘fragile’ liquid) at high pressures.
Based on this observation, we suggest that MCT can be used to investigate in more detail the connection between ‘strong’ glass formers with network-like structures at low pressures and ‘fragile’ ones which are characterized by a dense arrangement of constituent atoms.
References
- [1] Voigtmann Th and Poon W C K 2006 J. Phys.: Condens. Matter 18 L465–L469
- [2] Brazhkin V V 2006 J. Phys.: Condens. Matter 18 9643–9650
- [3] Cook R L, H E King J, Herbst C A and Herschbach D R 1994 J. Chem. Phys. 100 5178–5189
- [4] Kushiro I 1978 Earth Planet. Sci. Lett. 41 87–90
- [5] Rubie D C, Ross II C R, Carroll M R and Elphick S C 1993 Am. Mineral. 78 574–582
- [6] Poe B T, McMillan P F, Rubie D C, Chakraborty S, Yarger J and Diefenbacher J 1997 Science 276 1245–1248
- [7] Tinker D, Lesher C E and Hutcheon I D 2003 Geochim. Cosmochim. Acta 67 133–142
- [8] Angell C A, Cheeseman P A and Tamaddon S 1982 Science 218 885–887
- [9] Barrat J L, Badro J and Gillet P 1997 Mol. Sim. 20 17–20
- [10] Shell M S, Debenedetti P G and Panagiotopoulos A Z 2002 Phys. Rev. E 66 011202
- [11] Götze W 1991 Liquids, Freezing and Glass Transition ed Hansen J P, Levesque D and Zinn-Justin J (North-Holland) pp 287–503
- [12] Götze W 1999 J. Phys.: Condens. Matter 11 A1–A45
- [13] Sidebottom D, Bergman R, Börjesson L and Torell L M 1993 Phys. Rev. Lett. 71 2260–2263
- [14] Sciortino F and Kob W 2001 Phys. Rev. Lett. 86 648–651
- [15] Voigtmann Th and Horbach J 2006 Europhys. Lett. 74 459–465
- [16] Berthier L 2007 Phys. Rev. E 76 011507
- [17] Carré A, Horbach J, Ispas S and Kob W 2007 New fitting scheme to obtain effective potential from car-parrinello molecular dynamics simulations: Application to silica (submitted)
- [18] van Beest B W H, Kramer G J and van Santen R A 1990 Phys. Rev. Lett. 64 1955–1958
- [19] Horbach J et al. 2008 J. Phys.: Condens. Matter this issue
- [20] Götze W and Voigtmann Th 2003 Phys. Rev. E 67 021502
- [21] Hansen J P and McDonald I R 2006 Theory of Simple Liquids 3rd ed (Academic Press)
- [22] Lee L L 1974 J. Phys. Chem. 60 1197–1207
- [23] Voigtmann Th 2007 Idealized glass transitions under pressure: dynamics versus thermodynamics (submitted)
- [24] Dawson K, Foffi G, Fuchs M, Götze W, Sciortino F, Sperl M, Tartaglia P, Voigtmann Th and Zaccarelli E 2001 Phys. Rev. E 63 011401
- [25] Sperl M 2003 Phys. Rev. E 68 031405