The Hard X-ray Spectrum as a Probe for Black-Hole Growth in
Radio-Quiet
Active Galactic NucleiNote: Received 2007 September 24; accepted 2008 April 03
Abstract
We study the hard-X-ray spectral properties of ten highly luminous radio-quiet (RQ) active galactic nuclei (AGNs) at , including new XMM-Newton observations of four of these sources. We find a significant correlation between the normalized accretion rate () and the hard-X-ray photon index () for 35 moderate–high luminosity RQ AGNs including our ten highly luminous sources. Within the limits of our sample, we show that a measurement of and can provide an estimate of and black-hole (BH) mass () with a mean uncertainty of a factor of 3 on the predicted values of these properties. This may provide a useful probe for tracing the history of BH growth in the Universe, utilizing samples of X-ray-selected AGNs for which and have not yet been determined systematically. It may prove to be a useful way to probe BH growth in distant Compton-thin type 2 AGNs. We also find that the optical–X-ray spectral slope () depends primarily on optical–UV luminosity rather than on in a sample of RQ AGNs spanning five orders of magnitude in luminosity and over two orders of magnitude in . We detect a significant Compton-reflection continuum in two of our highly luminous sources, and in the stacked X-ray spectrum of seven other sources with similar luminosities, we obtain a mean relative Compton reflection of and an upper limit on the rest-frame equivalent width of a neutral Fe K line of 105 eV. We do not detect a significant steepening of the X-ray power-law spectrum below rest-frame 2 keV in any of our highly luminous sources, suggesting that a soft-excess feature, commonly observed in local AGNs, either does not depend strongly on , or is not accessible at high redshifts using current X-ray detectors. None of our highly luminous sources displays X-ray flux variations on timescales of 1 hr, supporting the idea that the timescale of X-ray variability depends inversely on and does not depend on .
Subject headings
galaxies: active – galaxies: nuclei – X-rays: galaxies – quasars: emission linesI. Introduction
The X-ray spectrum of an unobscured, radio-quiet (RQ) AGN in the 2–100 keV energy band is best characterized by a single power-law continuum of the form , where , hereafter the photon index in the 2–100 keV energy band, typically lies in the range 1.5–2.5. A corona of hot electrons is assumed to produce the hard-X-ray emission via Compton upscattering of UV–soft-X-ray photons from the accretion disk, and is predicted to be only weakly sensitive to large changes in the electron temperature and the optical depth in the corona (e.g., Haardt & Maraschi 1991; Zdziarski et al. 2000; Kawaguchi et al. 2001). The relatively narrow range of values in RQ AGNs has been reported in numerous studies (e.g., Nandra & Pounds 1994, Reeves & Turner 2000; Page et al. 2005; Shemmer et al. 2005; Vignali et al. 2005; Just et al. 2007), and typically no strong dependence of on redshift or luminosity has been detected across the widest possible ranges of these parameters. On the other hand, a strong anticorrelation between and the full width at half-maximum intensity (FWHM) of the broad emission-line region (BELR) component of H has been found, first by Brandt et al. (1997).
The remarkable dependence between X-ray and optical spectroscopic properties has been suggested to arise from a more fundamental correlation between and the accretion rate (e.g., Brandt & Boller 1998; Laor 2000). A high accretion rate is expected to soften (steepen) the hard-X-ray spectrum by increasing the level of disk emission, resulting in the production of softer photons, which increase the Compton cooling of the corona. Using recent scaling relations for the BELR size, luminosity, and the width of the broad H emission line from reverberation-mapping studies, it is clear that the normalized accretion rate (i.e., /, hereafter , where is the bolometric luminosity) is proportional to FWHM(H)-2, at least for low–moderate luminosity AGNs in the local universe (e.g., Kaspi et al. 2000).
Subsequent X-ray studies of nearby (0.5) unobscured RQ AGNs have confirmed the Brandt et al. (1997) -FWHM(H) anticorrelation (e.g., Leighly 1999; Reeves & Turner 2000; Porquet et al. 2004; Piconcelli et al. 2005; Brocksopp et al. 2006), and others have found significant correlations between and (e.g., Lu & Yu 1999; Porquet et al. 2004; Wang et al. 2004; Bian 2005). However, all these studies were not able to disentangle the strong FWHM(H)- dependence. Recently, Shemmer et al. (2006; hereafter S06) have suggested that this degeneracy can be removed if highly luminous sources are included in the analysis. This can be achieved by obtaining high-quality near-IR spectroscopy of the H spectral region, to obtain (e.g., Shemmer et al. 2004), as well as accurate measurements of using XMM-Newton and Chandra for highly luminous AGNs found at 13.
Within the limits of their sample of 30 sources, spanning three orders of magnitude in luminosity, S06 have shown that does not depend on luminosity or black-hole (BH) mass (). They have also shown that the values of the five highly luminous sources in their sample, while consistent with the values expected from their normalized accretion rates (), are significantly higher than expected from the widths of their broad H emission lines. This has enabled, for the first time, breaking of the FWHM(H)- degeneracy and has provided evidence that depends primarily on the accretion rate. However, the number of highly luminous sources was small, and as explained below, some uncertainties remained.
In this work, we double the number of highly luminous sources at high redshift and reinforce the S06 results. We show that can be considered a reliable accretion-rate indicator for moderate–high luminosity RQ AGNs, and that the combination of and X-ray luminosity may provide a useful probe for tracing the history of BH growth in the Universe. We also discuss the X-ray spectral and temporal properties of luminous, high-accretion rate AGNs at high redshift as well as the dependence of the optical–X-ray spectral energy distribution (SED) on luminosity and . In § II we describe our sample selection, and present the new observations and their analysis. Our results are presented and discussed in § III, where we focus on the correlation between the hard-X-ray photon index and the normalized accretion rate in RQ AGNs and its implications for probing BH growth in the Universe. A summary of our main findings is given in § IV. Throughout this work we consider only RQ AGNs to avoid any contribution from jet-related emission to the X-ray spectra. Luminosity distances are computed using the standard cosmological model with , , and km s-1 Mpc-1.
II. Sample Selection, Observations, and Data Analysis
II.1. Sample Selection
Our sample is composed of the 30 sources studied in S06 as well as five highly luminous sources () whose hard-X-ray spectra are analyzed in this work for the first time. Motivated by the S06 hypothesis that only highly luminous AGNs may break the FWHM(H)- degeneracy, we have primarily searched for highly luminous AGNs that have high-quality H and hard-X-ray spectroscopy. Our search of the literature and archive yielded ten such sources, five which were studied in S06 and five that are analyzed below. Our new core sample of 35 sources includes unabsorbed, type 1 RQ AGNs with (i.e., a moderate–high luminosity range; see Fig. 1). Rest-frame optical data for this sample was obtained from Neugebauer et al. (1987), Boroson & Green (1992), Nishihara et al. (1997), McIntosh et al. (1999), Shemmer et al. (2004), and Sulentic et al. (2006). Hard-X-ray data were obtained from Page et al. (2004b), Piconcelli et al. (2005), S06, and from this work (see below). All of our sources were selected to have high-quality XMM-Newton hard-X-ray spectra (except for HE 09260201 that was serendipitously observed with Chandra). We have intentionally limited our sample to the moderate–high luminosity range in order to minimize potential effects of optical and X-ray variability (since the optical and X-ray data are not contemporaneous) as well as potential spectral complexities due to Compton reflection, as discussed further below (see also S06 for more details). In light of our selection criteria, we caution that our sample is neither complete nor fully representative of the AGN population as a whole; our main results may therefore be subject to selection biases over the wide range of AGN properties, which were not fully explored in this work.

| Observation | Net Exposure Time (ks) / Source Counts | |||||||
|---|---|---|---|---|---|---|---|---|
| AGN | RA (J2000.0) | DEC (J2000.0) | aaSystemic redshift measured from the optical emission lines and obtained from Shemmer et al. (2004). | bbNeutral Galactic absorption column density in units of cm-2 obtained from Dickey & Lockman (1990). | Start Date | MOS1 | MOS2 | pn |
| LBQS 01090213 | 01 12 16.91 | 02 29 47.6 | 2.349 | 3.25 | 2007 Jan 8 | 33.7 / 211 | 33.8 / 218 | 26.3 / 554 |
| 2QZ J023805.8274337 | 02 38 05.80 | 27 43 37.0 | 2.471 | 1.73 | 2006 Dec 22 | 34.6 / 206 | 34.0 / 183 | 23.9 / 586 |
| Q 1318113 | 13 21 09.38 | 11 39 32.0 | 2.306 | 2.80 | 2006 Dec 28 | 47.7 / 853 | 46.9 / 876 | 33.2 / 2621 |
| SBS 1425606 | 14 26 56.18 | 60 25 50.9 | 3.202 | 1.58 | 2006 Nov 12 | 20.6 / 232 | 20.9 / 255 | 7.0 / 304 |
Note. — The net exposure time represents the livetime following the removal of flaring periods. The net source counts are in the 0.2–10.0 keV band.
II.2. New XMM-Newton Observations
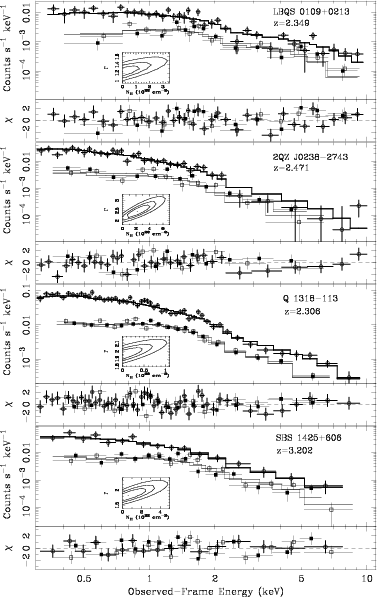
We have performed X-ray spectral imaging observations of four new sources from the Shemmer et al. (2004) sample with XMM-Newton (Jansen et al. 2001); a log of these observations is presented in Table 1. These sources were selected for XMM-Newton observations for being luminous, high-accretion rate sources, predicted to have high X-ray fluxes, and having relatively low Galactic column densities. The data were processed using standard XMM-Newton Science Analysis System11 1 http://xmm.esac.esa.int/sas v6.5.0 tasks. The event files of all the observations were filtered to remove periods of flaring activity in which the count rates of each MOS (pn) detector exceeded 0.35 (1.0) counts s-1 for events having keV. The time lost due to flaring in each observation varied between 1%–70% of the entire observing time; the net exposure times in Table 1 reflect the filtered data. The X-ray spectra of the quasars were extracted from the images of all three European Photon Imaging Camera (EPIC) detectors using apertures with radii of 30″. Local background regions were at least as large as the source regions. The spectra were grouped with a minimum of 20 counts per bin, except for the spectrum of Q 1318113 which was grouped with a minimum of 50 counts per bin. Joint spectral fitting of the data from all three EPIC detectors for each source was performed with xspec v11.3.2 (Arnaud 1996). We employed Galactic-absorbed power-law models at rest-frame energies 2 keV, corresponding to 0.5–0.6 keV in the observed frame of the sources, where the underlying power-law hard-X-ray spectrum is less prone to contamination due to any potential soft excess emission or absorption. In each fit, the photon indices in the spectra of all three EPIC detectors were tied to a single value, while the normalizations were free to vary. The best-fit values, power-law normalizations, and values from these fits are given in columns (2), (3), and (4) of Table 2, respectively, and the data, their joint, best-fit spectra, and residuals appear in Fig. 2.
We also searched for intrinsic absorption in each source by jointly fitting the spectra with a Galactic-absorbed power law model including an intrinsic (redshifted) neutral-absorption component with solar abundances in the same energy range quoted above. No significant intrinsic absorption was detected in any of the sources; upper limits on intrinsic values appear in column (5) of Table 2. Each panel of Fig. 2 includes a - confidence-contour plot from this fitting for each source. By applying -tests between the models including intrinsic absorption and those that exclude it, we found that none of the spectra require an intrinsic absorption component. The remarkably flat hard-X-ray spectrum of LBQS 01090213 (with ; see Table 2) motivated an alternative modeling, searching for an indication of partial covering. We found that when the spectrum is fitted with a redshifted partial-covering fraction absorber (zpcfabs model in XSPEC) and a Galactic-absorbed power law, the covering fraction is consistent with zero and the fit is not improved with respect to a Galactic-absorbed power law model. Therefore, the unusually flat hard-X-ray spectrum of LBQS 01090213 cannot be explained as being due to partial covering.
II.3. The Chandra Spectrum of HE 09260201
HE 09260201 is a highly luminous RQ AGN at for which near-infrared spectroscopy of the H region is presented in Sulentic et al. (2006). This source is serendipitously detected in an 8.8 ks Chandra/ACIS-S observation from 2002 February 20 (ID 3139) with 126 source counts in the 0.5–8 keV observed-frame band. We analyzed the Chandra observation using standard ciao22 2 Chandra Interactive Analysis of Observations. See http://asc.harvard.edu/ciao/ v3.2 routines. The spectrum was extracted using psextract from a circular aperture with a radius of eight pixels, corresponding to 4′′, and the events were grouped to have a minimum of 10 counts per bin (the extremely low Chandra background was determined from a source-free annular region with inner and outer radii of 10′′ and 25′′, respectively, centered on the source). The spectrum was fitted over the keV rest-frame energy band using xspec with a model including a power law and a Galactic-absorption component with a column density of =3.17 cm-2. The data were also fitted with an additional intrinsic-absorption component, similar to the procedure described above for the XMM-Newton observations, and we found that the data do not warrant any additional absorption. The best-fit spectral parameters as well as the upper limit on the intrinsic absorption are included in Table 2, and the Chandra spectrum and best-fit model appear in Fig. 3.
III. Results and Discussion
III.1. Spectral and Temporal Properties
III.1.1 Optical Luminosities and FWHM(H)
Basic optical spectroscopic properties of the new high-redshift sample are given in Table 2. The monochromatic luminosity at a rest-frame wavelength of 5100 Å [] is given in column (6), and FWHM(H) is given in column (7); except for HE 09260201, for which the optical data were obtained from Sulentic et al. (2006), these data were obtained from Netzer et al. (2007), who recently presented new and improved spectroscopic measurements for all the Shemmer et al. (2004) sources. The and values in columns (8) and (9), respectively, were determined as in S06, using the and FWHM(H) values given in columns (6) and (7), respectively, and based on the recent reverberation-mapping results of Peterson et al. (2004) and the Kaspi et al. (2005; hereafter K05) BELR size-luminosity relation (see also Kaspi et al. 2000); the general expression we use for is of the form . We note that the K05 relation relies on a sample of AGNs having luminosities up to 1046 ergs s-1, and extrapolating it to higher luminosities, such as those of ten of the sources presented here, is somewhat uncertain; a reverberation-mapping effort is underway to test the validity of such extrapolations (see e.g., Kaspi et al. 2007). In addition, Bentz et al. (2006, 2007) have recently suggested that subtraction of host-galaxy starlight from the AGN optical continuum may result in a somewhat flatter slope (e.g., compared with in K05) for the BELR size-luminosity relation across the entire K05 luminosity range. We test the possibility of using a flatter slope below, but we note that the Bentz et al. measurements were performed for sources with 1044 ergs s-1, while all the sources studied here have 1044 ergs s-1 (with a median luminosity of 1045 ergs s-1; Fig. 1). We also expect a much smaller fractional amount of host contamination in the most luminous sources in our sample. In light of all this, we have computed values using the K05 slope across our entire luminosity range. Moreover, since in this work we employ nonparametric statistical ranking tests, our main results are not significantly sensitive to the precise value of the slope of the BELR size-luminosity relation in the range . To derive the normalized accretion rates, we have employed the luminosity-dependent bolometric correction method of Marconi et al. (2004); the bolometric correction factor for the monochromatic luminosity at 5100 Å [i.e., /(5100 Å)] is () for the moderate-luminosity (high-luminosity ) sources in this work (see S06 for more details).
III.1.2 Optical–X-ray Spectral Slopes
The optical–X-ray spectral slopes () in column (10) of
Table 2 are defined as
, where and are the flux
densities at 2 keV and 2500 Å, respectively. The values were
derived using the photon indices and fluxes in columns (2) and (3),
respectively, and the optical luminosities in column (6), assuming a
UV continuum of the form (Vanden Berk et al. 2001). The values for all of our sources are consistent with the
expected values, given their optical luminosities (e.g., Steffen et al. 2006).
III.1.3 Compton Reflection and Fe K Emission
The relatively high redshifts of our sources allowed us to search for a Compton-reflection continuum as well as Fe K emission in their XMM-Newton spectra. A Compton-reflection continuum may be observed in AGNs within the rest-frame keV energy range, peaking at rest-frame 30 keV, and it presumably originates from reflection of hard-X-ray photons off the relatively colder outskirts of the accretion disk and/or the torus. We also searched for signatures of a neutral narrow Fe K emission line at rest-frame 6.4 keV, as this is expected to appear in conjunction with a Compton-reflection continuum. The search for continua reflected from neutral material was carried out by fitting all our XMM-Newton spectra in the 2 keV rest-frame energy range with xspec, employing a Galactic-absorbed power-law and a Compton-reflection continuum model (i.e., the pexrav model in xspec; Magdziarz & Zdziarski 1995) simultaneously with a redshifted Gaussian emission line model (using the zgauss model in xspec); the Gaussian rest-frame energy and width were fixed at keV and keV, respectively. We also included in the analysis the five luminous, high-redshift sources from S06 that have XMM-Newton spectra and H spectroscopy, namely PG 1247267, Q 1346036, PG 1630377, PG 1634706, and HE 22172818; the luminosities and accretion rates of these sources are comparable to those of the sources presented in this work. Table 3 lists the best-fit parameters from these fits. Column (3) gives the rest-frame equivalent width (EW; throughout the paper, EWs refer to rest-frame values) of the Fe K emission line and column (4) gives the relative-reflection component () of the Compton-reflection continuum expressed as , where is the solid angle subtended by the continuum source.

Except for the cases of PG 1247267 and PG 1634706, -tests carried out between the results of the pexrav+zgauss fits and the Galactic-absorbed power-law fits (§ II.2) have indicated that the new (reflection) model did not improve the fits with respect to the corresponding Galactic-absorbed power-law fits. Table 3 shows that, except for PG 1630377, we have not detected any neutral Fe K emission in any of the sources, and instead, we have placed upper limits on the EWs of such emission. Although the EW(Fe K) for PG 1630377 has a nonzero lower limit, and the EW value we found is consistent with the one found for this source by Jiménez-Bailón et al. (2005), we argue that the XMM-Newton data for PG 1630377 do not warrant the existence of a reflection spectrum based on the -test described above.
We have also tested whether the XMM-Newton spectra of our sources exhibit hard-X-ray emission reflected from ionized material. This was performed by employing the same xspec fitting routine described above for the case of reflection from neutral material, except that the pexrav model was replaced with the pexriv model (Magdziarz & Zdziarski 1995), and the energy of the Fe K line was free to vary in the 6.7–6.97 rest-frame energy range to account for an ionized iron line. The results of these fits, i.e., parameters and EW(Fe K) values, are consistent with those presented in Table 3 for the case of reflection from neutral material (even though the energies of the Fe K lines were required to be somewhat higher).
The non-detections of Fe K emission lines in the highly luminous sources under study are in accord with previous studies claiming that the strength of such emission lines decreases with increasing luminosity (aka the ‘X-ray Baldwin Effect’; e.g., Iwasawa & Taniguchi 1993; Page et al. 2004a; Zhou & Wang 2005; Bianchi et al. 2007). However, the relatively high upper limits we obtain for our EW(Fe K) values cannot rule out the possibility that such an ‘X-ray Baldwin Effect’ is very weak or does not even exist (e.g., Jiménez-Bailón et al. 2005; Jiang et al. 2006). Given the high luminosities of our sources, the expected EW(Fe K) values from such an EW- relation are of order 50 eV, while in most cases, our upper limits are considerably higher (see Table 3 and e.g., Bianchi et al. 2007).
We detect statistically significant Compton-reflection continua only in PG 1247267 and PG 1634706 (Table 3). The value we find for the first of these sources is consistent with the one found by Page et al. (2004b) for the same XMM-Newton spectrum. However, in contrast with our results, Page et al. (2004b) have not detected a significant Compton-reflection feature in the same XMM-Newton spectrum of PG 1634706 that we have analyzed, while the upper limit we obtain on the EW(Fe K) for the source is consistent with their finding; we also note that Nandra et al. (1995) have not detected any reflection features in an ASCA spectrum of the source. In addition, Page et al. (2004b) have detected an Fe K line in PG 1247267 while we have not. Interestingly, inspection of Fig. 1 of Page et al. (2004b) suggests the existence of a reflection component in both sources. An alternative spectral fitting, including a thermal component and a power-law spectrum for each source, was recently employed by Ruiz et al. (2007); their study finds a soft excess and no reflection component in both sources. These partial discrepancies may be a consequence of the different modelings and different energy ranges used in the different studies. The apparently non-physical values we obtain for PG 1247267 and PG 1634706 (i.e., steradians) may be due to the effects of general relativistic light bending (e.g., Fabian et al. 2002; Fabian & Vaughan 2003).
To improve our ability to detect or constrain the strengths of any reflection features, we jointly fitted the XMM-Newton spectra of our nine high-redshift sources from Table 3. In the joint fitting, we used the pexrav+zgauss models as before and tied all the values and normalizations to a single value (the flux level of each source was controlled by assigning to it a scaling factor that was allowed to vary freely, and the photon index for each source was also free to vary). We ran the joint fitting process four times. In the first run, all nine sources were considered. In the second run, we removed the two sources from Table 3 in which a significant Compton-reflection continuum was detected. In the third run, we removed all sources in which a non-zero value was detected, and in the fourth run we removed PG 1630377 in which an Fe K line was detected.
The best-fit values of EW(Fe K) and from the joint-fitting process appear in Table 4 where we also provide the total number of counts used in the fit and the mean redshift of the sources considered in each run. By comparing the results in Table 4 with those in Table 3, one can see that when all sources are considered (run I), a large value of is detected, while a tight constraint is placed on the mean EW(Fe K); this result is dominated by the properties of PG 1247267 and PG 1634706 that comprise 60% of the counts. In run II, one can see that despite the removal of all sources in which a Compton-reflection continuum was detected, a mean reflection component is detected, although with a relatively small value of . In run III, the Fe K detection is probably due to the fact that PG 1630377 comprises 30% of the total counts; no significant Compton reflection is detected in this case. In the final run, no significant mean reflection emission is detected; the constraint on is relatively tight while the constraint on EW(Fe K) is rather weak.
| FWHM(H) | |||||||||
|---|---|---|---|---|---|---|---|---|---|
| AGN | (1 keV)aaPower-law normalization given as the flux density at an observed-frame energy of 1 keV with units of 10-32 ergs cm-2 s-1 Hz-1; except for HE 09260201, this refers to the pn data, taken from joint fitting of all three EPIC detectors with the Galactic-absorbed power-law model. | bbIntrinsic column density in units of 1022 cm-2. Upper limits were computed with the intrinsically absorbed power-law model with Galactic absorption, and represent 90% confidence limits for each value. | (ergs s-1) | (km s-1) | () | ||||
| (1) | (2) | (3) | (4) | (5) | (6) | (7) | (8) | (9) | (10) |
| LBQS 01090213 | 70/53 | 46.8 | 7959 | 10.4 | 0.1 | 1.89 | |||
| 2QZ J023805.8274337 | 47/39 | 46.6 | 3403 | 9.5 | 0.5 | 1.66 | |||
| Q 1318113 | 70/62 | 46.9 | 4665 | 10.0 | 0.3 | 1.64 | |||
| SBS 1425606 | 38/39 | 47.4 | 4964 | 10.4 | 0.4 | 1.82 | |||
| HE 09260201 | 2/10 | 47.0ccObtained from Sulentic et al. (2006). | 5100ccObtained from Sulentic et al. (2006). | 10.1 | 0.3 | 1.80 |
Note. — The best-fit photon index, normalization, and were obtained from a Galactic-absorbed power-law model. Errors represent 90% confidence limits, taking one parameter of interest (). The optical data in columns 6 and 7 were obtained from Shemmer et al. (2004) and Netzer et al. (2007) except for HE 09260201.
These results do not provide a clear picture for the dependence of the reflection spectrum on luminosity or the accretion rate. Most of our high-redshift sources do not exhibit significant reflection components, as might be expected given their very high luminosities. Only two of these sources show a significant Compton ‘hump’, and a strong Fe K line is detected in another. In addition, significant detections of Compton humps are not accompanied by corresponding detections of Fe K lines. The results of the joint-fitting process also portray a mixed picture for the average reflection spectrum of luminous, high-accretion rate RQ AGNs as a class. The relatively weak constraints on the mean reflection properties of this class do not allow us to either confirm or rule out the existence of an ‘X-ray Baldwin Effect’, regardless of whether the X-ray luminosity or the accretion rate drives the anticorrelation with EW(Fe K) (e.g., Zhou & Wang 2005; Bianchi et al. 2007).
III.1.4 Soft Excesses
By extending the X-ray spectral fitting to the entire EPIC energy range (0.2–10 keV), we checked whether any of our nine high-redshift sources with XMM-Newton spectra (including the five high-redshift sources from S06) shows evidence for excess soft-X-ray emission, frequently observed in lower-redshift AGNs (e.g., Comastri et al. 1992; Reeves & Turner 2000; Piconcelli et al. 2005). While the physical nature of the soft excess is uncertain its presence is more pronounced among local high-accretion rate AGNs, i.e., narrow-line Seyfert 1 (NLS1) galaxies (e.g., Vaughan et al. 1999a; Boller et al. 2002; Czerny et al. 2003; Vignali et al. 2004); hence it is of interest to search for its existence in our luminous high-accretion rate sources at high redshift. We extrapolated the best-fit Galactic-absorbed power-law model obtained for rest-frame energies 2 keV (see § II.2 and Table 2) to the 0.2–10 keV observed-frame energy range and no signature of soft excess emission was detected in any of the sources (i.e., no systematic residuals were present for the extrapolated fits).
This result is not unexpected given the relatively high redshifts of our sources and the low-energy cutoff (0.2 keV) of the EPIC cameras. For example, Porquet et al. (2004) have found that the effective temperatures of the soft excess-components in a sample of moderate-luminosity sources at are of the order of keV. For our ten sources with , such temperatures shift to observed-frame values of keV. Furthermore, since the soft-excess component in most type 1 AGNs is typically observed below a rest-frame energy of keV (except for some high NLS1s, in which this component may extend up to 1.5 keV; e.g., Vaughan et al. 1999b), the detection of such a component with XMM-Newton is challenging even for sources with . Nevertheless, we have placed upper limits on the strength of a potential soft-excess component in two of our ten luminous sources that have the lowest redshifts, namely PG 1630377 and PG 1634706 (with and , respectively). In these two cases, the extension of the energy range to 0.2 keV has increased the number of photons in the fit by %. The constraint on the data-to-model ratio in the 2 keV rest-frame band, as a result of the extrapolation of the best-fit slope to the entire EPIC energy range, is 2.0 and 1.5, respectively. Finally, we note that the non-detection of soft-excess emission in PG 1247267, PG 1630377, and PG 1634706 is consistent with previous studies of their XMM-Newton spectra (Page et al. 2004b; Piconcelli et al. 2005).
III.1.5 X-ray Variability
Two of our sources, SBS 1425606 and LBQS 01090213, were previously detected by the ROSAT PSPC and HRI, respectively. For the first of these, we measured an unabsorbed flux of ergs cm-2 s-1 in the 0.5–2.0 keV observed-frame band from our XMM-Newton data, which is somewhat higher than, but consistent (within the errors) with the ROSAT flux (see also Just et al. 2007). Similarly, we measured for the second source an unabsorbed flux of ergs cm-2 s-1 in the 0.5–2.0 keV observed-frame band, which is a factor of lower than the value calculated from the ROSAT count rate. In both cases, we assumed that the photon index we measured from the XMM-Newton observations at rest-frame energies of keV also extends to the ROSAT bandpass (i.e., down to energies of 0.1 keV in the observed frame), based on the lack of detectable soft excesses in these sources (§ III.1.4). Although highly luminous RQ AGNs such as those presented here are not expected to exhibit pronounced X-ray variations even on timescales of several years (e.g., Lawrence & Papadakis 1993), the case of LBQS 01090213 is not unique, since several other luminous sources at high redshifts have displayed X-ray variations with similar amplitudes (e.g., Paolillo et al. 2004; Shemmer et al. 2005).
| EW(Fe K)aaRest-frame equivalent width of a neutral Fe K emission line at rest-frame keV and a fixed width of keV. | |||
|---|---|---|---|
| AGN | (eV) | bbRelative Compton-reflection parameter; see text for details. | |
| LBQS 01090213 | 2.349 | ||
| 2QZ J023805.8274337 | 2.471 | ||
| PG 1247267cc-test indicates that the pexrav+zgauss model results in an improved fit with respect to a power-law model. | 2.038 | ||
| Q 1318113 | 2.306 | ||
| Q 1346036 | 2.370 | ||
| SBS 1425606 | 3.202 | ||
| PG 1630377 | 1.476 | ||
| PG 1634706cc-test indicates that the pexrav+zgauss model results in an improved fit with respect to a power-law model. | 1.334 | ||
| HE 22172818 | 2.414 |
Note. — Best-fit parameters of fitting each spectrum at the 2 keV rest-frame energy range with a model consisting of a Galactic-absorbed power-law, a Compton-reflection component, and a neutral Fe K emission line. Errors represent 90% confidence limits, taking one parameter of interest ().
We also searched for rapid (on timescales of 1 hr in the rest frame) X-ray variations in the XMM-Newton and Chandra data of our five new sources by applying Kolmogorov-Smirnov tests to the lists of photon arrival times from the event files, but no significant variations were detected. Together with the results of S06, this suggests that high accretion rates do not necessarily lead to faster and higher-amplitude X-ray flux variations, as has been previously expected based on X-ray variability properties of some NLS1s, hence spoiling the analogy between NLS1s and luminous, high-redshift AGNs (e.g., Grupe et al. 2006). On the other hand, our results are consistent with the idea that more massive BHs lead to longer timescales and smaller amplitudes of X-ray flux variations (e.g., O’Neill et al. 2005).
III.2. The Hard-X-ray Power-Law Photon Index
III.2.1 Breaking the FWHM(H)- Degeneracy
In Fig. 4 we plot versus FWHM(H) and for our core sample of 35 AGNs. Twenty five of these sources are Palomar Green (PG) quasars (Schmidt & Green 1983) at with , and ten are at with . In S06, it was shown that both FWHM(H) and are significantly correlated with when only the 25 moderate-luminosity () sources are considered (in agreement with Porquet et al. 2004; Piconcelli et al. 2005; see also Table 5). This FWHM(H)- degeneracy emerges as a consequence of considering only sources with a relatively narrow luminosity range, i.e., (see also § III.1.1 and S06). When the ten highly luminous AGNs at are introduced to the analysis, both FWHM(H) and remain significantly correlated with (with % confidence); however, the significance (in terms of chance probability) of the -FWHM(H) correlation drops considerably while the significance of the - correlation increases (Table 5). The results of the - correlation do not significantly change when a constant bolometric correction factor of 7 (which is the average correction factor for the luminosity range of our sample; see § III.1.1) is used to derive values; in this case, the significance of the correlation increases with the chance probability dropping from to . As suggested in S06, the extension of the luminosity range of the sample to high luminosities has allowed us to break the degeneracy between the -FWHM(H) and - correlations and show that drives the correlation with .
| Run | No. of | No. of | EW(Fe K)aaThe EW(Fe K) corresponds to a rest-frame at the given . | ||
|---|---|---|---|---|---|
| No. | Sources | photons | (eV) | ||
| IbbAll sources from Table 3. | 9 | 39,173 | 2.22 | ||
| IIccAll sources from Table 3, excluding PG 1247267 and PG 1634706. | 7 | 15,307 | 2.37 | ||
| IIIddAll sources from Table 3, excluding PG 1247267, PG 1634706, LBQS 01090213, and Q 1318118. | 5 | 9,814 | 2.39 | ||
| IVeeAll sources from Table 3, excluding PG 1247267, PG 1630377, PG 1634706, LBQS 01090213, and Q 1318118. | 4 | 7,112 | 2.61 |
Note. — Best-fit parameters of joint fitting the spectra at the 2 keV rest-frame energy range with a model consisting of a Galactic-absorbed power-law, a Compton-reflection component, and a neutral Fe K emission line. Errors represent 90% confidence limits, taking one parameter of interest ().
We have also repeated the Mann-Whitney (MW) nonparametric rank test performed in S06 on all sources with FWHM(H) values that lie in the range 3400FWHM(H)8000 km s-1 [which is the FWHM(H) interval of the ten luminous sources in our sample]. We find a significant deviation (with % confidence) between the values of the ten luminous sources and the nine moderate-luminosity () sources in this range. In contrast, when the MW test is performed in the 0.10.5 range, the values of the two groups of AGNs are not significantly different (as can be seen clearly from Fig. 4b). These results reinforce the S06 argument that depends primarily on .
We note that in the case of two of our luminous sources, LBQS 01090213 and SBS 1425606, the values are consistent with the expected values of both FWHM(H) and , and hence they do not assist in removing the FWHM(H)- degeneracy. The first of these sources has a remarkably flat hard-X-ray spectral slope (with ; see § II.2 and Table 2), which was not expected given its original determination from Shemmer et al. (2004; see their Table 2). Owing to the new and improved spectroscopic measurements of Netzer et al. (2007) for LBQS 01090213 (SBS 1425606), FWHM(H) has increased from 5781 km s-1 to 7959 km s-1 (3144 km s-1 to 4964 km s-1), and hence has decreased from 0.2 to 0.1 (0.9 to 0.4). For the other Shemmer et al. (2004) sources used in this work, the Netzer et al. (2007) FWHM(H) measurements are consistent with those of Shemmer et al. (2004). The optical data presented in Table 2 are based on the new Netzer et al. (2007) measurements.

Our result that depends more strongly on , rather than on FWHM(H), may also serve as a partial vindication for the use of the reverberation-mapping based method to determine (see § III.1.1). From a pure mathematical point of view, in the tests described above, we essentially multiplied one observational parameter, FWHM(H), with another, , and yet the dependence of on the product of the two parameters (i.e., ) turned out to be stronger than the dependence on the single parameter. If the product of the two parameters had no physical significance, then there would be no apparent reason to expect this result.
III.2.2 The - Correlation
We use the significant correlation we find between and to derive a linear relationship between the two parameters employing a variety of statistical methods. Hereafter, we take the error bars on at the 1 level. A standard minimization method weighted by the errors on yields the following relation (with 1 errors):
| (1) |
The best-fit coefficients of this relation are consistent with those obtained by Wang et al. (2004) and Kelly (2007) who find a similar correlation in low–moderate luminosity sources. However, the value obtained by this minimization () suggests that either the data are not well represented by a linear model, the error bars on are underestimated, or there is additional intrinsic scatter in the data. Following the methods outlined in Tremaine et al. (2002) and K05, and by assuming a (i.e., a reduced ), we obtain an estimate of the additional potential scatter of in the dependent parameter; this scatter is larger than the typical measurement errors on .
| Correlation | |||
|---|---|---|---|
| -FWHM(H) | 25 | ||
| -FWHM(H) | 35 | ||
| - | 25 | ||
| - | 35 |
Note. — The last three columns represent the Spearman-rank correlation coefficient, chance probability, and number of sources for each correlation, respectively.
The observed intrinsic scatter may be induced by the uncertainty in the BH-mass estimate, and/or additional unknown physical properties, such as the optical depth in the corona, orientation, and BH spin, that vary from source to source. An additional potential source for this scatter may be attributed to variability; for example, variability may seem to have a significant contribution to the scatter since the X-ray data and the rest-frame optical data (used for obtaining ) are not contemporaneous. However, as discussed in S06, variability (i.e., changes in both and ) is not expected to dominate the observed scatter in this correlation (see also K05; Steffen et al. 2006; Wilhite et al. 2007); its effects are expected to be even less significant in this case, since our sources are mostly luminous and thus have smaller amplitudes of X-ray and optical flux variations (e.g., Lawrence & Papadakis 1993; Kaspi et al. 2007).33 3 We note that some low-luminosity AGNs are known to exhibit large X-ray flux variations (with amplitudes of factors of 10 or more) and corresponding X-ray spectral slope variations (with ) that are often due to changing spectral contributions from reflection and/or absorption (e.g., Taylor et al. 2003; Krongold et al. 2007; Grupe et al. 2008). Such changes have not been observed for moderate–high luminosity sources such as those under study in this work.
To test whether can serve as an accretion-rate indicator we switched the roles of and , allowing the first to serve as the independent variable. To account for the scatter in the - correlation, we performed a linear-regression analysis using the Bivariate Correlated Errors and Scatter method (BCES; Akritas & Bershady 1996) on the data. For this purpose, we assumed that typical uncertainties on the determination of are a factor of (e.g., Kaspi et al. 2000), and therefore assigned homoscedastic (i.e., uniform variance), errors of 0.3 dex on (). The best-fit linear relation using the BCES bisector result (with 1 errors) is
| (2) |
A linear regression based on minimization using the FITEXY routine (Press et al. 1992) gives consistent results to those obtained with BCES with . In addition, we also performed a linear-regression analysis on the data using the maximum-likelihood estimate (MLE) of Kelly (2007). The results of the different linear fits are presented in Table 6, and are shown in Fig. 5. In all three linear-regression methods outlined above, the average scatter on the predicted value of () is dex. This is only slightly higher than the typical uncertainty, dex, associated with () determinations using the reverberation-mapping based determinations.

We have also computed values using the Bentz et al. (2007) slope for the BELR size-luminosity relation (see § III.1.1). This flatter slope () results in values that are smaller by a factor of , on average, and hence values that are larger, on average, by the same factor. This has no noticeable effect on the strength of the - correlation (as expected for a nonparametric correlation) or on its slope; only the intercept (i.e., values in Table 6) is affected, and it increases slightly within the current uncertainty on its value. We conclude that the - relation is not significantly affected by small deviations from the K05 slope.
| BCES bisector | FITEXY | MLE aaSee Kelly (2007) for more details. | |||
|---|---|---|---|---|---|
Note. — The slope and intercept for each method are represented by and , respectively. Errors are at 1 confidence levels.
Based on our high-quality sample of 35 sources, we conclude that the hard-X-ray power-law spectral slope can predict the value of the normalized accretion rate in RQ AGNs, across four orders of magnitude in AGN luminosity, with an acceptable uncertainty level of a factor of 3. This may offer a useful new tool to probe the history of BH growth, based almost exclusively on the availability of high-quality hard-X-ray spectra of RQ AGNs; we discuss this in more detail in § III.4 below. Although not unexpected, and previously predicted by several studies (see § I), our result is by far the most reliable indication that the shape of the hard-X-ray power-law spectrum is largely controlled by . As mentioned in § I, a possible explanation is that the corona acts as a ‘thermostat’ by cooling more efficiently when the disk emission increases, manifested by a steepening of the hard-X-ray spectrum.
In this context, it is also interesting to note that our result may readily explain the narrow ranges observed for the values of both and in optically selected moderate–high luminosity, type 1 RQ AGNs. While is relatively narrowly distributed around a value of 0.3 (0.28 in our sample of 35 sources), with a typical dispersion of a factor of 5 around that value (e.g., McLure & Dunlop 2004; Kollmeier et al. 2006; Netzer et al. 2007; Shen et al. 2008), values for such sources typically lie in the narrow range of 1.5–2.5 (1.2–2.6 for our sample of 35 sources; see also Vignali et al. 2005). These ranges in and may be different for lower luminosity sources. In particular, for sources with (5100Å) ergs s-1, a possible difference may, in part, be attributed to a difference in their accretion mode as compared with the moderate–high luminosity sources studied in this work. Finally, we point out that a possible dependence of the bolometric correction for on , recently reported by Vasudevan & Fabian (2007), may, in part, be reflected by our results.
III.3. What Determines the Optical–X-ray SED?
The parameter is known to have a strong anticorrelation with optical–UV luminosity at 2500 Å [hereafter ], and it shows no significant dependence on redshift (e.g., Vignali et al. 2003; Strateva et al. 2005; Steffen et al. 2006; Just et al. 2007; but see also Kelly et al. 2007). This is equivalent to a non-linear relation between X-ray and optical–UV luminosity of the form , where (see Eq. 7 of Just et al. 2007 who find ). This relation still lacks a sound physical interpretation and, in particular, it is not clear what mechanism controls the proportion of reprocessed hard-X-ray emission from the corona with respect to the UV emission from the disk.
In order to test whether depends on , we selected 81 sources from the Steffen et al. (2006) sample with available FWHM(H) measurements (all these have and they include the 25 sources with from our core sample; § III.2.1), and complemented this sample with the ten luminous sources at from S06 and this work. For about half of the Steffen et al. (2006) sub-sample, FWHM(H) values were obtained from Boroson & Green (1992), and for the rest we used FWHM(H) measurements from Netzer & Trakhtenbrot (2007), kindly provided by B. Trakhtenbrot, 2007, private communication. For each source we determined the value of following the procedure outlined in § III.1. Following the arguments made in § III.2.2, the non-simultaneous X-ray and optical observations are not expected to affect our analysis considerably (see also § 3 of Steffen et al. 2006).
We find that is significantly correlated with both and ; however, the correlation with luminosity is considerably tighter (see Fig. 6). Even when a constant bolometric correction factor of 7 is used to determine values (as performed in § III.2.1), the - correlation is considerably tighter than the - correlation, although the significance of the latter correlation has increased (the chance probability has dropped from to ). By investigating this further, we find that the - correlation disappears when the - correlation is taken into account; i.e., the difference between the observed and the expected [based on the values of the sources and the most recent - relation from Just et al. 2007] is not correlated with . In another test, we divided the data into sources that have values either above or below the median value of . In both sub-samples we detect a strong - correlation (and no - correlation). These tests suggest that the - correlation is persistent and that does not depend primarily on . In this scenario, the (relatively weak) - correlation may be a consequence of the inherent dependence of on , and the relative weakness of this correlation compared with the strong - correlation may be due to the additional uncertainty introduced by determining (see, for example, the typical error bars in Fig. 6). Subsequently, if - is the fundamental correlation, then the inclusion of the FWHM(H) parameter to produce adds substantial scatter resulting in a rather weak - correlation. It is also of interest to point out that we find no correlation between and (that depends on ) in our core sample of 35 sources discussed in § III.2.2.
We also checked whether the - correlation is induced by luminosity-dependent obscuration (e.g., Lawrence 1991; Gaskell et al. 2004). In a first test, we found a strong correlation between and for our sample, with similar coefficients as in the - correlation. We note that the fluxes at 5100 Å were obtained independently from the fluxes at 2500 Å, i.e., no extrapolations have been made between the flux densities in these two wavelengths. In a second test, we redefined by changing the optical–UV continuum threshold from 2500 Å to 5100 Å; the correlations between this modified and both and for our sample returned similar correlation coefficients as in the - case. We conclude that, within the limits of our sample, it is unlikely that the - correlation is induced by potential reddening effects.
The fact that appears as the underlying parameter determining the slope of the optical–X-ray SED instead of is puzzling, since indicates the relative AGN power and significantly affects the SED of the disk. One possibility is that our empirical expression for (see S06) is inaccurate or more complicated. This, however, is not supported by the fact that does depend on as defined here and not on (see § I and § III.2.1; S06). We have also considered the possibility that the - correlation is induced by selection effects (e.g., Green et al. 2006), but this is highly unlikely given the fact that the correlation spans over five orders of magnitude in luminosity (see, e.g., Just et al. 2007). Indeed, future correlations between , , and should involve determinations for X-ray-selected sources (see § III.4 below).
An alternative approach to interpreting the non-dependence of on stems from the recent results of Vasudevan & Fabian (2007). These authors confirm the strong dependence of on in their AGN sample, but they do not find an - correlation. Utilizing far-UV, as well as optical, near-UV, and X-ray spectra for a sample of AGN with known and , they argue that the reason for the non-dependence of on lies in the choice of the optical–UV and X-ray continuum thresholds (i.e., 2500 Å and 2 keV) for the definition. While they find dramatic differences between the optical–X-ray SED of sources with different values, the ratio between the flux densities at 2500 Å and 2 keV remains almost constant as changes. The most pronounced differences between the optical–X-ray SEDs of different sources are expected to be concentrated in the keV spectral region (i.e., the ‘big blue bump’), which cannot be traced effectively using the current optical–UV and X-ray thresholds of . In this context, the parameter, given its current definition, while providing useful information on the - connection, cannot be used as an accretion-rate indicator. By inspection of Fig. 13 of Vasudevan & Fabian (2007), one may expect a strong dependence of on if, for instance, the optical–UV threshold is shifted from 2500 Å to as close as possible to Å, although this is observationally challenging and may not be practical. When using modified definitions for , there also remains the question of which correlation, - or -, is stronger than the other. In general, the choice of optical–UV and X-ray thresholds should likely depend upon the scientific question of interest.

III.4. The AGN Hard-X-ray Spectrum as a Probe for BH Growth
In § III.2.2 we have shown that may serve as an indicator in unabsorbed, moderate–high luminosity RQ AGNs with an acceptable mean uncertainty level on of a factor of 3. Therefore, in principle, given a high-quality X-ray spectrum in the 2 keV rest-frame band of a RQ AGN, one can empirically estimate and for the source. Accurate measurements of and (in the 2–10 keV rest-frame band, for example) may provide and using our Eq. 2 and Eq. 21 of Marconi et al. (2004),44 4 Vasudevan & Fabian (2007) claim that the bolometric correction factor required to transform into depends on , while Marconi et al. (2004) have used the Vignali et al. (2003) - correlation (which is not significantly different from the most recent correlation of this type given by Just et al. 2007) to derive bolometric corrections that depend on . Accurate measurements of (that provides ) and will enable comparisons of values obtained from these two methods. respectively, and thus provide an estimate of . We note that the Marconi et al. (2004) determination of (whether from or ) relies, in part, on the very strong and non-linear - dependence (see § III.3). The observed (luminosity-dependent) rms errors on that relation are given in Table 5 of Steffen et al. (2006); these represent typical deviations of up to from the mean [i.e., a factor of uncertainty on ] for our luminosity range. This scatter is inherent in the - correlation as it reflects uncertainties in determining from and potential X-ray-optical variability. For example, when values for our core sample of 35 sources are recovered from using the bolometric corrections for , the ratio between these values and the original values obtained in § III.1.1 is 1, on average, with a dispersion of a factor of 2. In an additional test, we used the and values of six nearby sources from our sample to recover their values and compare them with the most recent, direct (reverberation-mapping based) measurements from Peterson et al. (2004). The six sources, namely PG 0804761, PG 0844349, PG 0953414, PG 1211143, PG 1307085, and PG 1613658, comprise % of all the RQ AGNs with (5100Å) ergs s-1 in the Kaspi et al. (2000) sample (i.e., the PG quasar sample) that have direct measurements. We find that the ratio between the recovered X-ray-based masses and the corresponding measurements from Peterson et al. (2004) is 0.8, on average, with a dispersion of a factor of 1.9; we also find that the mass recovered for each individual source is consistent with the measured value, given the uncertainties from Eq. 2 and those from the reverberation-mapping measurements.
High-quality X-ray spectra may thus be useful for estimating the accretion rates and BH masses for moderate–high luminosity type 1, RQ AGNs and, in particular, for X-ray-selected sources. This method may allow tracing the history of BH growth in the Universe by utilizing large AGN datasets (see e.g., Brandt & Hasinger 2005) in which BH growth cannot be determined effectively using existing methods [i.e., reverberation-mapping based methods (aka single-epoch methods), e.g., K05, and host-AGN type relations, e.g., Marconi & Hunt (2003)], either due to the faintness of the sources in the optical–near-IR bands, or that the required spectroscopic features are either not accessible or cannot be modeled reliably. One advantage of the X-ray-based method is the ability to obtain and by measuring broad spectroscopic properties (i.e., ) as opposed to detailed spectroscopy for obtaining the width of an emission line (e.g., H or Mg II; this involves, for example, careful decontamination of Fe II emission features from the UV–optical spectra). Moreover, measurements of the hard-X-ray power-law spectral slope are typically not limited to specific redshift ranges, such as those dictated by atmospheric transmission bands (and detector bandpass) for ground-based spectroscopy. These advantages offer a way to obtaining many and estimates, economically, in contrast with more complicated (and redshift-restricted) spectroscopic measurements for individual sources done with existing methods. Nevertheless, we caution that the X-ray measurements of and should be done carefully to account for potential complex absorption and Compton reflection.
The X-ray-based method for estimating and may prove to be even more rewarding in cases where a source is either optically faint and/or the broad-emission lines are too weak to measure if, for example, these lines are overwhelmed by host-galaxy continuum (e.g., Moran et al. 2002; provided the source is not radio loud and that the redshift can be determined). In particular, this method may be the best way to determine and directly in obscured (i.e., optical type 2), moderate–high luminosity AGNs. Provided the X-ray absorption column density is not too high ( cm-2) and can be modeled accurately, the intrinsic hard-X-ray power-law spectrum can, in principle, provide and as outlined above. Examples of such sources with high-quality X-ray spectra are given in e.g., Civano et al. (2005), Mateos et al. (2005), and Mainieri et al. (2007). Since Compton-thin type 2 AGNs comprise a significant fraction of the AGN population, tracing the growth of the supermassive BHs in their centers using the X-ray-based method is crucial for testing models of the evolution of BH growth and accretion luminosity in the Universe in an unbiased way.
IV. Conclusions
We present X-ray spectroscopy for five highly luminous RQ AGNs at , with accurate FWHM(H) measurements that allow determinations of their and values. Analysis of the X-ray spectra provided measurements of the hard-X-ray photon index in the rest-frame 2 keV band and . We have combined these data with the S06 sample of 30 moderate–high luminosity sources with similar properties, while doubling the number of highly luminous sources in their sample. Our main goal was to test the S06 claim that can serve as an accretion-rate indicator in RQ AGNs. We have also tested whether any additional X-ray properties of our highly luminous sources depend on . Our main results are summarized as follows:
- 1.
Our new highly luminous sources with FWHM(H) measurements have allowed us to break the degeneracy between the dependence of on FWHM(H) and on , suggesting that the accretion rate largely determines the hard-X-ray spectral slope across four orders of magnitude in AGN luminosity (i.e., ).
- 2.
We found a significant correlation between and with a best-fit line of the form , and an acceptable uncertainty of a factor of 3 on a predicted value of .
- 3.
Utilizing a sample of 91 sources from Steffen et al. (2006) and this work, we find that depends strongly on optical–UV luminosity and only weakly on ; the (weak) correlation with is probably due to the strong - dependence. We discuss possible explanations for this result including the possibility that cannot be used as an accretion-rate indicator based on its current definition.
- 4.
We find a significant Compton-reflection feature in two of our sources, and the mean relative reflection for seven other sources is . By setting rather loose constraints on the strengths of Fe K emission lines in our highly luminous sources, we can neither confirm nor rule out a suggested anticorrelation between EW(Fe K) and either luminosity or ; the upper limit on the mean rest-frame EW(Fe K) for seven of these sources that do not show Compton-reflection features is 105 eV.
- 5.
We have not detected any signature of a soft-excess component in any of our highly luminous sources, including two sources at where our rest-frame coverage extends to keV, suggesting that the soft excess does not depend strongly on the accretion rate.
- 6.
Although one of our highly luminous sources, LBQS 01090213, exhibits long-term (i.e., on timescales of years) X-ray variations, rapid X-ray variations on timescales of 1 hr have not been detected in any of our highly luminous (and high-) sources, supporting the idea that X-ray variability timescale depends inversely on and does not depend on .
The strong correlation between and may serve as a useful probe for tracing the history of BH growth in the universe. It may provide and estimates for X-ray-selected AGNs, with the possibility of estimating these properties for Compton-thin type 2 AGNs for the first time.
References
- [1] Akritas, M. G., & Bershady, M. A. 1996, ApJ, 470, 706
- [2] Arnaud, K. A. 1996, ASP Conf. Ser. 101: Astronomical Data Analysis Software and Systems V, 101, 17
- [3] Bentz, M. C., Peterson, B. M., Pogge, R. W., Vestergaard, M., & Onken, C. A. 2006, ApJ, 644, 133
- [4] Bentz, M. C., Denney, K. D., Peterson, B. M., & Pogge, R. W. 2007, Astronomical Society of the Pacific Conference Series, 373, 380
- [5] Bian, W.-H. 2005, Chinese Journal of Astronony and Astrophysics, 5, 289
- [6] Bianchi, S., Guainazzi, M., Matt, G., & Fonseca Bonilla, N. 2007, A&A, 467, L19
- [7] Boller, T., et al. 2002, MNRAS, 329, L1
- [8] Boroson, T. A., & Green, R. F. 1992, ApJS, 80, 109
- [9] Brandt, W. N., & Hasinger, G. 2005, ARA&A, 43, 827
- [10] Brandt, W. N., Mathur, S., & Elvis, M. 1997, MNRAS, 285, L25
- [11] Brandt, N., & Boller, T. 1998, Astronomische Nachrichten, 319, 163
- [12] Brocksopp, C., et al. 2006, MNRAS, 366, 953
- [13] Civano, F., Comastri, A., & Brusa, M. 2005, MNRAS, 358, 693
- [14] Comastri, A., Setti, G., Zamorani, G., Elvis, M., Wilkes, B. J., McDowell, J. C., & Giommi, P. 1992, ApJ, 384, 62
- [15] Czerny, B., Nikołajuk, M., Różańska, A., Dumont, A.-M., Loska, Z., & Zycki, P. T. 2003, A&A, 412, 317
- [16] Dickey, J. M., & Lockman, F. J. 1990, ARA&A, 28, 215
- [17] Fabian, A. C., & Vaughan, S. 2003, MNRAS, 340, L28
- [18] Fabian, A. C., Ballantyne, D. R., Merloni, A., Vaughan, S., Iwasawa, K., & Boller, T. 2002, MNRAS, 331, L35
- [19] Gaskell, C. M., Goosmann, R. W., Antonucci, R. R. J., & Whysong, D. H. 2004, ApJ, 616, 147
- [20] Green, P. J., Barkhouse, W. A., Aldcroft, T. L., Kim, D., Mossman, A., Richards, G., Weinstein, M., & ChaMP Collaboration 2006, Bulletin of the American Astronomical Society, 38, 965
- [21] Grupe, D., Mathur, S., Wilkes, B., & Osmer, P. 2006, AJ, 131, 55
- [22] Grupe, D., Komossa, S., Gallo, L. C., Fabian, A. C., Larsson, J., Pradhan, A. K., Xu, D., & Miniutti, G. 2008, ArXiv e-prints, 803, arXiv:0803.2516
- [23] Haardt, F., & Maraschi, L. 1991, ApJ, 380, L51
- [24] Iwasawa, K., & Taniguchi, Y. 1993, ApJ, 413, L15
- [25] Jansen, F., et al. 2001, A&A, 365, L1
- [26] Jiang, P., Wang, J. X., & Wang, T. G. 2006, ApJ, 644, 725
- [27] Jiménez-Bailón, E., Piconcelli, E., Guainazzi, M., Schartel, N., Rodríguez-Pascual, P. M., & Santos-Lleó, M. 2005, A&A, 435, 449
- [28] Just, D. W., Brandt, W. N., Shemmer, O., Steffen, A. T., Schneider, D. P., Chartas, G., & Garmire, G. P. 2007, ApJ, 665, 1004
- [29] Kaspi, S., Smith, P. S., Netzer, H., Maoz, D., Jannuzi, B. T., & Giveon, U. 2000, ApJ, 533, 631
- [30] Kaspi, S., Maoz, D., Netzer, H., Peterson, B. M., Vestergaard, M., & Jannuzi, B. T. 2005, ApJ, 629, 61 (K05)
- [31] Kaspi, S., Brandt, W. N., Maoz, D., Netzer, H., Schneider, D. P., & Shemmer, O. 2007, ApJ, 659, 997
- [32] Kawaguchi, T., Shimura, T., & Mineshige, S. 2001, ApJ, 546, 966
- [33] Kelly, B. C. 2007, ApJ, 665, 1489
- [34] Kelly, B. C., Bechtold, J., Siemiginowska, A., Aldcroft, T., & Sobolewska, M. 2007, ApJ, 657, 116
- [35] Kollmeier, J. A., et al. 2006, ApJ, 648, 128
- [36] Krongold, Y., Nicastro, F., Elvis, M., Brickhouse, N., Binette, L., Mathur, S., & Jiménez-Bailón, E. 2007, ApJ, 659, 1022
- [37] Lawrence, A. 1991, MNRAS, 252, 586
- [38] Lawrence, A., & Papadakis, I. 1993, ApJ, 414, L85
- [39] Laor, A. 2000, New Astronomy Review, 44, 503
- [40] Leighly, K. M. 1999, ApJS, 125, 317
- [41] Lu, Y., & Yu, Q. 1999, ApJ, 526, L5
- [42] Magdziarz, P., & Zdziarski, A. A. 1995, MNRAS, 273, 837
- [43] Mainieri, V., et al. 2007, ApJS, 172, 368
- [44] Marconi, A., & Hunt, L. K. 2003, ApJ, 589, L21
- [45] Marconi, A., Risaliti, G., Gilli, R., Hunt, L. K., Maiolino, R., & Salvati, M. 2004, MNRAS, 351, 169
- [46] Mateos, S., Barcons, X., Carrera, F. J., Ceballos, M. T., Hasinger, G., Lehmann, I., Fabian, A. C., & Streblyanska, A. 2005, A&A, 444, 79
- [47] McIntosh, D. H., Rieke, M. J., Rix, H.-W., Foltz, C. B., & Weymann, R. J. 1999, ApJ, 514, 40
- [48] McLure, R. J., & Dunlop, J. S. 2004, MNRAS, 352, 1390
- [49] Moran, E. C., Filippenko, A. V., & Chornock, R. 2002, ApJ, 579, L71
- [50] Nandra, K., & Pounds, K. A. 1994, MNRAS, 268, 405
- [51] Nandra, K., Fabian, A. C., Brandt, W. N., Kunieda, H., Matsuoka, M., Mihara, T., Ogasaka, Y., & Terashima, Y. 1995, MNRAS, 276, 1
- [52] Netzer, H., & Trakhtenbrot, B. 2007, ApJ, 654, 754
- [53] Netzer, H., Lira, P., Trakhtenbrot, B., Shemmer, O., & Cury, I. 2007, ApJ, 671, 1256
- [54] Neugebauer, G., Green, R. F., Matthews, K., Schmidt, M., Soifer, B. T., & Bennett, J. 1987, ApJS, 63, 615
- [55] Nishihara, E., et al. 1997, ApJ, 488, L27
- [56] O’Neill, P. M., Nandra, K., Papadakis, I. E., & Turner, T. J. 2005, MNRAS, 358, 1405
- [57] Page, K. L., O’Brien, P. T., Reeves, J. N., & Turner, M. J. L. 2004a, MNRAS, 347, 316
- [58] Page, K. L., Reeves, J. N., O’Brien, P. T., Turner, M. J. L., & Worrall, D. M. 2004b, MNRAS, 353, 133
- [59] Page, K. L., Reeves, J. N., O’Brien, P. T., & Turner, M. J. L. 2005, MNRAS, 364, 195
- [60] Paolillo, M., Schreier, E. J., Giacconi, R., Koekemoer, A. M., & Grogin, N. A. 2004, ApJ, 611, 93
- [61] Peterson, B. M., et al. 2004, ApJ, 613, 682
- [62] Piconcelli, E., et al. 2005, A&A, 432, 15
- [63] Porquet, D., Reeves, J. N., O’Brien, P., & Brinkmann, W. 2004, A&A, 422, 85
- [64] Press, W. H., Teukolsky, S. A., Vetterling, W. T., & Flannery, B. P. 1992, Cambridge: University Press, —c1992, 2nd ed.,
- [65] Reeves, J. N. & Turner, M. J. L. 2000, MNRAS, 316, 234
- [66] Ruiz, A., Carrera, F. J., & Panessa, F. 2007, A&A, 471, 775
- [67] Schmidt, M., & Green, R. F. 1983, ApJ, 269, 352
- [68] Shemmer, O., Netzer, H., Maiolino, R., Oliva, E., Croom, S., Corbett, E., & di Fabrizio, L. 2004, ApJ, 614, 547
- [69] Shemmer, O., Brandt, W. N., Vignali, C., Schneider, D. P., Fan, X., Richards, G. T., & Strauss, M. A. 2005, ApJ, 630, 729
- [70] Shemmer, O., Brandt, W. N., Netzer, H., Maiolino, R., & Kaspi, S. 2006, ApJ, 646, L29 (S06)
- [71] Shen, Y., Greene, J. E., Strauss, M., Richards, G. T., & Schneider, D. P. 2007, ArXiv e-prints, 709, arXiv:0709.3098
- [72] Steffen, A. T., et al. 2006, AJ, 131, 2826
- [73] Strateva, I. V., Brandt, W. N., Schneider, D. P., Vanden Berk, D. G., & Vignali, C. 2005, AJ, 130, 387
- [74] Sulentic, J. W., Repetto, P., Stirpe, G. M., Marziani, P., Dultzin-Hacyan, D., & Calvani, M. 2006, A&A, 456, 929
- [75] Taylor, R. D., Uttley, P., & McHardy, I. M. 2003, MNRAS, 342, L31
- [76] Tremaine, S., et al. 2002, ApJ, 574, 740
- [77] Vanden Berk, D. E., et al. 2001, AJ, 122, 549
- [78] Vasudevan, R. V., & Fabian, A. C. 2007, MNRAS, 381, 1235
- [79] Vaughan, S., Pounds, K. A., Reeves, J., Warwick, R., & Edelson, R. 1999b, MNRAS, 308, L34
- [80] Vaughan, S., Reeves, J., Warwick, R., & Edelson, R. 1999a, MNRAS, 309, 113
- [81] Vignali, C., Brandt, W. N., & Schneider, D. P. 2003, AJ, 125, 433
- [82] Vignali, C., Brandt, W. N., Boller, T., Fabian, A. C., & Vaughan, S. 2004, MNRAS, 347, 854
- [83] Vignali, C., Brandt, W. N., Schneider, D. P., & Kaspi, S. 2005, AJ, 129, 2519
- [84] Wang, J.-M., Watarai, K.-Y., & Mineshige, S. 2004, ApJ, 607, L107
- [85] Wilhite, B. C., Brunner, R. J., Schneider, D. P., & Vanden Berk, D. E. 2007, ApJ, 669, 791
- [86] Zdziarski, A. A., Poutanen, J., & Johnson, W. N. 2000, ApJ, 542, 703
- [87] Zhou, X.-L., & Wang, J.-M. 2005, ApJ, 618, L83