Particle dynamics and effective temperature of jammed granular
matter in a slowly sheared 3D Couette cell
Abstract
We report experimental measurements of particle dynamics on slowly sheared granular matter in a three-dimensional (3D) Couette cell. A closely-packed ensemble of transparent spherical beads is confined by an external pressure and filled with fluid to match both the density and refractive index of the beads. This allows us to track tracer particles embedded in the system and obtain three-dimensional trajectories, , as a function of time. We study the PDF of the vertical and radial displacements, finding Gaussian and exponential distributions, respectively. For slow shear rates, the mean-square fluctuations in all three directions are found to be dependent only on the angular displacement of the Couette cell, , , , , where and are constants. With proportional to the time between measurements, the values of the constants, and , are found to be sub-diffusive and super-diffusive, respectively. The linear relation between and angular displacement implies a diffusive process, from which we can calculate an “effective temperature”, , in the vertical direction, through a Fluctuation-Dissipation relation. It is of interest to determine whether these systems can be described by analogous equilibrium statistical mechanics concepts such as “effective temperature” and “compactivity”. By studying the dynamics of tracer particles, we find the effective temperature defined by the Stokes-Einstein relation to be independent of the tracer particle characteristic features, such as density and size, and dependent only on the packing density of the system. For slow shear rate, both the diffusivity and mobility of tracer particles are proportional to the shear rate, giving rise to a constant effective temperature, characteristic of the jammed system. We finally discuss the significance of the existence of for a statistical mechanics formulation of granular matter.
I Introduction
Fluctuation-Dissipation (FD) relations are commonly used in equilibrium systems, derived from the notion that small perturbations and Brownian fluctuations produce the same response in a given system [1]. Mobility, the constant of proportionality between a particles drift speed and a constant external force, is extracted from velocity statistics of particles in a given system. Diffusivity, calculated from fluctuation displacements of particles in a system over time, represent the Brownian motion. The temperature of a system in thermodynamic equilibrium can be extracted from a FD relation, defined as the ratio of diffusivity and mobility, as is commonly used in the Einstein relation. In equilibrium this temperature is taken to be the bath temperature.
As studies in granular matter have grown more important within the environmental and industrial fields, the need to establish a scientific framework that accurately predicts granular system responses on the continuum level, beyond merely geometrical features, has also escalated. Granular matter, when condensed to sufficiently high volume fractions, undergoes a ‘jamming’ transition to the jammed state. The jammed state is defined as the condition when a many-body system is blocked in a configuration far from equilibrium, such that relaxation cannot occur within a measurable time-scale. For granular matter, the jammed state indicates a transition between a solid-like behavior, and a liquid-like behavior. At high volume fractions, the physical size of the constituent grains inhibits particle motion, thereby rendering the system out of equilibrium, and the granular system behaves more like a solid. Thermal motion does not govern the exploration of states in jammed granular matter.
Theories proposed by Edwards and collaborators [2] propose a statistical mechanics for granular matter based on jamming the constituent grains at a fixed total volume such that all microscopic jammed states are equally probable and exhibit ergodicity. The exploration of reversible jammed states is achieved via an external perturbation such as tapping or shear, not Brownian motion as in thermal systems. There is an important difference between reversible jammed states, and states that are only mechanically stable within certain limits of perturbation magnitude. For example, pouring grains into a container results in a pile at a particular angle of repose. This mechanical equilibrium configuration is jammed regularly but not reversibly jammed because in response to an external perturbation, the constituent particles will irreversibly rearrange, approaching a truly jammed configuration. Studying an ensemble of truly jammed, reversible states is thereby suitable for a plausible application of statistical mechanics under the present theory. These ensembles, inherently non-equilibrium systems, will not be governed by the commonly used parameters of equilibrium statistical mechanics, such as a bath temperature.
In recent studies theoretical mean-field models of glasses [3] have introduced the concept of an “effective temperature” as extracted from the FD relations in non-equilibrium systems. While not equivalent to the equilibrium bath temperature, the effective temperature reflects a change in the relaxation time-scale of the system. These non-equilibrium systems extend beyond glasses, and into granular media, where physical size of the constituent grains inhibits motion, allowing for jammed systems far from equilibrium. This concept has been furthered by computer simulations of granular media and other non-equilibrium soft-matter systems [6, 7, 8, 9, 5, 4]. It remains a question whether or not granular media can be characterized by an effective temperature, thus revealing a dynamic counterpart to the static “compactivity” as proposed by Edwards [2].
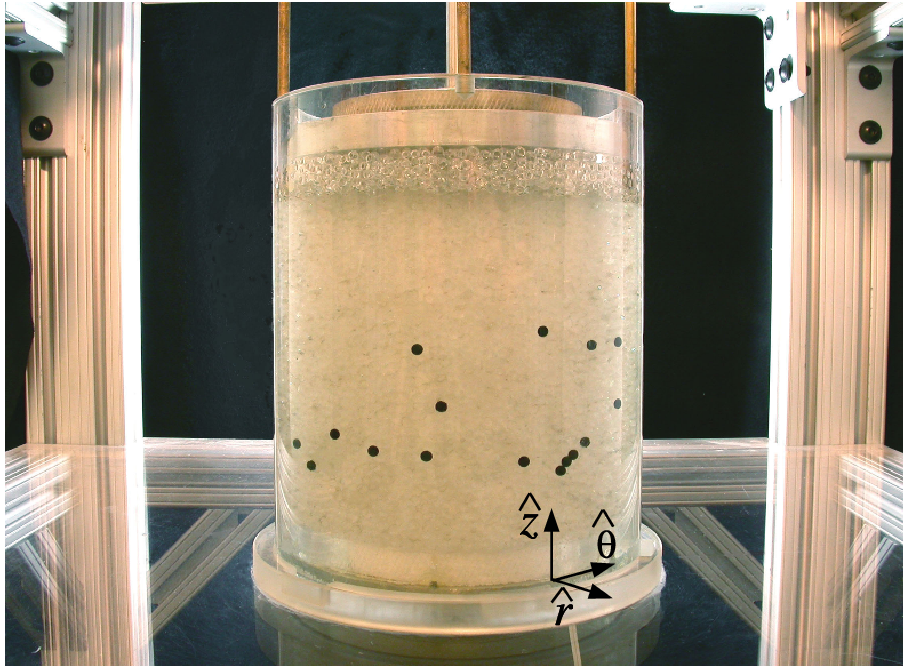
Athermal systems require the input of energy by an external source to explore the effective temperature [10]. One proposed method of calculating the effective temperature of a jammed granular system is a slow shearing procedure [11, 12, 13, 14, 17, 15, 16], leading to the design of the experiment we present in [18]. Slow shearing, at the quasi-static limit, allows for extrapolation towards an effective temperature of jammed, static, systems. The jammed system of interest is one of identical, spherical grains, confined between the two cylindrical walls of a 3D Couette cell. The grains are further confined by an external pressure in the vertical direction. The inner cylinder of the Couette cell is slowly rotated to induce shearing in the system. Tracer particles are inserted in the system, and their trajectories recorded via multiple cameras surrounding the system. The Couette cell is partially filled with a refractive index matched fluid to allow for system transparency. The cylindrical walls are roughened by gluing grains, identical to those of the bulk, such that crystallization is avoided.
The cameras record tracer particle trajectories throughout the bulk, recording data in cylindrical coordinates, . Distributions of tracer particle displacements are measured in each direction. As gravity is the external force applicable to the mobility calculation in the current formalism, only displacements in the z-direction are applied to the FD relation. Additionally, average velocity profiles are calculated for each direction, first with constant shear rate, , and further studied to determine shear rate dependence. Displacement measurements are further limited to the “constant mobility and diffusivity” (CMD) region, defined as the narrow range of radial coordinates such that the average vertical velocity is roughly independent on radial distance. The PDF of displacement distributions for each direction is presented. Further, fluctuations in displacement are determined for each cylindrical direction, and studied as a function of time. Radial displacement fluctuation is found to be sub-diffusive, while angular displacement fluctuation is found to be super-diffusive. Vertical displacement fluctuation is purely diffusive within the time scales of the experiment, allowing for the validity of the FD relations used herein. All displacement fluctuations are reduced to functions of angular displacement, and the results are presented. Such relationships permit scaling of the PDF curves with varying angular displacements due to changing shear rates.
Utilizing the FD relations presented above, the diffusivity and mobility in the z-direction are extracted from the tracer particle trajectories and the effective temperature is realized. This effective temperature is found to be independent of tracer particle properties, as shown in [18], and further independent of the slow-shear rate. Moreover, the effective temperature may then be considered a physical variable that characterizes the jammed granular system, with respect to the generalization of the equilibrium statistical mechanics of Boltzmann, as applied to non-equilibrium systems.
We further study the limits within which this effective temperature may be a valid physical variable, as we determine mobility and diffusivity as a function of shear rate. While diffusivity appears independent of shear rate, even somewhat above the ‘slow’ regime, mobility shows a clear decrease in magnitude as we explore shear rates above the slow regime, resulting in an increase in the effective temperature as a function of shear rate.
In this paper, we will further report the experimental detail of particle dynamics in [18]. The outline is as follows:
II Experimental Method
II.1 Experimental Setup
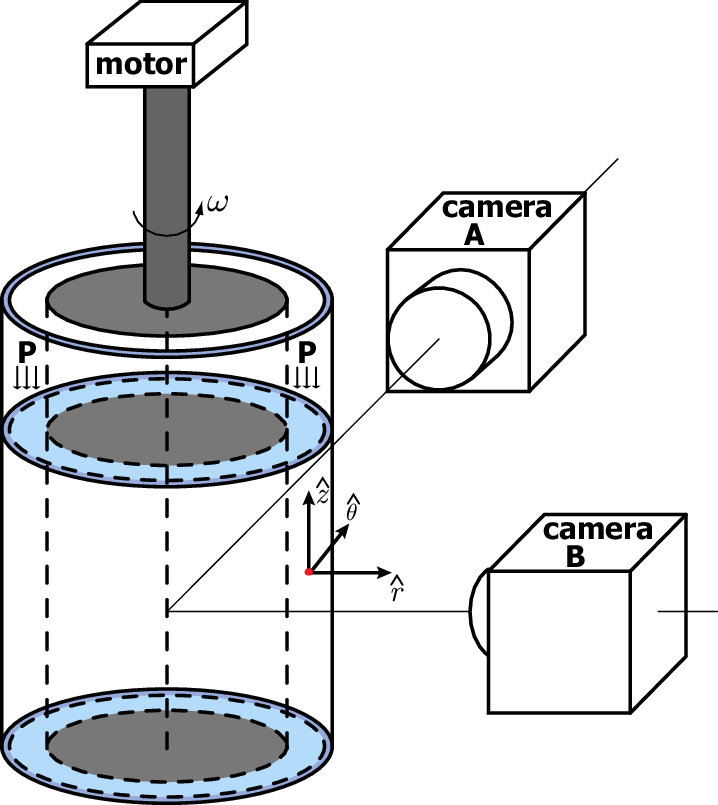
The experiment is performed using a three-dimensional (3D) Couette cell, as shown in Fig. 1, 2 and 3. The grains are confined between two cylinders of height cm. The inner cylinder is rotated via a motor, while the outer cylinder remains fixed. The walls of the cylinders, in contact with the grains, are roughened by means of a glued layer of identical granular material, thereby minimizing wall slip. The walls of the inner and outer cylinders are roughened by acrylic beads with diameter and mm, respectively. Testing the experiment with a rough inner wall and a smooth outer wall resulted in packing crystallization. The grains are compacted by an external pressure of a specific value (typically 386 Pa), introduced by a moving piston at the top of the granular material, acting in the negative z-direction.

Observation techniques are used to monitor the granular packing evolution as it explores the available jammed configurations. The Couette cell is sheared at the quasi-static limit, with slow frequencies mHz defining the external shear-rate , where cm and cm are the radius of the inner and outer cylinders, respectively, and is the angular velocity of the inner cylinder (Notice that and are measured after the walls are roughened by a glued layer of beads). The experiment is designed to measure the diffusivity and mobility of tracer particles [4, 18, 19], as opposed to tracking the motion of all constituent grains. The distance between the inner and outer cylinder is less than 10 grain diameters to prevent bulk shear band formation [15, 16, 13, 12, 17] that may interfere with the experimental measurements by altering the diffusivity.
A refractive index matching suspending solution is employed in order to create a transparent sample. The suspending solution is also density matched to the grains in order to eliminate pressure gradients derived from gravity in the vertical direction, circumventing problems seen in previous experiments of compactivity [20] and other effects such as convection and size segregation such as the Brazil nut effect inside the cell [21]. The solution used in this experiment is approximately 74% weight fraction of cyclohexyl bromide and 26% decalin [22]. These steps avoids problems encountered in previous tests of compactivity.
II.2 Packing Preparation

The granular system is a bidisperse, 1:1 by mass, mixture of spherical, transparent Poly-methyl methacrylate (acrylic) particles, with density and index of refraction . The bidisperse mixture is used in an effort to inhibit crystallization of the system. The respective particle diameters are either mm and mm (Packing 1) or mm and mm (Packing 2). The approximate same size ratio of each bidisperse packing leads to approximately the same value of volume fraction for both, being before shearing and during shearing.

A negative consequence of utilizing a suspending solution includes possible modification of the friction coefficient between the grains. While this cannot be completely avoided, it is important to note that the liquid only partially fills the cell (see Fig. 1), such that the pressure of the piston is transmitted to the granular material exclusively, not to the fluid. Additionally, hydrodynamic effects from partial cell filling are avoided by the extremely slow rotational speeds applied to our system. The system remains very closely packed, such that particles are not free to float in the fluid. Therefore, the random motion of the particles is controlled by the ‘jamming’ forces exerted by the contacts between neighboring grains, not fluid mechanics.
II.3 Implementation of Fluctuation-Dissipation Theory

Cylindrical coordinates, , of tracer particles are obtained by analyzing images acquired by four digital cameras surrounding the Couette cell. For systems in thermal equilibrium, a Fluctuation-Dissipation (FD) relation may be utilized in an effort to calculate the bath temperature of the system. This method may be extended to non-equilibrium systems, such as jammed granular systems presented in this study. The FD relation is defined as follows:
| (1) |
| (2) |
| (3) |
The tracer particles must experience a constant force, , in order to calculate the mobility as defined above. The most convenient constant, external, force, is gravity in the z-direction. If the effective temperature is to be regarded as an intensive variable of the non-equilibrium system, it requires independence from the tracer particles properties, and we present data in favor of this result. However, we acknowledge that temperature measures from multiple observables would be necessary to analyze the underlying thermodynamic meaning of .
II.4 Properties of Tracer Particles
Tracer particles added to the bulk must have properties unique from the grains comprising the bulk. However, tracer particles too small, or too large, with respect to the acrylic grains described previously, would result in erroneous measurements. Dynamics of tracer particles that were too small would be dominated by “percolation effects” [23], resulting in larger than expected tracer particle displacements. Those too large would require shear rates above the quasi-static limit we propose to study, or possibly have no dynamics at all due to size limitations. With these notions in mind, two different types of tracers, nylon () and delrin (), are employed, which result in different external forces, , where and are the densities of the acrylic particles and the tracers, respectively, is the volume of the tracer particle and the gravitational acceleration. Variations in tracer particle diameter and density allow us to study dynamical changes due to a change in constant external force, while we remain within a range appropriate to achieve results expected to be governed by the effective temperature.
II.5 Particle Tracking Technique
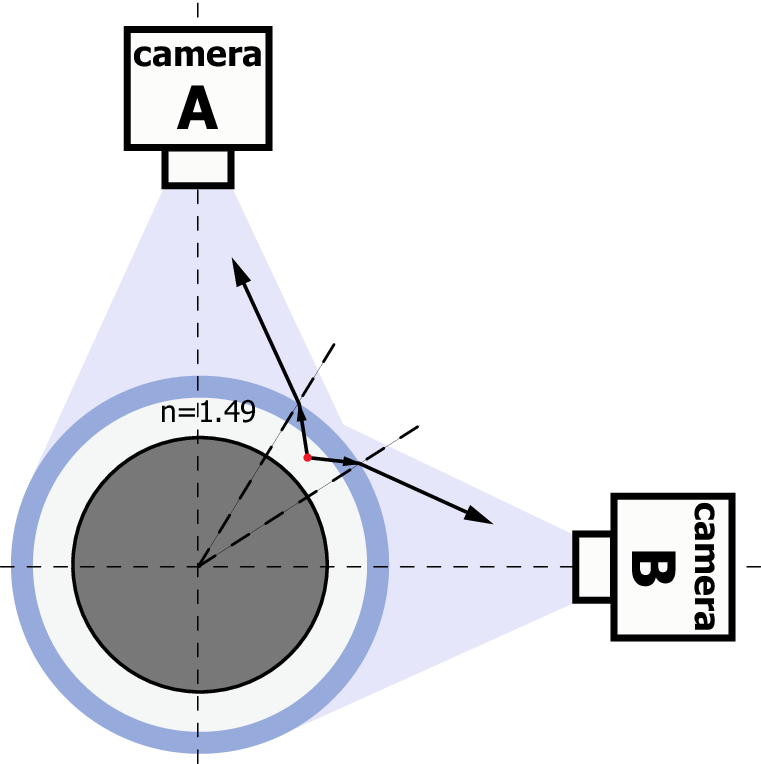
Four digital cameras symmetrically surround the shear cell to track the tracer particles with frame rate 5 frame/s, as shown in Fig. 3. The outer cylinder is made of the same material as the grains (acrylic, ). The refractive index is matched by the fluid such that the system can be regarded as an optical whole, i.e., the light scattered from tracers refracts only once at the outer surface of the outer cylinder, as shown in Fig. 2. The determination of the 3D tracer position is achieved by a simple calculation considering both system geometry and 2D projections captured by two adjacent cameras.

Camera calibration and determination of relative position is important as a minimal asymmetry will result in a large calculation error of the tracer particles coordinates, . As opposed to directly measuring relative positions of the cameras by physical devices, we utilize computer programming. In order to simplify the calculation, we assume the camera to be a pinhole, meaning all light coming into the camera coincides at a single focal point.
Before each experiment, we record the images of a piece of grid paper attached to the surface of the outer cylinder, acting as the 2D projections of the outer cylinder for each camera. Next, we adjust the positions of four cameras until each camera can give the approximately same 2D projections of the outer cylinder. Then we use the computer program to generate a virtual cylinder, along with four virtual cameras, according to the geometry of the shear cell, In other words, we build a virtual space of the entire experimental setup and the respective geometrical relations between its elements.
From the previous calibration procedure, we have the relative positions of the four cameras to the shear cylinder with sufficient accuracy. In order to further calibrate and know the exact position of cameras, we adjust the relative position of cameras in our virtual space until the virtual 2D projection of the cylinder to the cameras coincides exactly with the actual projection, being the grid paper attached to the outer cylinder. When this procedure is accomplished, the virtual space exactly coincides with the real experimental setup space. Therefore the virtual relative position of cameras are also the real positions.
Furthermore, in our virtual space, any point with 3D coordinates, , we can calculate its 2D coordinates in four virtual 2D projections, , by considering the geometry relation to cameras. Oppositely, for any tracer particle, if we know its 2D coordinates in four 2D projections, , we can exactly locate its 3D positions, , since the virtual space is equal to the actual one. The resulting vertical trajectories of the tracers are depicted in Fig. 4 showing that the nylon tracers not only diffuse, but also move with a constant average velocity to the top of the cell. Fig. 5 shows a typical trajectory of tracer particle in 3D plotting.
III Results
III.1 Average Velocity Profiles
We first study the velocity profiles for a fixed shear rate, , followed by a study on the shear rate dependence in the next section. The average velocity profiles in the angular direction, , in the vertical direction, , and in the radial direction, , are obtained by averaging the velocities of all tracer particles over all times at each radius , as shown in Fig. 6.
As observed in previous work [14], we find that can be expressed in the exponential form demonstrated in Fig. 6a:
| (4) |
where and are constants independent of shear rate, tracer size and tracer type, depending only on the type of packings and geometry of the shear cell. We find that and , and and for Packing 1 and Packing 2, respectively. When , being the angular velocity of the first layer of grains closest to the sheared inner cylinder with angular velocity . Therefore () can be taken as the efficiency of shearing, describing the amount of slip between the inner rotating cylinder and the first layer of grains it contacts. Packing 1 has a higher value of than Packing 2, as the smaller grains follow the rotating inner cylinder more easily. On the other hand, when , we find , the velocity of the last layer of grains closest to the static outer cylinder. This velocity is non-zero, so that the shear band is located right at the outer cylinder, avoiding the formation of shear bands in the bulk.

In order to avoid the tracer particles sticking to the outer cylinder surface and forcing its velocity to zero, we glue smaller size particles to roughen the outer cylinder. This roughens the surface of the outer cylinder and avoids crystallization. Further, this allows slipping of the bulk particles at the outer cylinder, forcing the shear band to be located exactly at the outer cylinder, not in the bulk. The glued particles are mm, smaller than the sheared granular material. The mean angular and vertical velocity, and , of tracer particles do not decay to zero even if the tracers come close to outer cylinder surface. (See Fig. 7 and Fig. 8 at ).
The exponential decay of results in a local shear rate, , dependent on radial distance. In the region near the outer cylinder, decays slowly with increasing which leads to weak dependence of on the radial distance . If we do Taylor expansion at , the average angular velocity of the tracers, , can be approximated to a linear function of , i.e., with constant local shear rate s-1cm-1. The diffusivity and mobility of the tracer particles strongly depend on the local rearrangement of the grains. A constant shear rate results in homogenous local rearrangement of the packings ensuring that the diffusivity and mobility of tracers, dependent on local shear rate, remain approximately independent of . As shown in Fig. 6b, we find a plateau in the vertical velocity profile which can be further seen in Fig. 8. Similar behavior is observed in the vertical diffusivity profile, as shown in Fig. 16, which we will discuss in detail in Section III.4. We denote this the “constant mobility and diffusivity region”, i.e., CMD region, cm cm. Contrary to prior work [11, 12, 13, 14, 17, 15, 16] on sheared granular matter in the Couette cell, our experiment focuses only a narrow gap, mm, of Couette cell. The CMD region allows us to well define the diffusivity and mobility of the tracer particles, such that we can calculate the average vertical velocity, , and the average vertical diffusivity, , by averaging the velocities of all tracers over all times in the CMD region, significantly improving the statistics. In this study, the statistical average and the measurements of tracer fluctuations will be confined only to the CMD region.


We find to be flat for different types of tracer particles and for different packings except when the tracers are close to the inner and outer cylinder, i.e., and , as shown in Fig. 6c. is negative and is positive, indicating the inner and outer cylinder walls can slightly attract the tracers. It should be noted that the statistics presented in this study does not incorporate data from the regions close to the inner and outer cylinder to avoid these boundary effects.

III.2 Shear Rate Dependent Average Velocity Profiles
Next, we study the dependence of the particle velocity on the external shear rate. According to Eq. (4), the velocity profile in the angular direction, , is proportional to the external shear rate . We can collapse by scaling the shear rate. The results are shown in the inset of Fig. 7 for Packing 2. The collapsing of shows a periodic shape superimposed to exponential decay with a very small amplitude, also found in the velocity profile of (see Fig. 9). The periodic length is roughly equal to the grain particle size and reflects the different layers of grains in the radial direction. This periodicity is weaker in Packing 1 than Packing 2, since the particle size of Packing 1 is smaller than that of Packing 2.
The collapsing method can be further applied to , as seen in Fig. 8. After scaling by the shear rate, also shows a flat plateau indicating the CMD region.
III.3 Probability Distribution of Displacements
Fig. 10a shows the results of the probability distribution of the displacements in the vertical direction for a given time interval . The data corresponds to the mm delrin tracers in Packing 1. Usually, 20 tracers are used for calculations. Tracer trajectories are split into sub-trajectories confined in two regions, (i): cm cm, close to the inner rotating cylinder, and (ii): cm cm, i.e., CMD region, close to the outer cylinder. We compare the calculated by using the sub-trajectories from the regions of (i) and (ii) respectively, which are plotted as black triangle and black circle in the Fig. 10a. The data in the inner region (i) clearly display an asymmetric tail for . This extra spreading is similar to the phenomena of the Taylor dispersion [24].

Taylor dispersion appears when diffusion couples with the gradient of flow giving rise to a larger dispersion along the flowing direction (see for instance [17] for a study of Taylor dispersion in granular materials). In the present experiment, the shear rate of granular flow in the angular direction exhibits exponential decay, as shown in Fig. 6b. The larger shear rate in the inner region (i) results in larger packing rearrangement, which gives rise to a larger dispersion in the vertical direction. In this case it is not possible to extract the bare diffusion constant. On the contrary, for the region (ii), i.e., CMD region, as we mentioned, the gradient of the flow, i.e., the shear rate is approximately constant, giving rise to a Gaussian diffusion, as shown in Fig. 10a. By measuring the width and the mean value of this Gaussian distribution of
| (5) |
we can define the diffusivity and mobility, and , which lead to the effective temperature of the granular packing discussed in the following section. In the Fig. 10b, we define a new scaled variable and plot for different , all the curves are found to collapse into a single curve
| (6) |
In this experiment, we will focus our measurements in the region away from the inner boundary (region (ii), i.e., CMD region), where the mobility is a constant (as shown a plateau in the inset of Fig. 8) and Taylor dispersion effects are absent.

We find exponential fluctuations for the probability distributions of the tracer particles in the radial direction as shown in Fig. 11,
| (7) |
where is a function of . The symmetric shape for indicates the absence of a shear induced segregation, as observed with multiple sizes of grains, as there is no net flow of the tracer particles towards either cylindrical wall within the time-scales of the experiment. We also observe no average motion of the tracer particles towards the center of the Couette cell except within a small range of radial distance, around cm, close to both walls where particles experience a slight attraction to boundaries. These features are shown in Fig. 6c and Fig. 9.
The analysis of the radial displacement fluctuation reveals a power law, sub-diffusive, process:
| (8) |
as shown in Figure 8, where for both the delrin and nylon tracers.
The data taken for the angular displacement is in the direction of the flow, and affected by Taylor dispersion as shown in the non-Gaussian tail of the displacement distribution in Fig. 12. This leads to a power law, super-diffusive process, illustrated by
| (9) |
as seen in the analysis of the fluctuations of shown in Fig. 12, where and for Packing 1 and Packing 2 respectively.
We further study how shear rate affects the displacement probability distribution. We find that for small shear rate, the probability distributions of displacements in the three cylindrical coordinates are independent of the shear rate, depending only on the sheared displacement, i.e., the external rotating displacement, defined as
| (10) |
where is the rotating displacement of the inner cylinder. This result is expected. Since we shear the Couette cell very slowly, the diffusion of the tracers depends only the number of granular packing configurations sampled by the Couette cell, which depends only on the sheared displacement.
As emphasized in the previous text, the statistical average and the measurements of the tracer fluctuations is confined to the CMD region, such as the shown in Fig. 17a. We calculate the by measuring the width and the mean value of the Gaussian distribution of , and obtain the by averaging the displacement fluctuations of all tracers over all time in the CMD region. Next, we apply a different method to reveal how depends on the radial distance , as shown in the Fig. 16. We first obtain for a certain radial distance , then we calculate by measuring the width and the mean value of the Gaussian distribution of . In Fig. 16, we see that the tracer particles have higher diffusivity close to the inner cylinder than the outer. Since , we can collapse all the for various shear rates, as shown in the inset of Fig. 16. The collapse of shows a plateau close to the outer cylinder, consistent with our previous discussion of the CMD region.

| (11a) | ||||
| (11b) | ||||
| (11c) | ||||
Eq. (11) implies that one can collapse the probability distribution of the displacements, , and for different shear rates and time intervals by scaling , and respectively to , and . The results are presented in Fig. 13, 14 and 15.

III.4 Effective Temperature
| Packing 1, 1:1 mass mixture of mm & mm acrylic beads, | |||||
| tracer | (mm) | (gcm-3) | ( m2s-1) | ( skg-1) | ( J) |
| acrylic | |||||
| delrin | |||||
| delrin | |||||
| nylon | |||||
| ceramic | |||||
| brass | |||||
| Packing 2, 1:1 mass mixture of mm & mm acrylic beads, | |||||
| tracer | (mm) | (gcm-3) | ( m2s-1) | ( skg-1) | ( J) |
| nylon | |||||
| nylon | |||||
We present results for the diffusivity in the direction, the only direction where the effective temperature can be calculated due to the vertically acting external force. The Gaussian distribution in allows us to apply the FD relation to the particle displacements, as the diffusivity is proportional to the variance of a Gaussian distribution in displacements. Exponential fluctuations do not possess this same property, but it is important to note that the radial direction has no constant applied external force. It remains a possibility that a well-defined effective temperature for displacements in the radial direction could exist. To test whether the effective temperature is isotropic, as done in [25], may be of great interest in future studies.
A common method of performing a time average to measure transport coefficients is employed (see Chapter 5.3 in [26]) by dividing the trajectory of a single tracer particle into a series of trajectories, having evenly spaced start times, separated by time interval . The diffusion constant is obtained by averaging over the aggregate of tracers and over the initial time intervals, allowing for the use of merely 20 tracer particles in this particular system. Correlations between measurements are ensured to have decayed almost to zero, rendering time-translational invariance valid in this system, without any measurable“aging”, since under shearing, system reaches the “stationary state” [27]. Furthermore, doubling the number of tracer particles leaves unchanged, indicating independence of the diffusion constant from the number of tracers that explore the jammed configurations of this non-equilibrium system.
Analysis of the vertical particle displacements in the CMD region reveals a Gaussian distribution, broadening over time, as seen in Fig. 10 and Fig. 13. For sufficiently long times period, the mean square fluctuations grow linearly (see Fig. 17a):
| (12) |
where is the self-diffusion constant in the vertical direction. For the both nylon and delrin mm tracers in Packing 1 we obtain m2/s.
Figure 17b shows mean value tracer particle positions, extracted from the peak of the Gaussian distribution, as a function of time. The mobility in the vertical direction, , is defined as
| (13) |
The applied force on the tracers, , is the gravitational force due to density mismatch where and are the densities of the acrylic particles and the tracers, respectively, is the volume of the tracer particle and the gravitational acceleration. The value of the mobility for the both nylon and delrin mm tracers in Packing 1 is s/kg.
Fig. 17a further reveals a downward curvature of the mean-square fluctuations, for sufficiently long times period. Additionally, an apparent cut-off time for the tracer particles fluctuation measurements is shown. These effects are due to the finite size effect imposed upon the tracers by the finite trajectories and should be inversely proportional to the tracer particles velocities. Tracer particles with larger mobility will have larger mean velocities and take a shorter time to complete its trajectory in the cell. The cut-off discussed in reference to Fig. 17a is prominently displayed in the mm delrin tracers of Packing 1, having the largest mobility, hence increased mean velocities, as shown in Fig. 17b. The larger mobility results in the shortest cut-off time for the diffusivity. Conversely, mm delrin tracers of Packing 1 have a smaller mobility, hence a longer cut-off time for the diffusivity. It is important to note that for all tracer particles studied here, the cut-off is observed for distances larger than a few particles diameters, ensuring that the study examines the structural motion of the grains and not internal motion inside of “cages”.

According to a Fluctuation-Dissipation relation, we calculate :
| (14) |
Fig. 17c shows a parametric plot of fluctuations and responses, with , as the parameter, as extracted from Fig. 17a and Fig. 17b. A linear relationship exists between diffusivity and mobility, with a slope of . We obtain for the both nylon and delrin mm tracers in Packing 1, .
If the effective temperature is to be regarded as an intensive thermodynamic quantity, changing the tracer particle size should give rise to a different diffusion and mobility yet result in the same measurement of effective temperature. The above calculation is repeated for delrin tracers of mm in Packing 1. We find that while the mobility and diffusivity change dramatically with respect to tracers of mm, ( m2/s and s/kg) as shown in Table 1, due to the change in tracer size, their ratio remains unchanged. In all cases and are inversely proportional to the size of the tracers, but the effective temperature remains approximately the same, as seen in Fig. 17c, with an average value over all tracers of
| (15) |
Though this effective temperature is high with respect to the bath temperature, we note that a plausible scale for the system energy [10], is , the gravitational potential energy to move a nylon tracer particle one particle diameter, . A corresponding temperature would arise from the conversion of this energy into a temperature via the Boltzmann constant, , is at room temperature (T = 300K). This specific value serves as a coarse-grained estimate, since the tracer size and density clearly shift its value, and we focus on the order of magnitude. This large value is expected [10], and agrees with computer simulation estimates for an athermal granular system [4]. Therefore, our calculated value for in a sheared granular system appears reasonable within the boundaries of the present theory.
III.5 Linear Response Regime

In an effort to further test the concept of the effective temperature as an intensive quantity, a linear response regime in the system is of great interest. Such a regime would imply that mobility and diffusivity are independent of the external gravitational force as . The external force is varied by changing the density of the tracers of the same size. This is realized experimentally in Packing 1 by the introduction of delrin () tracers of mm diameter, the density of which is higher than that of nylon ().
Analysis of the trajectories reveals that the mobility is approximately the same for both the delrin and nylon tracers with the same diameter and is thereby independent of the external force, as shown in Fig. 17b and Fig. 18. Further, the external force should have no effect on the diffusivity. By calculating the diffusivity of the non-tracer particles via dying acrylic tracers and analyzing their trajectories, as shown in Fig. 17a, the diffusion of the acrylic tracers of size mm (for which no external force is applied) is the same as the diffusion of the delrin tracers of the same size (for which the gravitational force is applied). A further example of this property would be using two different tracers with different sizes, but having the same external force applied. One would calculate two different values of the diffusivity, due to the variation in tracer size, without having any variation in external force.
Nonlinear effects appear for tracers heavier than delrin, implying that mobility depends on the external force for large enough forces. We find that for a mm ceramic tracer in Packing 1 the mobility is s/kg and for a brass tracer , s/kg as shown in Table 1, smaller than the mobility of the nylon and delrin tracers of the same size. This behavior is expected since if a linear regime exists in the system, it will be valid only within certain limits, i.e., remains a constant for small value of external force, , as shown in Fig. 18. It is here that our experiments approach the boundaries presented above for estimated of energy scales for the sheared granular system. Our effective temperature measurements are therefore limited to those tracer particles for which we experience a linear regime with respect to both mobility and diffusivity.
Lastly, the experiment is again repeated for a different packing of spherical particles, noted earlier as Packing 2. Having nearly the same volume fraction of particles being both packings of spherical particles, one would expect to remain unchanged, as it is a measure of how dense the particulate packing is (i.e. a large implies a loose configuration, e.g. random loose packing, while a reduced implies a more compact structure, e.g. random close packing). It is found that although differences exist between the two packings with respect to mobility and diffusivity, as shown in Fig. 17a,b, the effective temperature remains approximately the same, as shown in Fig. 17c. It should be noted that both packings are composed of spherical particles and the statement regarding effective temperature as a measure of particulate packing density would not be true if the packings are composed of particles of, for instance, different shapes, even if they have the same volume fraction.

III.6 Shear Rate Dependence
We further explore the effective temperature as an intensive quantity by analyzing diffusivity and mobility as a function of the shear rate. We show in Fig. 19 that the effective temperature seems to become approximately constant, as long as the particulate motion is slow enough such that the system is very close to jamming. We find that
| (16) |
| (17) |
while remains approximately constant for sufficiently small .
It is within this quasi-static range where the effective temperature could be identified with exploration of the jammed configurations. As it remains an important assumption of this study that the system is being continuously jammed, shear rates high enough to impact the effective temperature measurement imply systems that are not continuously exploring jammed configurations. As we study the nature of the jammed granular packings, it is logical to presume that quasi-static shearing will provide systems of interest. The limit of as may result in an effective temperature for the static jammed configuration. The quasi-static shear rate regime observed could be analogous to the shear-rate independent regime observed in the behavior of shear stress in slowly sheared granular materials [28, 29]. This solid friction-like behavior has been previously studied [28, 29] and occurs when frictional forces and enduring contacts dominate the dynamics. This regime has been also observed in recent computer simulations of the effective temperature of sheared granular materials [5, 30]. Our calculations of for systems close to jamming exclude the systems outside of the quasi-static range, in accordance with prior studies.
IV Outlook: Significance Of for a Statistical Mechanics of Grains
In contrast to measurements of slow mode temperatures, exemplified by , we also measure the temperature of the fast modes as given by the root mean square (RMS) fluctuations of the velocity of the particles. It should be noted that these velocities are not instantaneous, as the time necessary to obtain an instantaneous velocity is much smaller than the time between measurements. Nevertheless, we can obtain an estimate of the kinetic granular temperature, , from , where with the average kinetic energy of the grains. We obtain , or and , or , for mm and mm delrin tracers in packing 1, respectively. Here, , the room temperature, and . This kinetic granular temperature is smaller than and differs for each type of tracer indicating that it is not governed by the same statistics. Similar results have been obtained in experiments of vibrated granular gases [31]. The significance of this result is that fast modes of relaxation are governed by a different temperature. This result is analogous to what is found in models of glasses and computer simulations of molecular glasses (see for instance Refs. [3, 32, 33, 27, 34]). In the glassy phase of these models, the bath temperature is found to control the fast modes of relaxation and a different, larger, effective temperature is found to control the slow modes of relaxation. Similarly, we find a granular bath temperature for the fast modes and a larger effective temperature for slow modes of relaxation.
It is possible to identify as the property of the system governing the exploration of jammed configurations. As this particular non-equilibrium system remains athermal, the ’bath’ temperature in which the grains exist is immaterial, as shown above. Particle diffusion is of the order of several particle diameters over the time scale of the experiment (see Fig. 4 and 17a) implying that exploration of the available jammed configurations occurs via rearrangements of the particles outside their “cages”, suggesting that the trajectory of the system can be mapped onto successive jammed configurations explored by the system.
Incorporating certain experimental conditions of reversibility, and ergodicity, a statistical mechanics formulation may well describe a jammed granular system [2, 35]. Under the primary assumption that different jammed configurations are taken to have equal statistical weight, observables can be calculated by “flat” averages over the jammed configurational space [2, 38, 7, 36, 4, 37, 39]. This assumption, advocated by Edwards and collaborators, has been thoroughly debated in the literature (see for instance [27, 40]). Existing work suggests the effective temperature obtained by applying a fluctuation-dissipation theory to non-equilibrium systems is analogous to performing a “flat” average over the jammed configurational space, at least for frictionless systems [4]. Additionally, the effective temperature can be identified with the compactivity introduced in [2], resulting from entropic calculations of the granular packing [38, 7, 4]. Experimentally testing these ideas is difficult as the entropy of the jammed configurations is not easily measured, and it is not possible to obtain the compactivity from entropic considerations in the present study.
The exploration of reversible jammed states in granular matter bears similarity to that of inherent structures in glasses. Inherent structures form a network of attractive basins within an energy landscape, and the system explores these basins as governed by their stability over the slow-relaxation time of the glass. It should be noted, however, that there exists a crucial difference between glasses and grains. In liquids energy remains conserved, while energy is dissipated in granular systems through frictional contact and path dependent forces between grains. Thus, a driven granular system will quickly come to a mechanically stable, or jammed, state after the removal of the driving forces. By its nature, energy is not conserved in a granular system. As energy conservation is the crucial property used to define an energy ensemble in statistical mechanics, the use of energy to characterize granular systems is questionable. Thus, while seems to imply the exploration of reversible jammed states within an energy ensemble, with
| (18) |
describing the nature of the exploration, the validity of the energy ensemble to describe granular matter in the absence of energy conservation remains an open question. Here, we set the analogous Boltzmann constant for grains equal to unity for simplicity.
Noting the drastic difference between the bath temperature and the effective temperature in a granular system, we are inspired towards a more careful analysis of the energy ensemble in slowly driven granular systems. The work of Edwards has promoted the concept of a volume ensemble, where the free volume per grain in a static granular system replaces the energy as the conserved quantity of the non-equilibrium system, at a particular volume fraction [2, 35]. The basis for using the volume ensemble stems from the ability to conserve volume in a given packing and additivity of volume per grain. Further, it is possible to explore the configuration of states at a fixed volume, via experiment or simulation. The statistical mechanics is then derived using methods similar to Boltzmann statistics for equilibrium systems. From these methods, one can obtain the compactivity, , as a derivative of the entropy with respect to the volume, enabling the calculation of an equation of state in the volume ensemble as follows.
| (19) |
The compactivity, , is thereby assumed to be an equilibrium measure of a system within the framework of the volume ensemble, much like the bath temperature of the energy ensemble. This assumption can be realized by performing an ABC experiment and testing a zero-th law of thermodynamics for volumes [40]. According to the zero-th law of thermodynamics, if system A and C are in thermal equilibrium with system B respectively, then A and C are in thermal equilibrium with equal temperature. In granular system, such an experiment would require two granular systems with distinct volumes, and , with the same . Bringing these two systems together should result in a granular system of volume , at the same , if the assumption is valid. This experiment is feasible due to the fact that it is always possible to prepare a system at a given volume fraction and will be the subject of future study and experiment, facilitated by recent theoretical findings [41].
Similar to the conservation of volume, boundary stress may also be a conserved quantity in jammed granular systems, and Edwards statistical mechanics for volume distributions could be applied analogously to the distribution of boundary stresses, , or forces, referred to as the force ensemble [42, 43]. The angoricity, , is calculated as the derivative of the entropy with respect to the boundary stress, and an additional equation of state is thereby achieved as follows:
| (20) |
This result can be combined with that of the volume ensemble in an effort to accurately define the statistical mechanics of static jammed granular matter. Such an approach remains a topic of ongoing research.
However, slowly driven granular systems introduce yet another ensemble, the energy ensemble, from which the above defined is derived. While the above results reveal that does not tend to zero as the magnitude of the driving force decreases, indicating extrapolation to a non-zero static quantity, it remains unclear how the effective temperature may relate to the compactivity and angoricity as defined by Edwards statistics. Are we defining a new static quantity by determining the static limit of , or are we expanding the statistical mechanics of jammed granular matter to include dynamic systems by relating , and ? is obtained in the quasi-static limit , while the volume and force ensembles correspond to , exactly. Is it possible that a relation between , and can be expected?
There exists the further requirement of energy conservation for the validity of a Boltzmann approach that would guarantee:
| (21) |
As discussed above, energy is constantly dissipated in a driven granular system, through Coulomb friction and path-dependent tangential forces between grains. However, the input of energy by the external driving force brings the system to a steady state where the average energy is constant over the time-scale of the experiment. This steady state energy could be likened to the conserved variable in a statistical formalism depicted in Eq. 21, thereby introducing a thermodynamic meaning for .
In a compressed emulsion system the absence of Coulomb friction and inter-particle tangential forces greatly simplifies the formalism [44]. Jamming occurs due to osmotic pressure, and the system remains athermal as a result of the large particle size. A well defined potential energy exists due to the absence of tangential forces, corresponding to the deformation of the particles at the inter-particle contact points. Therefore, a restriction to use the energy ensemble in an effort to describe a jammed system is lifted, as frictional tangential forces no longer hinder energy conservation.
Computer simulations of frictionless emulsion droplets [40] incorporate a simulated annealing method employing an auxiliary temperature to sample the available jammed configurations. The simulated annealing method assumes a Boltzmann distribution, or a flat average assumption, over the jammed states of the emulsion. The obtained by Eq. 21 with simulated annealing methods [4] is very close in value to the obtained via the FDT calculations as in the present work. Such a result could indicate that ergodicity holds in this frictionless system, a further justification of the methods presented herein. Therefore, a firmer basis for the validity of using the obtained in the quasi-static limit to describe the statistical mechanics of the same system at the static limit is achieved.
Further, remains approximately constant with varying tracer particle size, implying a zero-th law of thermodynamics for slowly sheared jammed granular systems. These statements further provoke the necessity for an ABC experiment, to test the zero-th law for the effective temperature, as well as similar experiments for the compacitivity and angoricity. Such experiments may enlighten us to understand under what conditions , and may be valid in describing the statistics of the jammed and nearly jammed granular systems.
At this point, we believe that the most prominent direction is the exploration of the volume and pressure ensembles. Our understanding is that these ensembles may be sufficient to characterize the jammed state of granular matter, while the energy ensemble may be necessary for slowly moving granular systems. These are open questions at the present time. Recent papers in the theory and simulation front suggest that the compactivity characterizes the system into a phase diagram at the isostatic point, while the angoricity will be necessary to describe the pressure ensemble of compressible granular matter [41].
V Summary
In summary, this study focuses on the dynamics of slowly sheared granular matter in a 3D Couette cell. A mixture of spherical, transparent and bi-disperse grains are confined between two cylinders, having walls roughened by glued identical grains, with the inner cylinder rotated via motor. We compact the grains by means of an external pressure in the negative z-direction. Fluid matching the density and refractive index of the grains partially fills the cell, allowing tracking of tracer particle trajectories as a function of time. Tracers of varying density and size are used. Multiple cameras track the tracer particle positions relative to the cylinders.
We find that the angular velocity of the tracer particles, , follows an exponential relation with , defined by the type of packing and geometry of the Couette cell. The velocity of the last layer of grains is non-zero, such that the shear band is located at the outer cylinder and ensures no formation of shear bands in the bulk. Near the outer cylinder decays slowly with increasing , such that can be approximated linearly with a constant local shear rate. The constant local shear rate ensures that the mobility and diffusivity of tracers, dependent on local shear rate, remain approximately independent of . We define this region the “constant mobility and diffusivity region”, or the CMD region.
An “effective temperature”, , is realized by a fluctuation-dissipation relation generalized to granular materials. Statistical measurements are confined exclusively to the CMD region. The mobility in the vertical direction, , is found to be proportional to the shear rate, , for small enough values of . As is also found proportional to shear rate, collapsing all the for various shear rates shows a plateau in the CMD region. An approximately constant effective temperature is obtained from measurements of the mobility and diffusivity, under a constant external applied force, and with sufficiently small shear rates. This effective temperature is calculated by an analogous equation used in equilibrium statistical mechanics. We find this effective temperature to be independent of the tracer particle properties, and dependent only on the packing density of the system. While this result describes an intensive property of the system, it remains an important future study to test the effective temperature against the laws of thermodynamics. More specifically, a test of the zeroth-law of thermodynamics with respect to these non-equilibrium jammed systems could expand the scope of beyond that of an intensive quantity of a particular system. A well defined effective temperature in the radial direction may exist, though its existence would require a constant external force applied in the radial direction.
The probability distribution of the displacements in the radial direction, , reveals exponential fluctuations. The analysis of the fluctuations reveals a power law, sub-diffusive, process, , with less than unity. A similar analysis for fluctuations in the angular direction reveal a super-diffusive process, , with greater than unity. Lastly, the probability distribution of the displacements in the vertical direction are found have a Gaussian distribution such that . It is this linearity that defines vertical displacement as a diffusive process, and allows for the use of the Fluctuation-Dissipation relation to calculate the diffusivity in the vertical direction. We further discover a linear relationship between angular displacement and the time between measurements , such that all mean square fluctuations can be defined in terms of for the small shear rates of our experiments.
In the CMD region, the linear approximation of proportional to approximately constant external shear rate, , allows for the collapsing of all tracer particle velocity curves via dividing by the shear rate. This collapse reveals a periodic shape with a small amplitude and periodic length roughly equal to the grain size. The effect is shown to be weaker in packings with smaller size grains. We further apply this remarkable scaling feature and , achieving similar results.
It is important to note that the effective temperature, defined in this study for small shear rates, does not remain constant as the shear rate increases. While previous studies have discovered an an increasing effective temperature via simulations, we have measured diffusivity and mobility separately in an effort to calculate through a fluctuation-dissipation relation. We find the diffusivity in the z-direction remains approximately constant throughout the range of shear rates used in this experiment, while the mobility in the z-direction approaches a plateau. exclusively increasing . Such an effect in the radial direction would be of great interest for future studies in sheared granular dynamics.
The nearly constant value of with respect to varying tracer particle size indicates that a zero-th law of thermodynamics for slowly sheared jammed granular systems could be valid and prompts one to perform an ABC experiment, fully testing the zero-th law for the effective temperature.
As we work towards a more complete description of the statistical mechanics of jammed granular matter, we strive to incorporate the varied statistical ensembles into one fundamental picture. These ensembles include the energy ensemble, as described herein, along with the volume and force ensembles, as proposed by Edwards. Such an incorporation may link static quantities of compacitivity and angoricity, describing volume and force ensembles, respectively, to the dynamic effective temperature presented in this study, derived from the energy ensemble. The exact nature of the relation between such quantities remains an open topic. Ultimately, these quantities will help to develop a thorough statistical description for jammed granular matter and reveal an equation of state. A deeper topic of concern is the formation of a clear definition of energy in jammed granular matter. Energy is not conserved in frictional systems and it remains open to debate as to how one would incorporate energy into the statistical mechanics.
One possible approach to describe the energy of jammed systems is to consider the similarities between the inherent structure formalism of glasses and the exploration of jammed states in granular matter, at least for the case of frictionless granular systems. Inherent structures probe a network of potential energy basins within an energy landscape. Such an approach toward the jammed states of granular matter may assist in understanding exactly what is meant by energy within the framework of a non-equilibrium system.
References
- [1] L. D. Landau and E. M. Lifshitz, Statistical Physics, (Pergamon, New York, 1970).
- [2] S. F. Edwards, The role of entropy in the specification of a powder, in Granular Matter: an Interdisciplinary Approach (Mehta, A., editor) 121-140 (Springer-Verlag, New York, 1994).
- [3] L. F. Cugliandolo, J. Kurchan and L. Peliti, Phys. Rev. E 55, 3898 (1997).
- [4] H. A. Makse and J. Kurchan, Nature 415, 614 (2002).
- [5] I. K. Ono, C. S. O’Hern, D. J. Durian, S. A. Langer, A. J. Liu and S. R. Nagel, Phys. Rev. Lett. 89, 095703 (2002).
- [6] S. A. Langer and A. J. Liu, Europhysics Lett. 49, 68 (2000).
- [7] A. Barrat, J. Kurchan, V. Loreto and M. Sellitto, Phys. Rev. Lett. 85, 5034 (2000).
- [8] F. Sciortino and P. Tartaglia, Phys. Rev. Lett. 86, 107 (2001).
- [9] J. L. Barrat and L. Berthier, Phys. Rev. E 63, 012503 (2001).
- [10] H. M. Jaeger, S. R. Nagel and R. P. Behringer, Rev. Mod. Phys. 68, 1259 (1996).
- [11] D. W. Howell, R. P. Behringer and C. T. Veje, Phys. Rev. Lett 82, 5241 (1999).
- [12] C. T. Veje, D. W. Howell and R. P. Behringer, Phys. Rev. E 59, 739 (1999).
- [13] D. M. Mueth, G. F. Debregeas, G. S. Karczmar, P. J. Eng, S. R. Nagel, and H. M. Jaeger, Nature 406, 385 (2000).
- [14] D. M. Mueth Phys. Rev. E 67, 011304 (2003).
- [15] R. Nedderman, Statics and Kinematics of Granular Materials (Cambridge Univ. Press, Cambridge, 1992).
- [16] T. G. Drake, J. Geophys. Res. 95, 8681 (1990).
- [17] B. Utter and R. P. Behringer, Phys. Rev. E 69, 031308 (2004).
- [18] C. Song, P. Wang, and H. A. Makse, Proc. Nat. Acad. Sci. 102, 2299 (2005).
- [19] P. Wang, C. Song and H. A. Makse, Nature Physics 2, 526 (2006).
- [20] E. R. Nowak, J. B. Knight, E. Ben Naim, H. M. Jaeger and S. R. Nagel, Phys. Rev. E 57, 1971 (1998).
- [21] R. Khosropour, J. Zirinsky, H. K. Pak and R. P. Behringer, Phys. Rev. E 56, 4467 (1997).
- [22] E. R. Weeks, J. C. Crocker, A. C. Levitt, A. Schofield and D. A. Weitz, Science 287, 627 (2000).
- [23] J. A. Drahun and J. Bridgwater, Powder Technol. 36, 39 (1983).
- [24] G. Taylor, Proc. Roy. Soc. A 219, 186 (1953).
- [25] G. D’Anna, P. Mayor, A. Barrat, V. Loreto and F. Nori, Nature 424, 909 (2003).
- [26] D. C. Rapaport, The Art of Molecular Dynamics Simulation (Cambridge University Press, Cambridge, 1995).
- [27] A. Coniglio, A. Fierro, H. J. Herrmann and M. Nicodemi, (eds) Unifying Concepts in Granular Media and Glasses (Elsevier, Amsterdam, 2004).
- [28] S. B. Savage, Adv. Appl. Mech. 24, 289 (1994).
- [29] G. I. Tardos, S. McNamara and I. Talu, Powder Tech 131 23 (2003).
- [30] N. Xu and C. S. O’Hern, Phys. Rev. Lett. 94, 055701 (2005).
- [31] K. Feitosa and N. Menon, Phys. Rev. Lett. 88, 198301 (2002).
- [32] A. J. Liu and S. R. Nagel, (eds) Jamming and Rheology: Constrained Dynamics on Microscopic and Macroscopic Scales, (Taylor & Francis, London, 2001).
- [33] A. Mehta and T. C. Halsey, (eds) Challenges in Granular Physics (World Scientific, Singapore, 2002).
- [34] H. Hinrichsen and D. E. Wolf, (eds) The Physics of Granular Media (Wiley-VCH Verlag, 2004).
- [35] S. F. Edwards and R. B. S. Oakeshott, Physica A 157, 1080 (1989).
- [36] A. Fierro, M. Nicodemi and A. Coniglio, Europhys. Lett. 59, 642 (2002); A. Fierro, M. Nicodemi, and A. Coniglio, Phys. Rev. E 66, 061301 (2002).
- [37] A. Mehta and J. M. Luck, J. Phys. A.: Math. Gen. 36, L365 (2003).
- [38] J. Kurchan, J. Phys.: Condens. Matter 12, 6611 (2000).
- [39] J. Berg and A. Mehta, Phys. Rev. E 65, 031305 (2002).
- [40] H. A. Makse, J. Brujić and S. F. Edwards, Statistical Mechanics of Jammed Matter, in H. Hinrichsen and D. E. Wolf, (eds) The Physics of Granular Media (Wiley-VCH Verlag, 2004).
- [41] C. Song, P. Wang and H. A. Makse, Nature 453, 629 (2008).
- [42] S. F. Edwards, Physics A 353, 114 (2005).
- [43] S. Henkes, C. S. O’Hern, and B. Chakraborty, Phys. Rev. Lett. 99, 038002 (2007).
- [44] J. Brujić, C. Song, P. Wang, C. Briscoe, G. Marty, and H. A. Makse, Phys. Rev. Lett. 98, 248001 (2007).
We are deeply grateful to M. Shattuck for help in the design of the Couette cell and J. Kurchan and J. Brujić for discussions. We acknowledge financial support from the DOE, and NSF.