Narrow associated QSO absorbers: clustering, outflows and the line-of-sight proximity effect
Abstract
Using data from the Sloan Digital Sky Survey data release 3 (SDSS DR3) we investigate how narrow (700km/s) C iv and Mg ii quasar absorption line systems are distributed around quasars. The C iv absorbers lie in the redshift range and the Mg ii absorbers in the range . By correlating absorbers with quasars on different but neighbouring lines-of-sight, we measure the clustering of absorbers around quasars on comoving scales between 4 and 30 Mpc. The observed comoving correlation lengths are Mpc, similar to those observed for bright galaxies at these redshifts. Comparing with correlations between absorbers and the quasars in whose spectra they are identified then implies: (i) that quasars destroy absorbers to comoving distances of kpc (C iv) and kpc (Mg ii) along their lines-of-sight; (ii) that % of C iv absorbers within 3,000 km/s of the QSO are not a result of large-scale clustering but rather are directly associated with the quasar itself; (iii) that this intrinsic absorber population extends to outflow velocities of order 12,000 km/s; (iv) that this outflow component is present in both radio-loud and radio-quiet quasars; and (v) that a small high-velocity outflow component is observed in the Mg ii population, but any further intrinsic absorber component is undetectable in our clustering analysis. We also find an indication that absorption systems within 3,000 km/s are more abundant for radio-loud than for radio-quiet quasars. This suggests either that radio-loud objects live in more massive halos, or that their radio activity generates an additional low-velocity outflow, or both.
Keywords:
galaxies:active, quasars:absorption lines; accretion, accretion discs; large-scale structure of Universe1 Introduction
Intervening absorption lines in QSO spectra provide a wealth of information on the gaseous Universe from high redshift to the present day. They also allow us to probe the metallicity and ionisation state of the gas in environments ranging from voids to galaxy halos and disks. QSO absorption line systems (QSOALSs) are attributed to two main sources: (i) material associated with the host galaxy of the QSO : either in radiatively driven winds close to the accretion disk around the black hole or in outflowing material in the host galaxy and its surroundings ; (ii) intervening galaxies along the line-of-sight.
QSOALSs are usually split into three classes: (i) systems within a few thousand km/s of the QSO systemic redshift, termed “associated” systems; (ii) systems with velocity differences in the range of 10,000 to 60,000 km/s; (iii) systems beyond this velocity that are generally assumed to be spatially disconnected from the QSO. Additionally, QSOALSs are split into two different classes depending on their line width. Broad absorption lines (BALs) are unambiguously associated with outflowing material from the central region of the QSO; narrow absorption lines (NALs), with typical line widths of several hundred km/s, can be associated either with the QSO host or with intervening systems.
It is generally agreed that strong (rest equivalent width [EW]0.3Å) metal NALs located at large velocity separations from the QSO probe diffuse gas in the halos (and possibly disks) of ordinary galaxies (e.g. ???). The currently favoured model postulates the existence of small (of order 1-10 kpc diameter) clouds distributed throughout a galaxy’s dark matter halo (see e.g. ?). The best studied transition is that of Mg ii. The imaging studies of ?) suggested that Mg ii extends out to a radius of 40 kpc in galaxy halos. Recent results show that Mg ii absorbing gas extends to distances greater than 100 kpc, but with lower covering fraction (???).
The picture becomes much more complicated as we look closer towards the QSO in velocity space. A substantial body of work has focused on BALs, which cannot be associated with intervening galaxies, because they have line widths of at least 1000 km/s. Commonly reaching sub-relativistic velocities of up to 30,000 km/s BALs are unambiguously associated with AGN-driven outflowing gas (e.g. ?????).
Many NALs are known to be caused by ordinary galaxies, and therefore any additional population associated with the QSO must be studied statistically. In general, one looks for an excess of NALs relative to the background density in the vicinity of the QSO. Because galaxies are clustered, however, one expects an excess of NALs due to galaxies surrounding the QSO. This excess is expected to extend out to distances of a few galaxy correlation lengths ( Mpc, or velocity separations of 3000 km/s). QSO absorbers at velocity separations less than this nominal value of km/s are termed associated absorption lines (AALs).
Some authors have dealt with the clustered component by restricting their analysis to velocity differences that are larger than this value. For example, ?) and ?) report an excess of narrow C iv absorbers with velocities 5000 km/s in radio quiet QSOs as compared to flat-spectrum radio-loud QSOs. Other studies have attempted to gain insight into the physical nature of AALs in order to ascertain whether or not a proportion of these systems may be associated with the QSO. Based on line diagnostics and time variability arguments, ?) and ??) conclude that some AALs lie in the QSO host galaxy itself. Lower ionisation AALs probably lie at greater distances from the QSO (?). ?) find that associated Mg ii absorbers have higher ionisation than intervening systems, clearly showing that ionising radiation from the QSO can affect the state of the surrounding gas. The fraction of AALs in steep- and flat-spectrum radio-loud, and radio-quiet QSOs, may also provide clues to the origin of the AALs (??????). However, the number of radio-loud QSOs studied thus far has been quite small and the results obtained have been inconclusive.
There have been many studies of the clustering of NALs around small samples of QSOs. These studies have yielded conflicting results and conclusions (?????). Recent studies with larger QSO catalogues have generally found that there is an excess NAL population closely associated with the QSO (??), but there is still ambiguity as to whether this population arises from neighbouring galaxies or from gas associated with the QSO, its host galaxy and its halo.
The nature of both AALs and higher velocity associated absorbers has potentially important implications for understanding feedback processes in QSOs. Feedback is a key ingredient in modern day galaxy evolution models, invoked to explain observations as diverse as the shape of the galaxy luminosity function, the apparent bimodality in the colour distributions of galaxies, the entropy of the intracluster gas, and the tight correlation between black hole and galaxy bulge mass (e.g. ??). The basic principle is that a large source of energy, originating from either an intense burst of star formation or an Active Galactic Nucleus (AGN), causes the expulsion of gas from the galaxy. This feedback halts star formation and heats the surrounding intergalactic medium (IGM).
A few studies of both low- and high-redshift radio galaxies have yielded direct observational evidence for significant (in terms of total energy and mass) AGN-driven outflows (?????), but such systems are very rare. BALs are observed in 15-20% of all QSOs (????), but these are best understood in terms of winds produced in the immediate vicinity of the black hole (??). The impact of such winds on the intergalactic medium of the galaxy is not well understood (?).
Associated narrow absorption lines are tantalizing, because they may be the signature of galaxy-wide feedback (?). However, in order to reveal the true outflow signal, the contribution from galaxies clustered around the QSO must first be subtracted. This can be done if one is able to compute the cross-correlation between QSOs and absorbers on neighbouring lines-of-sight, since such correlations cannot be due to processes occuring within the QSO or its host galaxy. ?) cross-correlated QSOs and metal absorption systems detected in the 2QZ QSO survey. They detected a marginally significant positive correlation on scales of 10 Mpc. ?) used 17 Lyman Limit absorption systems with transverse separations from the QSO of less than 6 Mpc to measure the clustering of optically thick neutral hydrogen around QSOs. Their inferred clustering amplitude implied a 15-50% underdensity of line-of-sight absorption systems, likely caused by photoevaporation of absorbers by the ionising flux of the QSO.
In this paper, we study the clustering properties of a sample of 6456 C iv systems and 16137 Mg ii systems drawn from the SDSS Data Release 3 (DR3) QSO catalogue. Our aim is to recover the fraction of AALs that are truly intrinsic to the QSOs. We perform a 3 dimensional QSO-absorber cross-correlation analysis to measure the contribution to the observed NALs from galaxies clustered around the QSOs. We compare and contrast our results for Mg ii and C iv absorber samples. These ions have very different ionisation energies, 15.03eV and 64.5eV respectively, and thus provide information on the physical state of the gas around QSOs. In Section 3 we describe the absorber selection and the basic properties of our samples. Section 4 presents the line-of-sight correlation between absorbers and QSOs in redshift space. In Section 5 we estimate the large scale Mg ii-QSO and C iv-QSO correlations. In Section 6 these 3-D correlations are used to estimate the excess number of absorbers along the QSO line-of-sight due to clustering. The main results are presented in Section 7, including the difference in NAL distributions for radio-loud and radio-quiet QSOs. We conclude and summarise in Sections 8 and 9.
Throughout the paper we assume a flat cosmology with , , . Unless otherwise stated distances are given in comoving units assuming .
2 The Sloan Digital Sky Survey
The SDSS (?) is using a CCD camera (?) on a 2.5-m telescope (?) at Apache Point observatory to perform a 5-band (?) photometric and spectroscopic survey of the high Galactic latitude sky. Photometric calibration is provided by simultaneous observations with a 20-inch telescope at the same site (see ????). The survey data-processing software measures the properties of each detected object in the imaging data, and determines and applies photometric calibrations (??). The spectroscopic survey provides medium resolution (R2000) spectra with a wavelength coverage from 3800 to 9200Å; details can be found in ?) and ?). Spectroscopic targets chosen by the various SDSS selection algorithms are arranged onto a series of 3” diameter circular fields (?). QSO targets are selected on colour and band point spread function (PSF) magnitude; for details see ?) and ?). QSO redshifts are predominantly derived from a fit to the QSO template of ?).
The third data release (DR3) of the spectroscopic survey covers 3732 sq. degrees (?). The DR3 QSO catalogue (?) provides a more complete sample of QSOs than the SDSS standard pipeline and corrects the redshifts of a small number of objects.
3 The absorption line samples
The absorption line samples used in this paper are based on the absorption line catalogue described by York et al. (2006) and York et al. (2008, in preparation). The catalogue contains a list of narrow (700 km s-1) absorption features detected in QSO spectra drawn from the SDSS DR3 QSO catalogue (?). Independent searches are carried out for both the C iv and Mg ii doublets, and the equivalent width (in the QSO frame) and significance of individual line detections are catalogued. We select C iv absorbers with equivalent width of the strongest line in the doublet, , greater than 0.3Å. We apply the same equivalent width cut to the Mg ii doublet.
In this paper, we retain only those systems with detection significance for the primary line, and for the secondary line. In each sample, duplicate entries are also removed. These arise because the master catalogue contains the result of independent searches for Mg ii, C iv, and Fe ii. We remove duplicates with exactly the same , , and line equivalent widths (EWs). If there are two absorbers with redshifts within 0.005 of each other (corresponding to of 7.7Å for C iv and 14Å for Mg ii), the strongest system is retained.
The absorber sample is then cross-matched with the SDSS DR3 specobj view in order to obtain a well-defined QSO sample with photometric and spectroscopic measurements. The FIRST radio survey fluxes are extracted from the DR3 QSO catalogue (?). This gives a total of 15416 and 24406 C iv and Mg ii absorption systems.
Finally, the SNR of the QSO spectra must be sufficient to allow lines above a certain equivalent width to be detected throughout their wavelength coverage, otherwise we may introduce artifacts into our correlation functions. Monte Carlo techniques could in principle be employed to simulate the full selection function of an absorption line search. However, with the large number of absorbers and QSOs available to us from the SDSS we can afford to make stringent cuts to ensure a (roughly) uniformly selected sample.
We therefore remove absorbers which fall below 4000Å or above 9000Å observed frame wavelength to avoid the noisiest regions of the SDSS spectra. Figure 1 shows the -band SNR of the QSO spectra vs. EW of the C iv absorption lines (computed in the absorber rest-frame). There is a sharp rise in the median and mean SNR of the spectrum as the EW of the absorber drops below 1Å: i.e. weak absorbers are preferentially found in high SNR spectra. Cutting at per-pixel-SNR (where a pixel covers 69 km/s in velocity space) and EWÅ gives roughly constant mean and median SNR as a function of absorber EW (red and green lines). We therefore adopt these cuts, reducing our sample to 7393 C iv and 16173 Mg iiabsorbers.
We have chosen not to eliminate BALQSOs from our sample, as has been done in most previous studies. Our reason for retaining them is that a BALQSO can also show narrow absorption at a different velocity to the broad absorption. As the physical process responsible for the presence of a BAL is not well understood, we do not wish to bias the NAL sample by removing QSOs with BALs from our sample entirely. Unfortunately the absorption line catalogue suffers from a large number of “false positive” line identifications in the regions of the BAL troughs. BAL troughs are more often observed in C iv than in Mg ii so we visually inspected all C iv absorber candidates to eliminate false positive detections, leaving us with 6456 C iv absorbers. There is a continuum of line widths from NALs through to BALs; the criteria imposed during this visual inspection were that the lines had velocity widths smaller than 700 km/s and both members of the doublet were clearly identifiable as an individual system in velocity space, rather than being part of broader velocity structures. Except for the most saturated cases, the two lines of the doublet are clearly distinguishable using this velocity width limit. As we do not determine the completeness of our absorber sample for every QSO spectrum, the inclusion of the BALs will cause us to underestimate number densities slightly where the flux in the BAL troughs reaches zero. However, the fraction of BALQSOs is around 10-15% (??) and their typical line widths are one to a few thousand km/s. Thus, the fraction of the total pathlength lost due to BAL troughs is small.
For the larger Mg ii sample, only absorbers within of the background QSO were inspected, and only false positive identifications caused by BAL troughs and poor continuum fits around the QSO emission lines were removed. This procedure leaves 16137 Mg ii absorbers. In fact, the majority of false positive line identifications in the Mg ii sample are caused by OH skylines (see ?).
Our samples of C iv and Mg ii absorbers have mean redshifts of 2.08 and 1.17 respectively. Figure 2 shows the observed redshift distribution of the C iv and Mg ii samples, before and after the SNR and EW cuts are made. The cuts do not appear to significantly bias the redshift distributions.


4 Line-of-sight distribution of QSO-absorber separations
To get a first impression of the quality of our data, Figure 3 shows the number density of C iv and Mg ii absorption line systems as a function of comoving distance () from the background QSO. In both cases, the distributions have been corrected for the fact that the pathlength available to find an absorber decreases as comoving distance increases. The general form of these distributions is robust to even significant changes in the sample. Here, we choose to present line-of-sight distributions in comoving distance rather than the more commonly used velocity parameter , as we aim to quantify the distribution of absorbers caused by galaxy clustering. We will return to the distributions in Section 7.
We note that there are clear similarities between the line-of-sight distributions of the Mg ii and C iv absorber samples. After correction for survey completeness, both show a near constant absorber density at large distances from the QSO, as we would expect for an intervening absorber population. They also both display a very pronounced enhancement in the fraction of absorbers within 25-50 Mpc from the QSO. The C iv absorbers in addition show an enhanced number of absorbers out to 150 Mpc from the QSO. A similar, although much smaller enhancement may be present out to 75 Mpc in the Mg ii absorbers.
As will be described more fully in the following sections, the observed distributions may be interpreted as the superposition of (i) a narrow spike at Mpc due, in part at least, to galaxy clustering; (ii) a tail to high velocities caused by sub-relativistic, moderately ionised outflows driven by the QSO (seen primarily in the C iv distribution ); (iii) a constant background level of intervening absorbers.
Finally, it has been claimed that systematic uncertainties in the estimated redshifts of the higher redshift QSOs in our sample could potentially lead to false conclusions being drawn about the nature of the associated absorbers (?). The full effect of such systematic line shifts on the SDSS redshifts derived by fitting a QSO template to the SDSS spectra is complex. A detailed analysis of the full redshift-dependent systematic shifts will be presented in Hewett & Wild (2008, in preparation). A preliminary analysis comparing the line-derived redshifts to the quoted SDSS redshifts leads us to shift QSOs with redwards by 200 km/s and QSOs with redwards by 415 km/s. Although shifts of this order of magnitude appear warranted by the present dataset, the precise values used make only small differences to our final results, and are likely to be refined by future work. The dotted histogram in Figure 3 shows the line-of-sight NAL distribution before correcting the QSO redshifts for this bias, while the solid histogram shows the corrected distribution. The difference is very small.


5 3-D correlation of absorbers and QSOs
In this section we cross-correlate the absorbers with QSOs on neighbouring lines-of-sight, in order to estimate the contribution to the line-of-sight absorber distribution from galaxies clustered around the QSO hosts.
It is generally believed that QSOs reside in galaxies (e.g. ??). Strong metal absorbers also arise primarily in ordinary galaxy halos and disks (????). Because galaxies are clustered, we expect to see some enhancement in the number of absorbers close to the QSO. With the high density of QSOs available in the SDSS survey, one can estimate this enhancement by counting the number of absorbers along lines-of-sight that pass close to each QSO.
The standard measures of galaxy clustering are the 2-point auto- and cross-correlation functions. These are typically well approximated by power laws:
| (1) |
where and Mpc for bright galaxies at low redshifts (?). The ratio of the number density of pairs separated by distance to that expected for a random and uniform distribution of objects with the same number density is . In this section, we estimate , the QSO-absorber cross-correlation function. 11 1 We note that in reality we measure the redshift-space cross-correlation function. We do not attempt to correct for redshift space distortions: our approach is conservative because on small scales, Mpc, non-linear -space distortions will act to reduce the observed clustering amplitude in a similar way to the effect of errors on the QSO redshifts. On larger scales, the effect of linear -space distortions on the correlation function is small at the redshifts of interest here (see e.g. ?, for a detailed discussion)..
5.1 3-D correlation estimation
The basic principle of our estimation method is to compute the excess number of QSO-absorber pairs relative to an unclustered sample, as a function of comoving separation. The number of QSO-absorber pairs expected for a uniformly distributed sample is determined by computing the number of absorbers expected at random along the actual sightlines used to find the observed pairs. In this way, we automatically account for selection biases such as those caused by fibre collisions in the SDSS survey. Our final measurement yields the excess number of absorbers as a function of comoving distance from a QSO. We can then use this measurement to ascertain whether the excess seen along the line-of-sight is consistent with galaxy clustering alone, or whether some component of the excess is intrinsic to the QSO itself. The scheme is presented pictorially in Figure 4, to which we will refer throughout this Section.
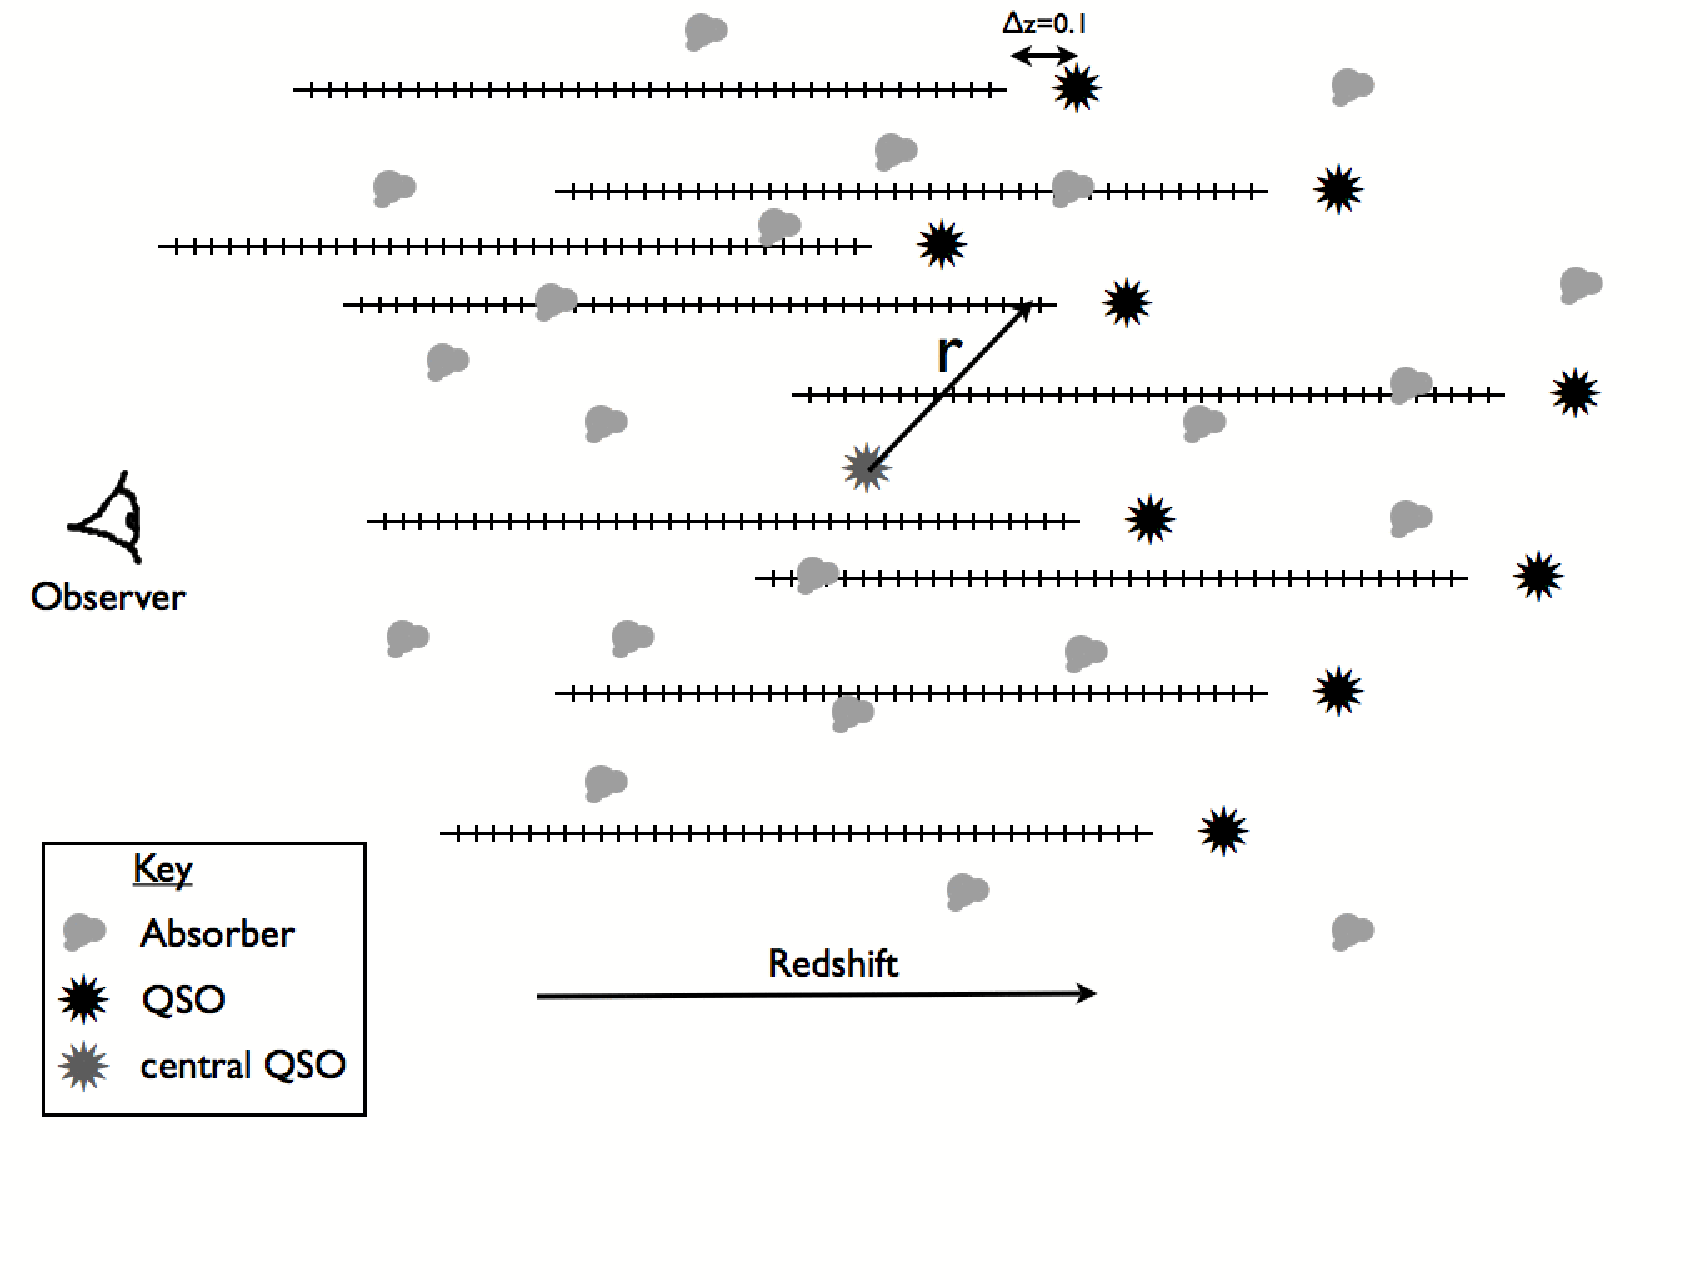
First we build our QSO-QSO pair catalogue. For each QSO in the DR3 QSO catalogue, the SDSS Catalogue Archive Searcher (CAS) is used to find all QSOs at higher redshift and within 3 degrees of it on the sky. We cross-match the DR3 QSO catalogue with the specobj view of the CAS in order to ensure a unique sample of QSOs from main SDSS survey plates. The DR3 QSO catalogue contains 45,988 QSOs; this results in 6.5 million pairs above a redshift of 0.3. Only 10823 DR3 QSOs have SNR above the threshold (8 per pixel), and so that C iv can be seen above a restframe wavelength of 4000Å. This reduces the number of QSO-QSO pairs drastically for the C iv analysis compared to the Mg ii analysis. QSOs below the SNR threshold are retained only as central QSOs (see Figure 4) in the correlation analysis, i.e., the sightlines provided by their spectra are not included in the absorption system search or in the control absorber counts.
Next, we select the sightlines which we will use in the analysis. We only consider sightlines from QSOs above the SNR threshold. As indicated in Figure 4 we restrict the sightlines to start at from their QSO host, and to lie redwards of 1250Å in the QSO rest frame (to avoid the strong Lyman- line at 1215Å and the Lyman- forest bluewards of Lyman-). The velocity difference criterion ensures that the final signal is not affected by the excess of associated absorbers with sub-relativistic velocities described in Section 4. Because of the restriction that sightlines must end at 1250Å we cannot increase this limit much further without drastically reducing the number of QSO- C iv absorber pairs. Contained within these sightlines are 3374 C iv and 13504 Mg ii absorbers.
Using these sightlines and absorbers, we calculate the number density of absorbers as a function of redshift () shown in Figure 5, and use this to estimate the expected number of absorbers in each bin along each sightline. Then, for each central QSO we use the sightlines of all its paired QSOs to measure the expected and observed number of absorbers as a function of comoving separation between the central QSO and the position along the sightline22 2 In a flat universe, the comoving distance between two objects is given by the square root of the sum of the squares of the angular and line-of-sight comoving distances.. In Figure 4 the arrow, labelled , indicates the comoving distance between the central QSO and one of the bins along one of the sightlines. In this bin, no absorber is found so no addition is made to the observed number of absorbers at this comoving separation. However, a small addition will be made to the expected number of absorbers at this separation, based on the pre-calculated () at the redshift of this bin. As well as accruing the observed and expected numbers of absorbers as a function of comoving separation, we sum the number of contributing sight lines, which is necessary in the estimation of the errors. Finally, because we must bin our results in , and we do not have enough sightlines to create infinitesimal bins, we must account for the fact that more sightlines within a range will lie towards the outer edge of the range than the inner edge i.e. the effective radius of our bin is not centered on to the bin, but biased towards the outer edge. We do this by accumulating the expected number of absorbers, weighted by (see Equation 3).
The final 3-D correlation estimate is given by:
| (2) |
where is the observed number of absorbers in a bin with effective radius , and is the expected number as described above. The effective radius of each of the bins is estimated to be:
| (3) |
where the sum is over all bins (segments of the sightlines in Figure 4) that contribute to the bin. is chosen to be 1.7, which is close to the measured exponent in the Mg ii-QSO correlation (see below), although the precise value used does not change the results significantly.
On small scales the QSO-absorber pairs in each bin are independent (in general, absorbers are only paired to one QSO on small scales), thus the error is estimated assuming Poisson statistics:
| (4) |
On larger scales the pairs in each bin are no longer independent (one absorber can be paired with many QSOs in the same bin) and the Poisson errors underestimate the true errors. Following ?), as the number of pairs approaches the number of absorbers in the analysis (Nabs), the errors are approximated by:
| (5) |
Finally, we calculate the significance of a positive clustering signal (excess number of pairs) assuming a Poisson distribution. Assuming no clustering, the probability of observing No or more pairs at any given is given by:
| (6) |
In the closest bins with fewest observed pairs, we checked that the probabilties derived here agree with those derived from a Binomial distribution.


5.2 Clustering detection
The correlation functions for C iv and Mg ii absorber-QSO pairs are shown in Figure 6, where we plot () in bins of Mpc. The results are plotted logarithmically in the right hand panels. As expected, there is an enhancement in the counts of both QSO-C iv pairs and QSO-Mg ii pairs at small comoving distances from the QSO. The significance of the detection is considerably higher for the Mg ii absorbers, because the sample is much larger. Overplotted as a dashed line is the 68% confidence limit for detection of a clustering signal, given the observed and expected number of absorbers in each bin (Eq. 6). In other words, if there were no clustering, we would expect an independent bin to lie above this line 32% of the time.
We can evaluate the amplitude and significance of the clustering signal for the C iv systems as follows. The total fractional excess33 3 Fractional excess is defined as (No-Ne)/N. of C iv absorber-QSO pairs between 6 and 43 Mpc (bins 2–6) is 1.49. From Eq. 6, the probability of obtaining a value greater than or equal to this value is 0.006 i.e. we detect excess clustering at a 99.4% confidence level. If we instead use only the second to fifth bins, we obtain a similar confidence level of 99.7%. Including the first bin results in a similar significance detection, but a lower clustering amplitude. We have chosen to discard this first bin, which only contains one pair, because of the uncertainty in the QSO redshifts for this sample. Redshift errors will act to move clustered QSO-absorber pairs to outer bins, and cause a flattening in the correlation function at small distances. Our choice to discard the first bin results in a small overestimation of the clustering amplitude, as some QSO-absorber pairs from the central bin will be counted in outer bins. The number of QSO-absorber pairs expected at these small radii is very low, however, and their contribution to the derived clustering amplitude is not significant within the final errors.
For the Mg ii absorber sample, the fractional excess within 43 Mpc is 4.0 and the detection of clustering is significant at the 99.9999% level.
These fractional excess numbers of QSO-absorber pairs (1.49 for C iv and 4.0 for Mg ii) can be fit to the standard power law form used to describe the correlation function, (Equation 2). To be consistent with typical values quoted in the literature, we calculate for a fixed . We find and Mpc for the C iv and Mg ii absorbers respectively. These fitted power laws are overplotted in Fig. 6. For the Mg ii absorbers we can also fit the correlation function to all bins directly, leaving as a free parameter. We use a non-linear least squares technique to obtain and Mpc. The resulting model has a reduced of 1.007. The curve is overplotted as a blue dotted line in Fig. 6. In conclusion, in this section we have unambiguously detected and measured the excess of absorbers in the vicinity of QSOs due to the clustering of galaxies.


6 A model for line-of-sight NALs
In this section, we model the line-of-sight correlation of QSO-absorber pairs and we address two questions: (i) is the central spike at consistent with being caused by galaxy clustering? (ii) can the sub-relativistic tail of C iv absorbers be caused by galaxy clustering?
We proceed by constructing a model with three components: (i) the amplitude of the clustering of absorption line systems arising from galaxies in the vicinity of the QSOs; (ii) the velocity offset and dispersion induced by peculiar motions and redshift errors; (iii) the distance to which the QSO ionises surrounding gas.
Motivated by the results presented in the previous section, we construct a simple toy model of the form:
| (7) |
where is the mean number of absorbers per comoving Mpc at comoving distance from the QSO, is the comoving number density of intervening absorbers, is the comoving radius out to which the QSO photoevaporates the absorbers (the “proximity” zone), and is the correlation length of QSO-absorber clustering. The model is convolved with a Gaussian of width to reproduce the effects of the departure of the QSOs and absorbers from the Hubble flow, as well as errors on the redshift measurements of the QSOs.
Of the four parameters, is measured from the 3-D correlation estimate (Section 5) and is measured at distances greater than 200 Mpc from the QSOs. There are two remaining parameters: and . We will discuss plausible values for these parameters in the following subsections. Our model is no doubt a simplification of the true situation. For example, we do not explictly account for a contribution from the halo clouds around the QSO, assuming only a continuation of the powerlaw component towards the QSO. In Section 7 we will discuss the limitations of the model.
6.1 Velocity dispersion
There are two contributions to the dispersion : redshift errors on the QSO and, assuming the QSOs and absorbers originate in different galaxies, peculiar motions of the absorbers and QSO host galaxies with respect to the Hubble flow.
The SDSS catalogue provides errors on the redshifts of each QSO. The median quoted error of all the QSOs with absorption line systems are 0.0017 for the Mg ii absorber sample and 0.0019 for the C iv absorber sample. This corresponds to velocity errors of 180 km/s for both samples at the median QSO redshifts (1.89 and 2.19 for the Mg ii and C iv samples). However, given the observed systematic shifting of broad QSO lines from the systemic redshift (e.g. ??), the true errors are likely to be considerably larger, particularly for the higher redshift C iv sample. As shown by ?) C iv is shifted by a median 800 km/s from the lower ionisation Mg ii line. The shift can be as much as 3000 km/s in some QSOs. The position of the C iv line is used in the template to derive the systemic redshift of the SDSS QSOs and we may therefore expect this shifting of the lines to cause errors of up to 1000 km/s.
The second contribution to the dispersion comes from the peculiar motions of galaxies with respect to the Hubble flow, if the absorber and the QSO reside in different hosts. The pairwise velocity dispersion of galaxies () has been measured at low redshift in the 2dFGRS and SDSS surveys (??). It can range from a few hundred to nearly a thousand km/s, depending on the type of galaxy (?). However, the redshift evolution of has not been measured, making it difficult to predict the velocity dispersion experienced by galaxies in the relatively massive haloes of the QSOs.
As neither the redshift errors nor the expected peculiar velocities of the galaxies are well known, we choose to estimate directly from the data, by ensuring that our models reproduce the observed width of the central peak in the comoving separation distribution (Figure 3). The derived scatter in comoving distance is 9.0 Mpc for the Mg ii absorber sample and 12.2 Mpc for the C iv absorber sample. This corresponds to velocity dispersions of 580 km/s and 1030 km/s at the median redshifts of the Mg ii and C iv absorbers in the central peak of the comoving separation distribution (1.35 and 1.97, see Section 7).
It is important to note that the precise value chosen for does not greatly affect our results; it only slightly alters the shape of the central peak in the distribution of absorbers in velocity space.
6.2 The line-of-sight proximity effect
Two further physical scales are important for the geometry of line-of-sight QSO-absorber clustering. The first is the distance to which the gaseous halo of the QSO itself can contribute to the number of pairs. The second is the distance out to which the intense radiation field of the QSO eliminates the particular ion in question. Here we simply present some typical scales culled from the literature to guide in the interpretation of our results, is left as a free parameter in our model.
As discussed in the introduction, halos of Mg ii around galaxies have been studied for many years. Their proper extent is believed to be 40 kpc for unity covering fraction (?). Beyond this distance absorbing clouds have been found out to proper radii of kpc, but with covering factors that decrease with distance (???). Fewer quantitative studies have been made for C iv, but ?) find C iv halos of kpc in proper radius, with unity covering factor. C iv and Mg ii are believed to originate in the same halo clouds, with the higher ionisation ion C iv almost always found in conjunction with Mg ii, but not the converse (???). The true extent of absorber clouds depends sensitively on the equivalent width limit imposed, also possibly on the mass of the host halo (??) and it is likely that it changes with redshift. We therefore take these nominal values for convenience, but the reader should keep in mind that they are only indicative.
The effect of the ionising field of the QSO on the surrounding inter-galactic medium is less well constrained observationally (see e.g. ?). ?) have used observational constraints from Mg ii absorbers to model the effect using the ionisation code CLOUDY (?). Assuming a uniform radiation field and a cloud density , they conclude that Mg ii will be completely destroyed in the inner 100 kpc of the halo and that the density of Mg ii absorbers will only recover to the background level on Mpc scales. They also predict that the fraction of C iv systems will fall off rapidly below 200 kpc. If the QSO radiation field is anisotropic, the line-of-sight ionisation boundary must move further out to remain consistent with observation. ?) also present a simple model of the proximity effect for Lyman-limit systems. As Mg ii systems are found to correspond closely to Lyman-limit systems (??), these results are relevant to our Mg ii sample. They find absorbers with neutral hydrogen column densities below atoms/cm2 and hydrogen volume densities below to be photo-evaporated within 1 Mpc of the QSO.
7 Results
In Table 1 we present the fraction of the QSOs in our sample that have absorbers with (associated) and with (distant). 3.4% (15%) of QSOs in our samples have one or more associated Mg ii (C iv) absorbers with rest equivalent width Å. We note that these samples are at different mean redshifts, and therefore the comparison of the fractions must be treated with caution. ?) find 25% of QSOs to have C iv with the same EW limit within 5000 km/s. We find 18% within this higher velocity limit, which is consistent given the small number of objects in the ?) sample. Given the fact that Mg ii and C iv are almost always seen if a QSO sightline passes close to a galaxy, these results indicate that the QSO must ionise most of the Mg ii and C iv clouds in its own halo.
In this section it is often necessary to convert between physical and comoving scales. As we are primarily interested in describing the central peak of the comoving separation distribution, we use the median redshift of those QSOs contributing to the peak. These are 1.35 and 1.97 for the Mg ii and C iv samples respectively.
| velocity | FMgII(all) | FMgII(RQ) | FMgII(RL) | FCIV(all) | FCIV(RQ) | FCIV(RL) |
|---|---|---|---|---|---|---|
| 0.034 | 0.036 | 0.054 | 0.15 | 0.14 | 0.16 | |
| 0.044 | 0.051 | 0.055 | 0.11 | 0.11 | 0.12 |
7.1 The excess
We now compare the line-of-sight distributions of the NALs with the prediction of our model for the component due to galaxy clustering. We first assume that the QSO ionises clouds only in its own halo, i.e. we set in Equation 7. We take to be the comoving size of absorber halos at the median redshifts given above assuming typical sizes from the literature, i.e. 130 and 420 kpc for the Mg ii and C iv samples respectively. The predicted line-of-sight absorber distributions are shown in Figure 7. There are two clear results, each with an obvious implication. Firstly, galaxy clustering only contributes to the central Mpc of the distribution. We therefore conclude that the tail of high-velocity absorbers seen in the C iv distribution must be intrinsic to the QSO and/or its host galaxy. Secondly, the model greatly overpredicts the number of Mg ii absorbers, leading us to conclude that the QSOs ionise Mg ii clouds well beyond the halo of the host galaxy. The model overpredicts the Mg ii counts within 40 Mpc of the QSO (corresponding to 2500 km/s) by a factor of 2.05.


By increasing the size of the region over which the QSO ionises Mg ii (), our simple model can reproduce the observed distribution of Mg ii absorbers reasonably well (albeit with a small offset that we will address below). Figure 8 shows the line-of-sight distribution of Mg ii and C iv absorbers within 200 Mpc from the QSO. Overplotted in the right hand panel is a model with Mpc (close to the size of the proximity zone for Lyman-limit systems derived by Hennawi & Prochaska [2007]).
Although our model with a large proximity zone appears to fit the Mg ii data rather well, we note that our simple ”top-hat” exclusion zone is no doubt an over-simplification. Some Mg ii absorbing clouds probably do exist within 0.8 Mpc of the QSO. Such systems may be associated with material within QSO host galaxies. Vanden Berk et al (2008) have shown that such associated Mg ii systems tend to be on average dustier (implying denser gas) and be more highly ionised (as would be expected for clouds within ). By increasing the radius out to which Mg ii halo clouds of average volume density are evaporated, our model would allow for an increasing fraction of the associated absorbers to be directly linked to the presence of the QSO and its host galaxy. We will return to this point in Section 7.2.
Unlike the Mg ii systems, the C iv absorber distribution does not require a large proximity zone. Figure 7 shows that if the QSO photoevaporates all C iv clouds in its own halo, the number of absorbers within 40 Mpc is underpredicted by more than a factor of two. We can try to fit the distribution by decreasing ; the model over-plotted as a dotted line in the left-hand panel of Figure 8 has Mpc, corresponding to a proper radius of 60 kpc at the median redshift of the QSOs. This radius is smaller than the estimated, but uncertain, C iv halo size discussed in Section 4. We note that such a small proximity radius may conflict with the small fraction of QSOs observed to have associated C iv absorption (16%). We will return to this point in the following sections.
The main conclusions of this section as follows:
- 1.
the central peak of the Mg ii absorber distribution could be explained by galaxy clustering if the QSO ionises absorbers to Mpc. Assuming the physical size of Mg ii halos remains the same as observed at low redshift, this corresponds to more than 6 times the size of the QSOs own Mg ii halo, implying that absorbers in the halos of neighbouring galaxies along the line-of-sight are also affected.
- 2.
The ionising sphere must be substantially larger for the Mg ii absorption line systems than for the C iv absorption line systems, consistent with the higher ionisation energy of the latter ion.
- 3.
The C iv systems exhibit a high velocity tail of absorbers, which cannot be explained by galaxy clustering and hence must be intrinsic. It is likely that these intrinsic absorbers also contribute to the distribution at lower velocities.
In the following subsection we will further investigate the distribution of these intrinsic absorbers.


7.2 The high velocity C iv absorbers
From Figure 8 it is clear that many narrow C iv absorbers are in a high velocity tail that extends out to 150 Mpc before becoming indistinguishable from the background absorber population. This tail cannot be due to galaxy clustering, and we conclude that these absorbers are truly intrinsic to the QSO.
In Figure 9 we present a simple model for the velocity distribution of the absorbers. We have fit an exponential to the high-velocity component:
| (8) |
where
| (9) |
| (10) |
and . The model is fit in the range to avoid the central clustering peak.
Our model predicts that between 3000 and 12000 km/s (), 45% of C iv absorbers are caused by sub-relativistic outflowing material from the QSO. Due to the presence of the clustering component, we cannot constrain the shape of this intrinsic component at low-velocities. While it seems unlikely that the number of intrinsic absorbers drops sharply towards low velocities, various processes may act to enhance their number (see Section 7.3). Our derived fraction of 45% intrinsic absorbers may thus be an underestimate.
Along similar lines, we note that a small excess of Mg ii absorbers with may be present in Figure 8. We have attempted to constrain the strength of this excess by fitting an exponential distribution with a width fixed to be that observed in the C iv absorbers. We obtain a height which is 205% that found for the C iv absorbers.


We now attempt to build a model to describe both the extrinsic and intrinsic C iv systems. We convert our modelled velocity distribution of outflowing material into a distribution in comoving distance by assuming that each QSO contributes an equal proportion of the high-velocity tail. For each absorber-QSO pair we transform the model velocity distribution into the distribution in comoving distance at the redshift of the QSO. We convolve the final distribution with a Gaussian to account for the QSO redshift errors and add this to the clustering model with different values of the parameter . The result with is shown in Figure 8 as the solid black line. The contribution from clustering is shown by the dashed red line. The model fits well and it implies that a substantial fraction of low-velocity C iv absorbers, with km/s, may also be part of a distribution of outflowing material that is intrinsic to the QSO and/or its host. This increased value for is now about 70% that of low redshift C iv halos. Together with the likelihood that varies with redshift, QSO luminosity and halo mass, the fact that only 16% of QSOs show associated absorption does not appear incompatible with our model.
In Table 2 we present the fraction of each component (background, galaxy clustering, intrinsic) present in our model in different velocity ranges for both Mg ii and C iv absorbers. The number of absorbers associated with intervening galaxies in our model is the sum of the background and galaxy clustering numbers. We note that the fractions of intrinsic absorbers presented here may be lower limits; we will return to discuss this in Section 8.
| velocity | FMgII(bg) | FMgII(gc) | FMgII(int) | FCIV(bg) | FCIV(gc) | FCIV(int) |
|---|---|---|---|---|---|---|
| 0.46 | 0.54 | 0.0 | 0.13 | 0.48 | 0.39 | |
| 0.99 | 0.01 | 0.0 | 0.53 | 0.01 | 0.45 |
7.3 Radio Loud and Radio Quiet QSOs
A key point of interest is whether the line-of-sight distribution of absorbers differs between radio-loud (RL) and radio-quiet (RQ) QSOs. The SDSS QSO catalogue has been matched with the FIRST radio survey (?). In this section we have included only those QSOs in the FIRST survey footprint. RL QSOs have been defined to be those with 1.4GHz luminosities greater than W/Hz (?). The FIRST radio survey is flux limited to 1 mJy, which corresponds to W/Hz at a redshift of 2, close to the mean redshift of the C iv absorbers. We therefore expect our RL sample to be complete in the Mg ii sample, but some RL QSOs in the C iv absorber sample will contaminate the RQ sample. As the fraction of RL QSOs is low, around 10% of all QSOs, this will not significantly bias the RQ distribution. In the Mg ii sample we have 1298 RL and 13179 RQ QSOs. In the C iv sample we find 543 RL and 5355 RQ QSOs.
It is known that a correlation exists between optical and radio luminosity (e.g. ??). We have therefore matched the optical luminosities of our RQ QSO sample to those of our RL QSO sample to avoid any biases. Optical luminosity is defined from the -band PSF magnitude, K-corrected to following ?). This matching procedure reduces the RQ samples to 8343 and 3528 for the C iv and Mg ii samples respectively. The velocity distributions are shown in Figure 10.
Comparing the RL and RQ samples, we see clear differences. A narrower and more pronounced spike at is seen for the RL QSOs for both C iv and Mg ii absorbers. This result for C iv has been presented for many fewer QSOs by ?). We also note that the subrelativistic tail of C iv absorbers is visible in both the RL and RQ samples, but is clearly more pronounced in the RQ QSOs. This high-velocity tail was observed previously in RQ QSOs by ?) and ?). We will discuss these results in more detail in Section 8.3.


8 Discussion
Associated absorption line systems account for a small fraction of all metal absorbers detected in spectroscopic QSO surveys; however, their study is important for understanding the effect of QSOs on their host galaxies and their local environment. In the following subsections we will address the implications of our results for understanding the nature of associated narrow absorbers and for absorption line systems in general.
8.1 Intrinsic outflowing gas
The primary aim of our paper is to quantify whether some narrow absorption line systems are intrinsic to the QSO and its host galaxy. From our analysis alone, there is clear evidence that a high fraction of C iv absorbers are intrinsic to the QSO. 45% of C iv systems with velocities in the range are intrinsic and are well described by an exponential velocity distribution. A similar, but considerably smaller fraction of high-velocity Mg ii absorbers are attributable to the QSO. The high-velocity Mg ii tail is 205% the height of that observed in C iv. Starburst-driven winds do not reach such high velocities; it is therefore clear that these absorption line systems are a direct consequence of a QSO induced outflow (see compilation in Figure 2 of ?).
The physical radius at which the intrinsic C iv NALs originate cannot be constrained from these results alone. It is possible that they originate from the wind close to the accretion disk of the central AGN itself, although it may be difficult to understand the narrowness of the lines under these circumstances. A key constraint is that narrow intrinsic absorbers are observed in both the RL and RQ QSOs, contrary to BALs, the incidenc of which decreases sharply as radio power increases (???). One possible explanation is that the strong X-ray flux observed in RL QSOs limits the self-shielding of the winds and thus the widths of the absorption features (?). In this scenario NALs are simply failed BALs. Alternatively, NALs may be due to the viewing angle of the accretion driven wind (?); the high velocities observed in this work will allow tight constraints to be placed on the wind geometry.
It is also possible that some of these absorbers, particularly those with lower velocities, may not be directly associated with the accretion disk winds, but originate further out in the ISM of the galaxy. The QSO spectra contain significantly more information than we have used in the current paper: for example, it is possible to derive their dust content and ionisation states (see ?) and also to look for fine structure lines and line variability in multi-epoch observations. Stacking the spectra as a function of velocity distance from the QSO will increase the signal-to-noise of the weaker lines needed to obtain accurate column densities (??). All of this information should enable us to constrain more precisely the physical origin of the C iv outflows, just as it has allowed ?) to suggest an origin for some associated Mg ii systems in the gas of the QSO host galaxy.
8.2 The proximity effect of the QSO
Our results show that the QSO has a considerable impact on NALs along the line-of-sight, ionising ordinary Mg ii halo clouds well beyond the expected Mg ii halo size of the QSO host galaxy. The QSO also destroys a considerable fraction of the C iv clouds within the host halo. Our model based on galaxy clustering overpredicts the number of Mg ii absorbers within 40 Mpc of the QSO by a factor of two. This is somewhat less than the factor of 4-20 estimated by ?), who studied the distribution of 17 Lyman-limit systems around QSOs.
The effective radius of the first bin in our 3 dimensional Mg ii absorber-QSO cross- correlation analysis is 4.2 Mpc. Our results can thus test whether there is a “transverse proximity effect” on this scale (e.g. ?). We fit the Mg ii correlation function (Equation 1), this time excluding the central bin. The resulting power-law predicts 38 pairs in the central bin, compared to the 34 we actually observe. Thus, we find no evidence for a deficit of Mg ii absorber-QSO pairs at this radius. This is in agreement with the results of ?), ?) and (?), who find no transverse proximity effect for Mg ii, Lyman Limit systems, or for metal-line systems in general.
8.3 Radio loud vs. Radio quiet
Unfortunately our sample of RL QSOs is too small to allow us to measure the 3D correlation function of RLQSO-absorber pairs, so we can not assess the origin of the larger excess of low-velocity absorbers in RL QSOs, visible in both the Mg ii and C iv distributions.
There are several possible explanations for the excess number of low-velocity absorbers seen in the RL QSOs:
- •
the radio jets themselves drive low-velocity, lower ionisation or clumpier outflows,
- •
RLQSOs ionise their surrounding medium to smaller distances than RQQSOs,
- •
the RLQSOs are in denser environments than RQQSOs.
At low redshift, evidence points towards RLQSOs existing in denser environments than RQQSOs (e.g. ?), although these low- RLQSOs have lower luminosities than those in our sample. When compared to galaxies of the same mass, RLQSOs are preferentially found in galaxies at the center of groups and halos (?). ?) find that the local density of galaxies around RL-AGN is a factor of two higher than around RQ-AGN matched in velocity dispersion, redshift and stellar mass. All these results, combined with our excess of low-velocity absorbers in the RL QSOs, might suggest that RL QSOs exist in denser environments.
On the other hand, radio jets have been found to drive low-velocity (100 km/s) outflows of hydrogen (?). A similar conclusion has been reached for high-redshift radio galaxies by ?). Hydrodynamical simulations show how cool gas which may lead to absorption line systems can build up behind the bow shock of radio jets (e.g. ?). Such a scenario should be testable, as it would imply a clear relation between the presence of absorbers and the orientation of the jet.
8.4 Absorber and QSO halo masses
Our derived values of the cross-correlation lengths of QSOs with C iv and Mg ii systems ( and Mpc, respectively) are similar to the correlation lengths of the reddest and most massive galaxies at similar redshifts ( and respectively).
?) find values of 2.5 Mpc for blue galaxies and 4.8 Mpc for red galaxies at in the Vimos-VLT Deep Survey (VVDS). ?) find slightly higher values in the DEEP2 survey, 3.9 and 5.2 Mpc for blue and red galaxies at . ?) measure Mpc and at and for galaxies selected through the Lyman-break technique.
The auto-correlation for QSOs at similar redshifts is less well known: Mpc and (?); Mpc and on large scales (?, but see this paper for caveats on the measured shape of the quasar auto-correlation function).
Taking the geometric mean of the QSO and galaxy auto-correlation amplitudes assuming and Mpc gives Mpc, which matches our absorber-QSO cross correlation amplitudes44 4 The small difference in makes a negligible difference to this result.. Converting into the alternative measure of comoving clustering length , and following ?) results in QSO dark matter halo masses of M⊙ at and M⊙ at . C iv and Mg ii absorption line systems are then typically located in galaxies with dark matter halo masses of M⊙.
8.5 Caveats and Limitations
The primary limitation in the present analysis is the unknown density distribution of absorber clouds in the immediate vicinity of the QSO. Our toy model assumes a simple cut–off radius inside of which no absorbers can exist, and beyond which power-law clustering dominates. In a more realistic model, there might be variable cut–off radius () dependent on the density of the absorbing cloud. Such models are beyond the scope of the present analysis.
We note that a small offset remains between the line-of-sight distributions predicted by our model and the the observed one. The magnitude of the observed offset is around 200 km/s or 2.85 Mpc, and may be accounted for by the fact that galaxies in the vicinity of the QSO will have a net motion caused by infall into potential well of the QSO host halo. This will alter the observed shape and peak position of the absorber distribution. A full treatment of infall requires detailed cosmological simulations, and will be addressed in future work.
On the observational side, it is clear that a careful correction of the QSO redshifts for the effect of the blue-shifting of emission lines is warranted in order to constrain the detailed shape of the C iv absorber distribution. Follow-up observations in the near infra-red of the [O ii] and [O iii] emission lines in a relatively large sample of high- QSOs would provide a very useful basis for measuring these effects. The increase in number of QSOs from SDSS DR3 to SDSS DR7 will also further enable us to constrain the precise shape of the velocity distribution, and the fraction of dense absorbers which survive the ionising radiation of the QSO.
9 Summary
We have used a cross-correlation analysis of QSO-absorber pairs to measure the strength of narrow absorber clustering around QSOs. A simple model to convert the 3-D distribution of QSO-absorber separations into a line-of-sight distribution in velocity space is presented. Our modelling allows us to reach the following conclusions for C iv systems:
- •
Galaxies in the vicinity of the QSO may contribute as much as 55% of the central spike of absorbers with . The remaining 45% can be directly linked to the presence of the QSO.
- •
A high-velocity tail of narrow absorbers is observed, which cannot be explained by galaxy clustering. These intrinsic absorbers make up 45% of narrow absorption line systems with .
- •
The high-velocity tail is visible in both RQ and RL QSOs. RL QSOs show an enhanced number of absorbers at low velocities.
For Mg ii absorbers we find:
- •
The spike of “associated” absorbers close to the QSOs in velocity space is consistent with being caused by galaxy clustering, but our analysis cannot rule out the possibility that a considerable fraction are caused by absorbers intrinsic to the QSO and its host.
- •
The QSO destroys Mg ii clouds well beyond the expected scale of its own halo, out to at least 800 kpc (comoving).
- •
A high-velocity tail of intrinsic Mg ii absorbers is detected, at a level of 205% that observed in the C iv absorbers.
In the future, the larger absorber samples provided by later releases of the SDSS survey data, improved methods for obtaining reliable QSO redshifts, and investigations of ionisation and line width trends with velocity, will contribute substantially to isolating the physical processes responsible for QSO outflows detected through narrow absorption lines.
acknowledgments
We would like to thank Craig Hogan, Stuart Sim, Philip Best, Jeremy Blaizot, Cheng Li, and Robert Brunner for useful discussions and comments. This paper made use of the IDL MPFIT package by Craig Markwardt http://cow.physics.wisc.edu/ craigm/idl/.
Funding for the SDSS and SDSS-II has been provided by the Alfred P. Sloan Foundation, the Participating Institutions, the National Science Foundation, the U.S. Department of Energy, the National Aeronautics and Space Administration, the Japanese Monbukagakusho, the Max Planck Society, and the Higher Education Funding Council for England. The SDSS Web Site is http://www.sdss.org/.
The SDSS is managed by the Astrophysical Research Consortium for the Participating Institutions. The Participating Institutions are the American Museum of Natural History, Astrophysical Institute Potsdam, University of Basel, University of Cambridge, Case Western Reserve University, University of Chicago, Drexel University, Fermilab, the Institute for Advanced Study, the Japan Participation Group, Johns Hopkins University, the Joint Institute for Nuclear Astrophysics, the Kavli Institute for Particle Astrophysics and Cosmology, the Korean Scientist Group, the Chinese Academy of Sciences (LAMOST), Los Alamos National Laboratory, the Max-Planck-Institute for Astronomy (MPIA), the Max-Planck-Institute for Astrophysics (MPA), New Mexico State University, Ohio State University, University of Pittsburgh, University of Portsmouth, Princeton University, the United States Naval Observatory, and the University of Washington.
Bibliography
- Abazajian K., Adelman-McCarthy J. K., Agüeros M. A., et al. (The SDSS Collaboration), 2005, AJ, 129, 1755
- Adelberger K. L., Steidel C. C., Pettini M., Shapley A. E., Reddy N. A., Erb D. K., 2005, ApJ, 619, 697
- Aldcroft T. L., Bechtold J., Elvis M., 1994, ApJS, 93, 1
- Bahcall J. N., Spitzer L. J., 1969, ApJL, 156, L63+
- Baker J. C., Hunstead R. W., Athreya R. M., Barthel P. D., de Silva E., Lehnert M. D., Saunders R. D. E., 2002, ApJ, 568, 592
- Barlow T. A., Hamann F., Sargent W. L. W., 1997, 128, 13
- Barlow T. A., Sargent W. L. W., 1997, AJ, 113, 136
- Becker R. H., Gregg M. D., Hook I. M., McMahon R. G., White R. L., Helfand D. J., 1997, ApJL, 479, L93+
- Becker R. H., White R. L., Helfand D. J., 1995, ApJ, 450, 559
- Bergeron J., Boisse P., 1984, A&A, 133, 374
- Bergeron J., Stasińska G., 1986, A&A, 169, 1
- Best P. N., von der Linden A., Kauffmann G., Heckman T. M., Kaiser C. R., 2007, MNRAS, 379, 894
- Blanton M. R., Lin H., Lupton R. H., Maley F. M., Young N., Zehavi I., Loveday J., 2003, AJ, 125, 2276
- Boksenberg A., Sargent W. L. W., 1978, ApJ, 220, 42
- Bowen D. V., Hennawi J. F., Ménard B., Chelouche D., Inada N., Oguri M., Richards G. T., Strauss M. A., Vanden Berk D. E., York D. G., 2006, ApJL, 645, L105
- Bower R. G., Benson A. J., Malbon R., Helly J. C., Frenk C. S., Baugh C. M., Cole S., Lacey C. G., 2006, MNRAS, 370, 645
- Chelouche D., Ménard B., Bowen D. V., Gnat O., 2007, ArXiv e-prints, 706
- Chen H.-W., Lanzetta K. M., Webb J. K., 2001, ApJ, 556, 158
- Chen H.-W., Tinker J. L., 2008, ArXiv e-prints, 801
- Churchill C. W., Mellon R. R., Charlton J. C., Jannuzi B. T., Kirhakos S., Steidel C. C., Schneider D. P., 1999, ApJL, 519, L43
- Cirasuolo M., Celotti A., Magliocchetti M., Danese L., 2003, MNRAS, 346, 447
- Coil A. L., Newman J. A., Croton D., Cooper M. C., Davis M., Faber S. M., Gerke B. F., Koo D. C., Padmanabhan N., Wechsler R. H., Weiner B. J., 2007, ArXiv e-prints, 708
- Croom S. M., Boyle B. J., Shanks T., Smith R. J., Miller L., Outram P. J., Loaring N. S., Hoyle F., da Ângela J., 2005, MNRAS, 356, 415
- Croton D. J., Springel V., White S. D. M., De Lucia G., Frenk C. S., Gao L., Jenkins A., Kauffmann G., Navarro J. F., Yoshida N., 2006, MNRAS, 365, 11
- Dunlop J. S., Taylor G. L., Hughes D. H., Robson E. I., 1993, MNRAS, 264, 455
- Ellingson E., Yee H. K. C., Bechtold J., Dobrzycki A., 1994, AJ, 107, 1219
- Elvis M., 2000, ApJ, 545, 63
- Emonts B. H. C., Morganti R., Tadhunter C. N., Oosterloo T. A., Holt J., van der Hulst J. M., 2005, MNRAS, 362, 931
- Ferland G. J., Korista K. T., Verner D. A., Ferguson J. W., Kingdon J. B., Verner E. M., 1998, PASP, 110, 761
- Foltz C. B., Chaffee F. H., Hewett P. C., Weymann R. J., Morris S. L., 1990, 22, 806
- Foltz C. B., Chaffee F. H., Weymann R. J., Anderson S. F., 1988, pp 53–+
- Foltz C. B., Weymann R. J., Peterson B. M., Sun L., Malkan M. A., Chaffee Jr. F. H., 1986, ApJ, 307, 504
- Fukugita M., Ichikawa T., Gunn J. E., Doi M., Shimasaku K., Schneider D. P., 1996, AJ, 111, 1748
- Ganguly R., Bond N. A., Charlton J. C., Eracleous M., Brandt W. N., Churchill C. W., 2001, ApJ, 549, 133
- Ganguly R., Brotherton M. S., Cales S., Scoggins B., Shang Z., Vestergaard M., 2007, ApJ, 665, 990
- Gaskell C. M., 1982, ApJ, 263, 79
- Goncalves T. S., Steidel C. C., Pettini M., 2007, ArXiv e-prints, 711
- Gunn J. E., Carr M., Rockosi C., et al. 1998, AJ, 116, 3040
- Gunn J. E., Siegmund W. A., Mannery E. J., et al 2006, AJ, 131, 2332
- Hamann F., Beaver E. A., Cohen R. D., Junkkarinen V., Lyons R. W., Burbidge E. M., 1997, ApJ, 488, 155
- Hamann F. W., Barlow T. A., Chaffee F. C., Foltz C. B., Weymann R. J., 2001, ApJ, 550, 142
- Hennawi J. F., Prochaska J. X., 2007, ApJ, 655, 735
- Hewett P. C., Foltz C. B., 2003, AJ, 125, 1784
- Hogg D. W., Finkbeiner D. P., Schlegel D. J., Gunn J. E., 2001, AJ, 122, 2129
- Ivezić Ž., Lupton R. H., Schlegel D., et al. 2004, Astronomische Nachrichten, 325, 583
- Jing Y. P., Börner G., 2004, ApJ, 617, 782
- Kacprzak G. G., Churchill C. W., Steidel C. C., Murphy M. T., 2007, ArXiv e-prints, 710
- Kauffmann G., Heckman T. M., Best P. N., 2007, ArXiv e-prints, 709
- Krause M., 2002, A&A, 386, L1
- Kristian J., 1973, ApJL, 179, L61+
- Li C., Jing Y. P., Kauffmann G., Börner G., White S. D. M., Cheng F. Z., 2006, MNRAS, 368, 37
- Lundgren B. F., Wilhite B. C., Brunner R. J., Hall P. B., Schneider D. P., York D. G., Vanden Berk D. E., Brinkmann J., 2007, ApJ, 656, 73
- Meneux B., Le Fèvre O., Guzzo L., et al. 2006, A&A, 452, 387
- Miller L., Peacock J. A., Mead A. R. G., 1990, MNRAS, 244, 207
- Mo H. J., White S. D. M., 2002, MNRAS, 336, 112
- Morganti R., Holt J., Saripalli L., Oosterloo T. A., Tadhunter C. N., 2007, ArXiv e-prints, 710
- Morganti R., Tadhunter C. N., Oosterloo T. A., 2005, A&A, 444, L9
- Murray N., Chiang J., 1995, ApJL, 454, L105+
- Murray N., Chiang J., Grossman S. A., Voit G. M., 1995, ApJ, 451, 498
- Nesvadba N. P. H., Lehnert M. D., De Breuck C., Gilbert A., van Breugel W., 2007, A&A, 475, 145
- Nesvadba N. P. H., Lehnert M. D., Eisenhauer F., Gilbert A., Tecza M., Abuter R., 2006, ApJ, 650, 693
- Outram P. J., Smith R. J., Shanks T., Boyle B. J., Croom S. M., Loaring N. S., Miller L., 2001, MNRAS, 328, 805
- Peebles P. J. E., 1980, The large-scale structure of the universe. Princeton, N.J., Princeton University Press, 1980. 435 p.
- Pier J. R., Munn J. A., Hindsley R. B., Hennessy G. S., Kent S. M., Lupton R. H., Ivezić Ž., 2003, AJ, 125, 1559
- Reichard T. A., Richards G. T., Hall P. B., Schneider D. P., Vanden Berk D. E., Fan X., York D. G., Knapp G. R., Brinkmann J., 2003, AJ, 126, 2594
- Richards G. T., 2001, ApJS, 133, 53
- Richards G. T., 2006, ArXiv Astrophysics e-prints
- Richards G. T., Fan X., Newberg H. J., et al. 2002, AJ, 123, 2945
- Richards G. T., Strauss M. A., Fan X., et al. 2006, AJ, 131, 2766
- Richards G. T., Vanden Berk D. E., Reichard T. A., Hall P. B., Schneider D. P., SubbaRao M., Thakar A. R., York D. G., 2002, AJ, 124, 1
- Richards G. T., York D. G., Yanny B., Kollgaard R. I., Laurent-Muehleisen S. A., vanden Berk D. E., 1999, ApJ, 513, 576
- Sargent W. L. W., Boksenberg A., Steidel C. C., 1988, ApJS, 68, 539
- Schneider D. P., Hall P. B., Richards G. T., et al. 2007, AJ, 134, 102
- Schneider D. P., Hall P. B., Richards G. T., et al. (The SDSS Collaboration), 2005, AJ, 130, 367
- Shankar F., Dai X., Sivakoff G. R., 2008, ArXiv e-prints, 801
- Shanks T., Boyle B. J., 1994, MNRAS, 271, 753
- Shen Y., Strauss M. A., Oguri M., Hennawi J. F., Fan X., Richards G. T., Hall P. B., Gunn J. E., Schneider D. P., Szalay A. S., Thakar A. R., Vanden Berk D. E., Anderson S. F., Bahcall N. A., Connolly A. J., Knapp G. R., 2007, AJ, 133, 2222
- Sikora M., Stawarz Ł., Lasota J.-P., 2007, ApJ, 658, 815
- Smith E. P., Heckman T. M., 1990, ApJ, 348, 38
- Smith J. A., Tucker D. L., Kent S., et al. 2002, AJ, 123, 2121
- Steidel C. C., 1993, in Shull J. M., Thronson H. A., eds, ASSL Vol. 188: The Environment and Evolution of Galaxies Dordrecht: Kluwer, p. 263
- Steidel C. C., Dickinson M., Meyer D. M., Adelberger K. L., Sembach K. R., 1997, ApJ, 480, 568
- Steidel C. C., Dickinson M., Persson S. E., 1994, ApJL, 437, L75
- Steidel C. C., Sargent W. L. W., 1992, ApJS, 80, 1
- Stocke J. T., Morris S. L., Weymann R. J., Foltz C. B., 1992, ApJ, 396, 487
- Stoughton C., Lupton R. H., Bernardi M., et al. (The SDSS Collaboration), 2002, AJ, 123, 485
- Sulentic J. W., Marziani P., Dultzin-Hacyan D., 2000, ARAA, 38, 521
- Tinker J. L., Chen H.-W., 2007, ArXiv e-prints, 709
- Tremonti C. A., Moustakas J., Diamond-Stanic A. M., 2007, ApJL, 663, L77
- Trump J. R., Hall P. B., Reichard T. A., Richards G. T., Schneider D. P., Vanden Berk D. E., Knapp G. R., Anderson S. F., Fan X., Brinkman J., Kleinman S. J., Nitta A., 2006, ApJS, 165, 1
- Tucker D. L., Kent S., Richmond M. W., et al. 2006, Astronomische Nachrichten, 327, 821
- Tytler D., Gleed M., Melis C., Chapman A., Kirkman D., Lubin D., Paschos P., Jena T., Crotts A. P. S., 2007, ArXiv e-prints, 711
- Vanden Berk D., Khare P., York D., et al. 2008, Average Properties of a large sample of associated MgII Absorption line systems, ApJ Submitted
- vanden Berk D. E., Richards G. T., Bauer A., et al., 2001, AJ, 122, 549
- Vestergaard M., 2003, ApJ, 599, 116
- Weymann R. J., 2002, 255, 329
- Weymann R. J., Williams R. E., Peterson B. M., Turnshek D. A., 1979, ApJ, 234, 33
- Wild V., Hewett P. C., 2005, MNRAS, 358, 1083
- Wild V., Hewett P. C., Pettini M., 2006, MNRAS, 367, 211
- York D. G., Adelman J., Anderson Jr. J. E., et al. 2000, AJ, 120, 1579
- York D. G., Khare P., Vanden Berk D., et al. 2006, MNRAS, 274, 945
- Young P., Sargent W. L. W., Boksenberg A., 1982, ApJS, 48, 455
- Yuan M. J., Wills B. J., 2003, ApJL, 593, L11
- Zibetti S., Ménard B., Nestor D. B., Quider A. M., Rao S. M., Turnshek D. A., 2007, ApJ, 658, 161