Measurement of exclusive meson decays to and final states
and SU(3) amplitude analysis
M. Artuso
Affiliation: Syracuse University, Syracuse, New York 13244, USA
S. Blusk
Affiliation: Syracuse University, Syracuse, New York 13244, USA
S. Khalil
Affiliation: Syracuse University, Syracuse, New York 13244, USA
J. Li
Affiliation: Syracuse University, Syracuse, New York 13244, USA
R. Mountain
Affiliation: Syracuse University, Syracuse, New York 13244, USA
S. Nisar
Affiliation: Syracuse University, Syracuse, New York 13244, USA
K. Randrianarivony
Affiliation: Syracuse University, Syracuse, New York 13244, USA
N. Sultana
Affiliation: Syracuse University, Syracuse, New York 13244, USA
T. Skwarnicki
Affiliation: Syracuse University, Syracuse, New York 13244, USA
S. Stone
Affiliation: Syracuse University, Syracuse, New York 13244, USA
J. C. Wang
Affiliation: Syracuse University, Syracuse, New York 13244, USA
L. M. Zhang
Affiliation: Syracuse University, Syracuse, New York 13244, USA
G. Bonvicini
Affiliation: Wayne State University, Detroit, Michigan 48202, USA
D. Cinabro
Affiliation: Wayne State University, Detroit, Michigan 48202, USA
M. Dubrovin
Affiliation: Wayne State University, Detroit, Michigan 48202, USA
A. Lincoln
Affiliation: Wayne State University, Detroit, Michigan 48202, USA
P. Naik
Affiliation: University of Bristol, Bristol BS8 1TL, UK
J. Rademacker
Affiliation: University of Bristol, Bristol BS8 1TL, UK
D. M. Asner
Affiliation: Carleton University, Ottawa, Ontario, Canada K1S 5B6
K. W. Edwards
Affiliation: Carleton University, Ottawa, Ontario, Canada K1S 5B6
J. Reed
Affiliation: Carleton University, Ottawa, Ontario, Canada K1S 5B6
R. A. Briere
Affiliation: Carnegie Mellon University, Pittsburgh, Pennsylvania 15213, USA
T. Ferguson
Affiliation: Carnegie Mellon University, Pittsburgh, Pennsylvania 15213, USA
G. Tatishvili
Affiliation: Carnegie Mellon University, Pittsburgh, Pennsylvania 15213, USA
H. Vogel
Affiliation: Carnegie Mellon University, Pittsburgh, Pennsylvania 15213, USA
M. E. Watkins
Affiliation: Carnegie Mellon University, Pittsburgh, Pennsylvania 15213, USA
J. L. Rosner
Affiliation: Enrico Fermi Institute, University of
Chicago, Chicago, Illinois 60637, USA
J. P. Alexander
Affiliation: Cornell University, Ithaca, New York 14853, USA
D. G. Cassel
Affiliation: Cornell University, Ithaca, New York 14853, USA
J. E. Duboscq
Affiliation: Cornell University, Ithaca, New York 14853, USA
R. Ehrlich
Affiliation: Cornell University, Ithaca, New York 14853, USA
L. Fields
Affiliation: Cornell University, Ithaca, New York 14853, USA
L. Gibbons
Affiliation: Cornell University, Ithaca, New York 14853, USA
R. Gray
Affiliation: Cornell University, Ithaca, New York 14853, USA
S. W. Gray
Affiliation: Cornell University, Ithaca, New York 14853, USA
D. L. Hartill
Affiliation: Cornell University, Ithaca, New York 14853, USA
B. K. Heltsley
Affiliation: Cornell University, Ithaca, New York 14853, USA
D. Hertz
Affiliation: Cornell University, Ithaca, New York 14853, USA
J. M. Hunt
Affiliation: Cornell University, Ithaca, New York 14853, USA
J. Kandaswamy
Affiliation: Cornell University, Ithaca, New York 14853, USA
D. L. Kreinick
Affiliation: Cornell University, Ithaca, New York 14853, USA
V. E. Kuznetsov
Affiliation: Cornell University, Ithaca, New York 14853, USA
J. Ledoux
Affiliation: Cornell University, Ithaca, New York 14853, USA
H. Mahlke-Krüger
Affiliation: Cornell University, Ithaca, New York 14853, USA
D. Mohapatra
Affiliation: Cornell University, Ithaca, New York 14853, USA
P. U. E. Onyisi
Affiliation: Cornell University, Ithaca, New York 14853, USA
J. R. Patterson
Affiliation: Cornell University, Ithaca, New York 14853, USA
D. Peterson
Affiliation: Cornell University, Ithaca, New York 14853, USA
D. Riley
Affiliation: Cornell University, Ithaca, New York 14853, USA
A. Ryd
Affiliation: Cornell University, Ithaca, New York 14853, USA
A. J. Sadoff
Affiliation: Cornell University, Ithaca, New York 14853, USA
X. Shi
Affiliation: Cornell University, Ithaca, New York 14853, USA
S. Stroiney
Affiliation: Cornell University, Ithaca, New York 14853, USA
W. M. Sun
Affiliation: Cornell University, Ithaca, New York 14853, USA
T. Wilksen
Affiliation: Cornell University, Ithaca, New York 14853, USA
S. B. Athar
Affiliation: University of Florida, Gainesville, Florida 32611, USA
R. Patel
Affiliation: University of Florida, Gainesville, Florida 32611, USA
J. Yelton
Affiliation: University of Florida, Gainesville, Florida 32611, USA
P. Rubin
Affiliation: George Mason University, Fairfax, Virginia 22030, USA
B. I. Eisenstein
Affiliation: University of Illinois, Urbana-Champaign, Illinois 61801, USA
I. Karliner
Affiliation: University of Illinois, Urbana-Champaign, Illinois 61801, USA
S. Mehrabyan
Affiliation: University of Illinois, Urbana-Champaign, Illinois 61801, USA
N. Lowrey
Affiliation: University of Illinois, Urbana-Champaign, Illinois 61801, USA
M. Selen
Affiliation: University of Illinois, Urbana-Champaign, Illinois 61801, USA
E. J. White
Affiliation: University of Illinois, Urbana-Champaign, Illinois 61801, USA
J. Wiss
Affiliation: University of Illinois, Urbana-Champaign, Illinois 61801, USA
R. E. Mitchell
Affiliation: Indiana University, Bloomington, Indiana 47405, USA
M. R. Shepherd
Affiliation: Indiana University, Bloomington, Indiana 47405, USA
D. Besson
Affiliation: University of Kansas, Lawrence, Kansas 66045, USA
T. K. Pedlar
Affiliation: Luther College, Decorah, Iowa 52101, USA
D. Cronin-Hennessy
Affiliation: University of Minnesota, Minneapolis, Minnesota 55455, USA
K. Y. Gao
Affiliation: University of Minnesota, Minneapolis, Minnesota 55455, USA
J. Hietala
Affiliation: University of Minnesota, Minneapolis, Minnesota 55455, USA
Y. Kubota
Affiliation: University of Minnesota, Minneapolis, Minnesota 55455, USA
T. Klein
Affiliation: University of Minnesota, Minneapolis, Minnesota 55455, USA
B. W. Lang
Affiliation: University of Minnesota, Minneapolis, Minnesota 55455, USA
R. Poling
Affiliation: University of Minnesota, Minneapolis, Minnesota 55455, USA
A. W. Scott
Affiliation: University of Minnesota, Minneapolis, Minnesota 55455, USA
P. Zweber
Affiliation: University of Minnesota, Minneapolis, Minnesota 55455, USA
S. Dobbs
Affiliation: Northwestern University, Evanston, Illinois 60208, USA
Z. Metreveli
Affiliation: Northwestern University, Evanston, Illinois 60208, USA
K. K. Seth
Affiliation: Northwestern University, Evanston, Illinois 60208, USA
A. Tomaradze
Affiliation: Northwestern University, Evanston, Illinois 60208, USA
J. Libby
Affiliation: University of Oxford, Oxford OX1 3RH, UK
A. Powell
Affiliation: University of Oxford, Oxford OX1 3RH, UK
G. Wilkinson
Affiliation: University of Oxford, Oxford OX1 3RH, UK
K. M. Ecklund
Affiliation: State University of New York at Buffalo, Buffalo, New York 14260, USA
W. Love
Affiliation: University of Pittsburgh, Pittsburgh, Pennsylvania 15260, USA
V. Savinov
Affiliation: University of Pittsburgh, Pittsburgh, Pennsylvania 15260, USA
A. Lopez
Affiliation: University of Puerto Rico, Mayaguez, Puerto Rico 00681
H. Mendez
Affiliation: University of Puerto Rico, Mayaguez, Puerto Rico 00681
J. Ramirez
Affiliation: University of Puerto Rico, Mayaguez, Puerto Rico 00681
J. Y. Ge
Affiliation: Purdue University, West Lafayette, Indiana 47907, USA
D. H. Miller
Affiliation: Purdue University, West Lafayette, Indiana 47907, USA
I. P. J. Shipsey
Affiliation: Purdue University, West Lafayette, Indiana 47907, USA
B. Xin
Affiliation: Purdue University, West Lafayette, Indiana 47907, USA
G. S. Adams
Affiliation: Rensselaer Polytechnic Institute, Troy, New York 12180, USA
M. Anderson
Affiliation: Rensselaer Polytechnic Institute, Troy, New York 12180, USA
J. P. Cummings
Affiliation: Rensselaer Polytechnic Institute, Troy, New York 12180, USA
I. Danko
Affiliation: Rensselaer Polytechnic Institute, Troy, New York 12180, USA
D. Hu
Affiliation: Rensselaer Polytechnic Institute, Troy, New York 12180, USA
B. Moziak
Affiliation: Rensselaer Polytechnic Institute, Troy, New York 12180, USA
J. Napolitano
Affiliation: Rensselaer Polytechnic Institute, Troy, New York 12180, USA
Q. He
Affiliation: University of Rochester, Rochester, New York 14627, USA
J. Insler
Affiliation: University of Rochester, Rochester, New York 14627, USA
H. Muramatsu
Affiliation: University of Rochester, Rochester, New York 14627, USA
C. S. Park
Affiliation: University of Rochester, Rochester, New York 14627, USA
E. H. Thorndike
Affiliation: University of Rochester, Rochester, New York 14627, USA
F. Yang
Affiliation: University of Rochester, Rochester, New York 14627, USA
CLEO Collaboration
Affiliation:
August 24, 2026
Abstract
Using 281 of data collected with the CLEO-c detector, we present new measurements of Cabibbo-suppressed
decays of and mesons to and final states. We make first observations
of , , , and , and find evidence for
, and . We also
report on improved measurements of , and .
Using the measured two-body Cabibbo-suppressed decays, we extract amplitudes for specific
flavor topologies and compare them to those from Cabibbo-favored decays.
pacs
13.25.Ft
Charm decays provide a laboratory for the study of the weak and strong interactions.
Because of their simplicity, two-body hadronic decays provide experimental input for
understanding strong final state interaction effects in heavy meson
decays [1, 2, 3, 4, 5, 6]. By studying
these decays, one can determine the magnitude and relative phases of contributing
isospin or topological decay amplitudes. To describe these decays,
particularly for and mesons, one often invokes symmetries, such as SU(3) flavor symmetry,
which assumes the masses
of the , and quarks are equal (and implicitly assumed to be small). Small differences
in decay rates are then attributed to SU(3) symmetry-breaking effects. Typically, such
symmetry-breaking effects are at the level of 20% for meson decays, and are expected to
decrease as the parent meson mass increases, e.g., decays. In the SU(3) flavor
quark diagrammatic approach [4], two-body decays are
decomposed into contributions from tree (T), color-suppressed (C), annihilation (A) and
exchange (E) diagrams.
Penguin diagrams are expected to be negligible in charm decays and are not discussed any further.
Additional disconnected diagrams, such as the singlet-exchange (SE) and singlet-annihilation (SA)
may also contribute to final states that include and via their coupling to
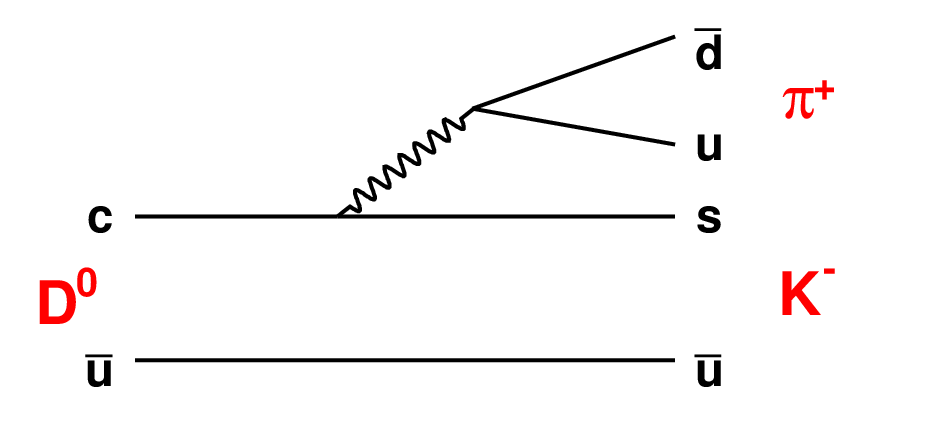
the SU(3) singlet component of these mesons. These quark diagrams are shown in
Fig. 1.
(a) Tree (T)
(b) Color-suppressed tree (C).
(c) Exchange (E).
(d) Annihilation (A).
(e) Singlet Exchange (SE).
Figure 1: Feynman diagrams for various flavor topologies used to describe decays.
Here, we use Cabibbo-favored diagrams as an example, for , , , and
Cabibbo-suppressed decays for the and diagrams.
An analysis of Cabibbo-favored (CF) decays has been carried out [7],
and it was shown that their branching fractions are well-described within the SU(3) flavor
topology approach.
In this report, we measure branching fractions of singly Cabibbo-suppressed (CS) decays and
analyze them within the same framework [8].
This analysis utilizes of data collected on the resonance at the
Cornell Electron Storage Ring. This energy is just above threshold for
production of pairs, and thus no additional particles accompany the pair.
The decay products of the mesons are reconstructed using the CLEO-c detector, which
is a general purpose solenoidal detector. The detector includes a tracking system for
measuring momenta and specific ionization () of charged particles, a Ring Imaging Cherenkov
Counter (RICH) for particle identification, and a CsI calorimeter (CC) for detection of
electromagnetic showers. The CLEO-c detector is described in detail elsewhere [9].
We reconstruct meson candidates in the following singly Cabibbo-suppressed decay
modes: , , , , and
, , , , and .
Unless otherwise noted, charge conjugate final states are assumed throughout.
Charged particles are reconstructed using the tracking system
and are required to pass a set of standard selection criteria [10].
Charged pions are identified using a discriminant based on and RICH
information. First, we require that the measured is within three standard deviations ()
of the expected value for a pion at the given momentum. We then define:
(1)
where is the difference in the measured and expected for the
kaon (pion) hypothesis, normalized by its uncertainty,
and is the negative log-likelihood for the kaon (pion) hypothesis obtained
from the RICH.
The RICH information is used only for charged particles with momentum above 0.7 GeV/
and possessing at least three associated Cherenkov photons.
We require , which results in an efficiency of about 95% and
a fake rate of no more than 2%.
We construct and candidates
using reconstructed showers in the calorimeter that have
energy MeV ( MeV for ) and
no charged track that is projected within the vicinity of the shower.
For each candidate, we require the mass pull,
, where
is the reconstructed invariant mass, is the parent particle mass
(here or ), and is the uncertainty in the
invariant mass of the candidate
(5-7 MeV/). Candidate decays are also formed using
the previously discussed selection criteria on charged and neutral pions.
To improve the resolution on the or momentum,
the decays are kinematically constrained to the known and
meson masses. The improved four-momenta are then used in subsequent analysis.
We select candidates by requiring the mass difference,
MeV/.
For decay modes with only a single , there is minimal benefit to including the
mode because of the lower branching fraction and detection efficiency.
We therefore only use . However, for and ,
there is a significant gain in statistical power by allowing one decay in the final state.
To reduce combinatoric background in three-body decays we veto
candidates that share a photon with any with .
To ameliorate backgrounds from Cabibbo-favored modes containing a we require oppositely
charged pion pairs in the final state to be outside the invariant mass interval from 475-520 MeV/.
Signal candidates are formed and required to have an energy, , consistent
with the beam energy, , by requiring is consistent with zero.
The mode-by-mode selection requirements are determined from Monte Carlo simulation,
and are shown in Table 1.
Efficiencies for these decays after all analysis requirements are determined from Monte
Carlo simulation of these decays [15, 16, 17] and are also shown
in Table 1.
Table 1: Summary of mode-dependent selection requirements for modes under consideration.
Also shown are the efficiencies from signal Monte Carlo simulation. For and
, we indicate the decay modes of the ’s in parentheses.
The quoted uncertainties are statistical and systematic, respectively.
Mode
Range (MeV)
Efficiency (%)
[-28, 25]
[-19, 18]
[-45, 34]
[-38, 32]
()
[-33, 30]
()
[-26, 25]
()
[-27, 23]
()
[-23, 20]
[-22, 19]
[-29, 24]
[-19, 17]
[-22, 20]
For candidates passing these selection criteria, we compute the
beam-constrained mass, , where
is the momentum of
the candidate. Substituting for the candidate energy improves the
mass resolution by about a factor of two. Figure 2 shows
the distributions for the two-body singly Cabibbo-suppressed decays
(a) , (b) , (c) , and
(d) , (e) , and (f) .
Prominent peaks are observed for all six decay modes.
The points show the signal candidates in data and the
curves are fits based on maximizing the likelihood of the probability density
function, which is given by the sum of an
argus threshold function [12] and an
asymmetric Gaussian signal shape (cbal) [13]. The argus shape parameters
are extracted by fitting distributions obtained from the sideband regions in data.
The high-mass tail in the spectrum results from initial state radiation (ISR)
and is modeled by a power-law tail in the cbal line-shape.
The signal shape parameters (mean, width and tail parameters) are determined from,
and fixed to the values obtained from Monte Carlo simulation.
We obtain yields of for , for ,
for , for ,
for , and events for .
These are first observations of , and
, and correspond to signal significances of 7.2, 14.8. and 6.7, respectively.
The significances are obtained from the differences in log-likelihood values
with and without (signal yield set to zero) the signal component ı.e. .
The yields are shown in Table 2. For and ,
we also show yields when the two decay channels are analyzed independently;
both are consistent with fits to the sum of both decay channels.
Peaking backgrounds from non-resonant final states, such as ,
, etc, which may contribute to the and
decays, respectively, are highly suppressed because the and
invariant masses must be consistent with the and masses, respectively.
Moreover, these
backgrounds are also Cabibbo suppressed, and thus we expect them to be very small or negligible.
This supposition is checked by selecting candidates from
the sideband regions, and MeV/,
and repeating the analysis. No evidence of peaking backgrounds are found.
Figure 3 shows the distributions for the
three-body Cabibbo-suppressed decays.
(a) , (b) , (c) , and
(d) . We obtain signal yields (significances) of (9.0)
for , (4.5) for ,
(3.2) for , and (4.2)
for , respectively. We thus establish
the decay, and provide first evidence for the other three-body
decay modes.
The branching fractions are computed from:
(2)
where is the number of signal events, is
the number of pairs produced, and the acceptance .
Here, the sum is over the product of efficiency () and submode
branching fractions, for the measurements indicated in
Table 2.
The numbers, and
, are determined from an independent measurement
of Cabibbo-favored hadronic branching fractions [10].
The yields and branching fractions are tabulated in Table 2. For
and we also show that the two decay modes yield consistent branching fractions.
The inclusive rates for have been recently measured [14],
and the exclusive , and modes measured here
comprise about 10% of their respective total inclusive rates. In contrast,
accounts for
about 60% of the total inclusive rate.
Table 2: Summary of yields and branching fraction measurements, as discussed in
the text. For and , we also show the individual results
obtained from the two submodes.
The first uncertainty is statistical and the second is systematic.
Where measurements are available, results are compared to the PDG.
A number of systematic uncertainties have been considered. Efficiencies, as determined
from Monte Carlo simulation, are subject to uncertainties due to finite statistics (1-2%),
modeling of the underlying physics, and modeling of the detector response. The underlying
physics that induces uncertainty in the efficiencies includes modeling of final state radiation (1%)
and resonant substructure. The latter is applicable only to the three-body decay modes
and is determined by comparing efficiencies determined using a phase-space decay with
those obtained using intermediate resonances, such as , ,
or . We take the largest fractional difference in efficiency as the associated
uncertainty. The values range from 3% for to 12%
for . Charged and neutral particle
reconstruction and identification has been extensively studied using a missing-mass
technique [10], and we find that the efficiencies in data are consistent with, or
slightly lower than simulated efficiencies.
We thus correct the simulated efficiencies as follows.
The pion tracking efficiency and particle identification corrections are
and , respectively. For each
(), we adjust the efficiencies by ().
These corrections and uncertainties are included in the efficiencies shown in Table 1.
Additional sources of uncertainty arise from the candidate selection requirements, namely
the veto, mass window, veto (for photons also used in a ),
and the restricted range. We estimate the uncertainty introduced from these
requirements by increasing the window size and taking the fractional difference in the
efficiency-corrected yield between the nominal and the larger window size.
For the rejection, we increase the veto region by 50%, from which we find
an uncertainty of 2%. For the selection, we broaden the selection
window to cover the range from 395-423 MeV/, and find an associated uncertainty of 1%.
The uncertainty introduced from the veto is only applicable to three-body decay modes.
It is estimated by comparing (data and MC simulation) the fraction of signal events that pass
the veto with respect to no veto in the two-body decay modes. The ratio, averaged over several
modes, is , and we conservatively assign a 5% systematic error to this
source. The systematic uncertainty is obtained by increasing the signal window
by one unit of the Gaussian width. The corresponding uncertainty ranges from
2% for to 4% for . Uncertainty in the signal yield receives
contributions from both the signal and background shape parameterizations. Both are studied by
varying the shape parameters one at a time by 1 standard deviation and adding the
resulting changes in yield in quadrature. The associated uncertainties range from
1% (for ) to 4% (for ) for the signal shape
uncertainty and 0.5% (for ) to 4.0% (for ) for the
background shape and normalization. Uncertainty due to multiple candidates in an
event is quantified by computing the average number of candidates per event within
5 MeV of the known mass for both simulation and data. We find good agreement
between data and simulation, except for final states with low momentum ’s,
where the data has a slightly larger rate of multiple candidates.
We take half the difference between the average number of multiple candidates between
data and simulation as a correction to the branching fraction, and assign 100% uncertainty
to it, leading to the following corrections: for
, for , and
for . The rest of the modes are consistent
with unity at the level of 1%, which we assign as a systematic
uncertainty. The branching fractions for , and are uncertain
by 0.6%, 1.5% and 3.1%, respectively, for each such decay in the final state.
Lastly, the number of () events in our data sample has an
uncertainty of 1.5% (1.6%) [10]. The systematic uncertainties for all modes under
consideration are summarized in Tables 3 and are included in the
branching fraction measurements in Table 2.
Figure 2: Distribution of for the two-body Cabibbo-suppressed
decay modes:
(a) , (b) , (c) ,
(d) , (e) , and (f) .
The superimposed curve is a fit to the data as described in the text.
Figure 3: Distribution of for the three-body Cabibbo-suppressed
decay modes:
(a) , (b) ,
(c) , and (d) .
The superimposed curve is a fit to the data as described in the text.
Table 3: Systematic uncertainties for signal decay modes as discussed in the text.
The two entries for and correspond to the final states
that are reconstructed with two decays, or one and one .
Source
MC Statistics
1.0
1.0
1.0
1.0
1.0
1.0
2.0
2.0
1.0
2.0
Particle Recon. & ID
3.7
3.9
4.3
4.3
7.4/4.3
7.5/4.5
4.3
4.4
3.8
4.0
Selection
2.0
2.0
4.0
3.0
3.0/2.0
2.0/2.0
4.0
3.0
3.0
2.0
Selection
-
1.0
-
1.0
-
1.0
-
1.0
-
1.0
Signal Shape
1.0
3.0
1.0
3.0
3.0
2.0
2.0
3.0
3.0
4.0
Background
0.6
0.5
2.7
3.2
1.4
3.1
1.6
4.4
2.7
3.2
Multiple Candidates
1.0
1.0
1.0
1.0
1.0/3.0
1.0/1.0
1.3
1.5
1.0
1.0
Veto
-
-
-
-
-
-
5.0
5.0
5.0
5.0
Resonant Substructure
-
-
-
-
-
-
8.0
12.0
3.0
5.0
Final State Rad.
1.0
1.0
1.0
1.0
1.0
1.0
1.0
1.0
1.0
1.0
Veto
-
-
-
-
-
-
-
-
2.0
2.0
1.6
1.6
1.5
1.5
1.5
1.5
1.6
1.6
1.5
1.5
0.6
3.2
0.6
3.2
1.2/2.1
3.4/3.6
0.6
3.2
0.6
3.2
Total
4.9
6.1
6.9
7.6
7.7
8.6
11.8
15.7
8.6
11.4
We have searched for intermediate resonances in .
Figure 4 shows the sideband-subtracted and
invariant mass distributions. Surprisingly, there are no
significant contributions from either or .
Overlayed on the data (points) is a Monte Carlo simulation where
a phase space model is used. We find that decay is well-modeled
by three-body phase space.
Figure 4: Sideband-subtracted invariant mass distributions for
(left) and (right) in the
decay. The points are data and the histogram
is a phase space (PHSP) model of the decay from Monte Carlo simulation.
We now apply an SU(3) diagrammatic analysis to test the validity of the SU(3) flavor
decomposition approach to charm meson decays [4, 7, 8].
Two-body meson decays can be described using an SU(3) diagrammatic approach
in terms of an external tree diagram, ;
a color-suppressed tree diagram, ; an exchange diagram, ; an annihilation
diagram, ; and a singlet exchange diagram, . The contribution
represents the matrix element that produces an or through its coupling
to the SU(3) singlet portion of these mesons. Such contributions are OZI-suppressed, and
thus expected to be small. These five diagrams are shown in Fig. 1.
We first update the fitted diagrammatic amplitudes obtained from Cabibbo-favored
decays [8]. Table 4 shows the SU(3) representations,
the measured branching fractions, decay momentum (), and invariant amplitudes
for Cabibbo-favored decays.
The lifetime of the mesons and the
branching fractions are taken from the PDG [11], whereas
the other six branching fractions are taken from recent
CLEO measurements [10, 18, 19]. The eight branching fraction measurements are fit
to four topological amplitudes and three relative strong phases. The phases of
, and are measured with respect to , which is taken to be real.
The phase, is the angle subtended from amplitude B to amplitude A.
The fitted amplitudes (in units of GeV) and relative strong phases are found to be:
(3a)
(3b)
(3c)
(3d)
The fit is 0.65 for 1 degree of freedom, indicating that the OZI-suppressed SE and SA
contributions are not needed to describe the branching fraction measurements in Cabibbo-favored decays.
These results are consistent with those obtained in Ref. [8] and
the fitted branching fractions ( in Table 4) are
in good agreement with the experimental values.
Table 4: Table of branching fractions, SU(3) representations [8], decay momenta,
and invariant amplitudes for Cabibbo-favored decays. The last column shows
the fitted branching fractions
as described in the text. The branching fractions, , are taken from recent
CLEO measurements [10, 18, 19]
when available, otherwise we use PDG values [11].
Mode
Representation
(%)
(MeV)
( GeV)
(%)
861
3.899
860
2.208
772
0.76
565
1.95
862
2.99
850
3.02
902
1.47
743
3.61
We now analyze the Cabibbo-suppressed decays using the same framework.
Using our measured branching fractions for , , and
, we extract and , the analog of and for CS decays.
The topological amplitudes for these decays are given in Table 5.
We first assume and using these four measured branching fractions, we fit for
, and .
The resulting amplitudes and relative strong phase are shown in Table 6, and are
compared to the values from
CF decays, scaled by [11]. The values agree within about two standard deviations,
and are well within the oft cited 20% level of SU(3) symmetry breaking effects in
meson decays.
Table 5: SU(3) representations [8], measured branching fractions (from this analysis),
decay momenta, and invariant amplitudes for selected Cabibbo-suppressed decays.
The branching fraction uncertainties are obtained from the quadrature sum of the
statistical and systematic uncertainties.
Mode
Representation
Representation
()
(
()
(MeV)
GeV)
846
678
755
537
Table 6: Solutions for the topological amplitudes using Cabibbo-suppressed decays.
The fit results are compared to the values from Cabibbo-favored decays, scaled by
.
Amplitude
Magnitude
(∘)
( GeV)
CS
CF
CS
CF
C
-
-
E
We now allow for an additional singlet exchange amplitude, [8].
The SU(3) representations, including , are shown in Table 5.
Invoking SU(3) symmetry, we have
, , and ,
, , and .
The amplitudes , , , and (in units of GeV) are found to be:
(4a)
(4b)
(4c)
(4d)
One may rewrite the amplitudes in Table 5 as follows [8]:
(5a)
(5b)
(5c)
(5d)
The right hand side of each of these four equations defines a vector in the complex plane,
which contains an unknown complex offset, .
The left hand side of these equations defines four circles in the complex plane,
whose radii are determined by their measured branching fractions. We thus have
four constraints with which to solve for the real and imaginary parts of .
The solutions are obtained graphically from the common intersection point(s) of
these four circles.
Figure 5 shows Eqs. 5a-5d graphically, where
we find two common intersection points, which are (the negative of) the allowed solutions.
The small solution Re GeV and
Im GeV,
is favored due to the expected OZI suppression. The larger solution, which is
disfavored, corresponds to Re GeV and
Im GeV.
We thus find that apart from a small additional contribution
to CS decays, and , and thus these
decays respect SU(3) symmetry at the level of 20%. We therefore find that this
SU(3) flavor diagrammatic approach provides a reasonable description of both Cabibbo-favored
and Cabibbo-suppressed decays that depend on and diagrams.
This SU(3) topological approach may not apply equally well to all decays. For example,
it is well known that the prediction is not
realized due to SU(3) symmetry-breaking effects in the form factors and decays constants.
Figure 5: Graphical presentation of the four Cabibbo-suppressed amplitudes as
circles in the complex plane. The arrows correspond to their centers, as
determined from Cabibbo-favored decays, scaled by . The two overlap
regions correspond to the allowed solutions.
In summary we report on first observations of , ,
, and . We also find evidence for the three-body decays
, and . We have
analyzed and decays within the
SU(3) flavor topology approach [8] and find that the color-suppressed and
exchange amplitudes have magnitudes and a
relative strong phase that are consistent with Cabibbo-favored decays. We have performed
a second fit where we allow for an additional singlet-exchange amplitude and find a solution near
zero (favored) and a larger solution, which is disfavored due to the OZI suppression of this process.
We gratefully acknowledge the effort of the CESR staff
in providing us with excellent luminosity and running conditions.
D. Cronin-Hennessy and A. Ryd thank the A.P. Sloan Foundation.
This work was supported by the National Science Foundation,
the U.S. Department of Energy, the Natural Sciences and Engineering Research Council of Canada,
and the U.K. Science and Technology Facilities Council. We also thank Jon Rosner
and Bhubanjyoti Bhattacharya for their helpful comments on this manuscript.
References
[1] J.H. Lai and K.C. Yang, Phys. Rev. D 72, 096001 (2005).
[2] P. Guo, X.-G. He, and X.-Q. Li, Int. J. Mod. Phys. A21, 57 (2006).
[3] M. Ablikim, D.-S. Du and M.-Z. Yang, High Energy Phys. Nucl. Phys. 27, 759 (2003);
M. Ablikim, D.-S. Du and M.-Z. Yang, Phys. Lett. B 536, 34 (2002).
[4] J. L. Rosner, Phys. Rev. D 60, 074029 (1999), and references therein.
[5] F. Buccella, M. Lusignoli, and A. Pugliese, Phys. Lett. B 379, 249 (1996).
[6] A. N. Kamal, Int. J. Mod. Phys. A15, 3515 (1992).
[7]
J. L. Rosner, Phys. Rev. D 60, 114026 (1999).
[8]
C.-W. Chiang, Z. Luo and J. L. Rosner, Phys. Rev. D 67, 104001 (2003).
[9]
D. Peterson et al., Nucl. Instrum. Meth. A 478, 142 (2002);
M. Artuso et al., Nucl. Instrum. Meth. A 554, 147 (2005);
Y. Kubota et al., Nucl. Instrum. Meth. A 320, 66 (1992).
[10]
S. Dobbs et al. (CLEO Collaboration), Phys. Rev. D 76, 112001 (2007);
Q. He et al. (CLEO Collaboration), Phys. Rev. Lett. 95, 121801 (2005).
[11]
W.-M. Yao et al., Journal of Physics G 33, 1 (2006).
[12]
H. Albrecht et al. (ARGUS Collaboration), Phys. Lett. B 229, 304 (1989).
[13]
T. Skwarnicki, Ph.D. thesis, DESY F31-86-02, 1986, (unpublished).
[14]
G. S. Huang et al. (CLEO Collaboration), Phys. Rev. D74, 112005 (2006) [hep-ex/0610008].
[15]
D. J. Lange, Nucl. Instrum. Meth. A 462, 152 (2001).
[16]
R. Brun et al.,GEANT 3.21, CERN Program Library Long Writeup W5013 (1993), unpublished.
[17]
E. Barberio and Z. Was, Comput. Phys. Commun. 79, 291 (1994).
[18]
J. P. Alexander et al. (CLEO Collaboration), arXiv:0801.0680 [Phys. Rev. Lett. (submitted)].
[19]
Q. He et al. (CLEO Collaboration), arXiv:0711.146 [Phys. Rev. Lett. (to be published)].