The diffusive influx and carrier efflux have a strong effect on the bistability of the lac operon in Escherichia coli
Abstract
In the presence of gratuitous inducers, the lac operon of Escherichia coli exhibits bistability. Most models in the literature assume that the inducer enters the cell via the carrier (permease), and exits by a diffusion-like process. The diffusive influx and carrier efflux are neglected. However, analysis of the data shows that in non-induced cells, the diffusive influx is comparable to the carrier influx, and in induced cells, the carrier efflux is 7 times the diffusive efflux. Since bistability entails the coexistence of steady states corresponding to both non-induced and induced cells, neither one of these fluxes can be ignored. Here, we formulate a model accounting for both fluxes. We show that: (a) The thresholds of bistability are profoundly affected by both fluxes. The diffusive influx reduces the on threshold by enhancing inducer accumulation in non-induced cells. The carrier efflux increases the off threshold by decreasing inducer accumulation in induced cells. (b) Simulations of the model with experimentally measured parameter values are in good agreement with the data for IPTG. However, there are discrepancies with respect to the data for TMG. They are most likely due to two features missing from the model, namely, the variation of the inducer exclusion effect and the specific growth rate with the lactose enzyme levels. (c) The steady states and thresholds obtained in the presence of both fluxes are well approximated by simple analytical expressions. These expressions provide a rigorous framework for the preliminary design of the lac genetic switch in synthetic biology.
Keywords:
Mathematical model, induction, lactose operon, hysteresis1 Introduction
The lac operon is a paradigm of the mechanisms controlling gene regulation. This interest was stimulated by the hope that insights into the mechanism of lac induction would shed light on the central problem of development, namely, the mechanism by which genetically identical cells acquire distinct phenotypes (Monod, 1947; Spiegelman, 1948).
Many of the early studies of the lac operon were concerned with the kinetics of enzyme induction in the presence of gratuitous inducers, such as thiomethyl galactoside (TMG) and isopropyl thiogalactoside (IPTG). The use of such inducers was important because they enabled the kinetics of enzyme synthesis to be separated from the masking effects of dilution. This was achieved by growing the cells in a medium containing a gratuitous inducer (which promotes enzyme synthesis, but not growth), and non-galactosidic carbon sources, such as succinate, glycerol, and glucose (which support growth, but not enzyme synthesis).
These early studies showed that the enzyme synthesis rate was not uniquely determined by the composition of the medium. If glucose and TMG were added simultaneously to a culture of E. coli ML30 growing on succinate, there was almost no synthesis of -galactosidase; however, if glucose was added 20 mins after the addition of TMG, -galactosidase was synthesized for up to 130 generations (Fig. 1a). Thus, enzyme synthesis is bistable: Pre-induced cells remain induced, and non-induced cells remain non-induced.
Cohn and Horibata found that the existence of bistability depended crucially upon the existence of lac permease (LacY): It disappeared in lacY- (cryptic), but not lacZ-, mutants (Cohn and Horibata, 1959). They proposed that bistability occurred due to the destabilizing effect of the positive feedback generated by lac permease. More precisely, they observed that:
This permease not only accumulates galactosides intracellularly, but its synthesis is induced by the galactosides, which it accumulates. The permease may therefore be described as a “self-inducing” system, for which a generalized schema might be drawn.
This generalized schema, shown in Fig. 1b, was postulated before the molecular mechanism of induction was discovered by Jacob and Monod (Jacob and Monod, 1961).


Some years after the discovery of the induction mechanism, Babloyantz and Sanglier formulated a mathematical model, which was based on the Cohn-Horibata scheme, but described enzyme induction in terms of the now well established Jacob-Monod mechanism (Babloyantz and Sanglier, 1972). They showed that the model yielded the bistability observed in experiments. Chung and Stephanopoulos formulated a similar model, the main difference being that repressor-operator and repressor-inducer binding were assumed to be in quasi-equilibrium (Chung and Stephanopoulos, 1996). This model is given by the equations
| (1) | ||||
| (2) |
where and denote the intracellular and extracellular TMG concentrations, respectively; denotes the permease activity; is the specific growth rate on the non-galactosidic carbon source(s); is the specific rate of TMG uptake by the permease; is the net specific rate of TMG efflux by diffusion; and denote the specific rates of permease synthesis and degradation, respectively. The expression for is based on a molecular model which assumes that the lac operon contains one operator, and the lac repressor contains two identical inducer-binding sites (Yagil and Yagil, 1971). The parameter, , is the association constant for the repressor-inducer binding; and is jointly proportional to the intracellular repressor level and the association constant for repressor-operator binding. Evidently, is a measure of the repression, defined as the ratio, .


Although the experiments done by Cohn and coworkers provided clear evidence of bistability during growth on TMG and succinate/glucose, they did not investigate the variation of the enzyme levels with TMG and glucose levels, and the effect of glucose on the key molecular mechanisms of lac regulation, namely, CRP-cAMP activation and inducer exclusion. Recently, Ozbudak et al. addressed these issues by inserting two reporter operons into the chromosome of Escherichia coli K12 MG1655 (Ozbudak et al., 2004).
- •
The reporter lac operon, placed under the control of the lac promoter, coded for green fluorescent protein (GFP) instead of the lac enzymes. Thus, the GFP intensity of a cell provided a measure of the lac enzyme level.
- •
The reporter gat operon, placed under the control of the constitutive gat promoter, coded for the red fluorescent protein (RFP) instead of the gat enzymes. The RFP intensity of a cell provided a measure of its CRP-cAMP level.
To assess the effect of various TMG and glucose levels on lac bistability, they exposed non-induced and induced cells to a fixed concentration of succinate, and various concentrations of TMG and glucose. It was observed that:
- 1.
When the cells were grown in the presence of succinate and various concentrations of TMG, they exhibited bistability (Fig. 2a).
- 2.
This bistability persisted even if glucose was added to the mixture of succinate and TMG, but the thresholds increased with the concentration of extracellular glucose (Fig. 2b).
They also showed that both observations were mirrored by the bifurcation diagram for the modified Chung-Stephanopoulos model, obtained by neglecting the diffusive influx (i.e., the term, , in Eq. (1) was assumed to be zero).

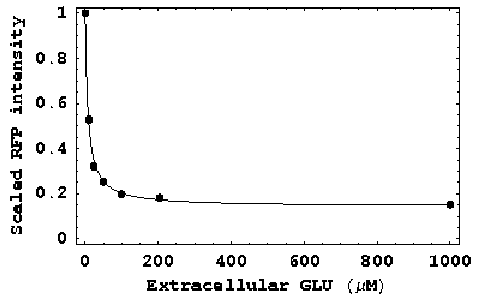
To quantify the lac repression due to glucose-mediated reduction of CRP-cAMP levels, they measured the average green and red fluorescence intensities of cells grown overnight in a medium containing a high concentration of TMG, a fixed concentration of succinate, and various concentrations of glucose. They found that the green and red fluorescence intensities, scaled by the corresponding values observed in a medium containing no glucose, were equal at all glucose concentrations (Fig. 3a). Furthermore, the normalized RFP intensity decreased 5-fold at saturating glucose concentrations (Fig. 3b). Ozbudak et al. assumed that the GFP intensity is proportional to the maximum lac induction rate, and the RFP intensity is proportional to the CRP-cAMP level. Given these two assumptions, it was concluded from Figs. 3a and b that the maximum lac induction rate is proportional the CRP-cAMP level, and decreases 5-fold at saturating concentrations of glucose. This is somewhat higher than the maximum possible cAMP-mediated repression in E. coli K12 MG1655. Recently, Kuhlman et al. found that during growth of this strain on saturating concentrations of 0.5% glucose and 1 mM IPTG, variation of the extracellular cAMP level from 0 to 10 mM produces no more than a 3-fold change in lac expression (Kuhlman et al., 2007, Fig. 1B).
The modified Chung-Stephanopoulos model considered by Ozbudak et al. provides an excellent point of departure for quantifying lac bistability. However, it suffers from three deficiencies.
The induction kinetics are incorrect


The Yagil and Yagil model of lac induction is not consistent with the structure of the lac operon and repressor. Indeed, the lac operon contains two auxiliary operators, and , in addition to the main operator, , and the lac repressor contains four (not two) inducer-binding sites (Lewis, 2005). Furthermore, these structural features play a crucial role in the formation of DNA loops, the key determinants of lac repression (Oehler et al., 1990; Oehler et al., 1994) and induction (Oehler et al., 2006). Molecular models taking due account of the 3 operators and 4 inducer-binding sites yield the lac induction rate
| (3) |
where is the association constant for repressor-inducer binding, and are related to the the repression stemming from repressor-operator binding and DNA looping, respectively (Kuhlman et al., 2007; Narang, 2007). Equation (3) yields good fits to the induction curves obtained with various strains (Narang, 2007, Fig. 11) and gratuitous inducers (Fig. 4a).
The diffusive influx is absent
It is well known that there is a diffusive influx. Herzenberg showed the existence of the diffusive influx by measuring the ONPG hydrolysis rate in wild-type and cryptic cells.11 1 The ONPG hydrolysis rate in intact cells is proportional to the rate at which ONPG (Herzenberg, 1959) or TMG (Maloney and Wilson, 1973, Fig. 1) permeate the cell. He found that even cryptic cells hydrolyzed ONPG, and the hydrolysis rate increased linearly with the extracellular ONPG concentration (Fig. 4b). It follows that gratuitous inducers can enter the cells by a permease-independent mechanism, which can formally be described by diffusive (first-order) kinetics.
Now, it may be permissible to neglect the diffusive influx in induced cells because such cells contain such large permease levels that the inducer is imported almost entirely by the permease. However, non-induced cells contain only 0.1% of the permease in induced cells (Maloney and Wilson, 1973). In such cells, it seems unlikely that the diffusive influx is negligible. As we show below, this conjecture is supported by the data.
The carrier efflux is absent


The existence of the carrier efflux was suggested in early studies with gratuitous inducers (Koch, 1964). However, Maloney and Wilson were the first to quantify its effect (Maloney and Wilson, 1973). To this end, they measured the steady state intracellular TMG levels in cells induced to various levels, and then exposed to chloramphenicol plus 0.24 mM extracellular TMG. The data obtained, shown in Fig. 5a, cannot be reconciled with models, such as the Chung-Stephanopoulos model, that account only for the carrier influx and diffusion. Indeed, since enzyme synthesis is blocked in the presence of chloramphenicol, the Chung-Stephanopoulos model implies that the steady state intracellular TMG level is given by the expression
| (4) |
obtained from (1) by ignoring the negligibly small dilution term. It follows that if cells containing various permease levels are exposed to chloramphenicol and a fixed extracellular TMG level, the intracellular TMG level, , should increase linearly with , the specific activity of the permease. However, the experiments show that increases linearly only if is small — it saturates at large values of (closed circles in Fig. 5a).
To resolve this discrepancy, Maloney and Wilson postulated that the permease catalyzes both influx and efflux, i.e., the steady state intracellular TMG level satisfies the equation
| (5) |
where the term, , accounts for the carrier efflux. They measured , , and showed that (5) yields a good fit to the data, provided is chosen to be 84 mM (full curve in Fig. 5a).
With the help of Eq. (5), they explained their data as follows. If the cells have low enzyme levels, the intracellular TMG levels are so small compared to that the carrier efflux is negligible. Thus, (5) reduces to (4), and the intracellular level increases linearly with (dashed line in Fig. 5a). However, at large enzyme levels, the intracellular TMG level becomes so high that the steady state is completely determined by the first two terms of (5), namely, the carrier influx and efflux. The intracellular TMG level is therefore independent of the enzyme activity.
The foregoing physical argument assumes that the carrier efflux is negligible in non-induced cells, and diffusion is negligible in induced cells. These assumptions are consistent with the mathematical model. Indeed, given Eq. (5) and the above parameter values, we can plot the two ratios, carrier efflux:diffusive efflux and diffusive influx:carrier influx, as a function of the enzyme activity (Fig. 5b). The plots show that in induced cells, the carrier influx is 1000 times the diffusive influx (full line), and the carrier efflux is almost 7 times the diffusive efflux (dashed line). In non-induced cells, on the other hand, the carrier efflux is negligible compared to the diffusive efflux, but the diffusive influx is comparable to the carrier influx.
It is therefore clear that the carrier efflux cannot be ignored in induced cells, and the diffusive influx cannot be neglected in non-induced cells. Since bistability entails the coexistence of steady states corresponding to both induced and non-induced cells, neither the carrier efflux nor the diffusive influx can be neglected. Yet, one or both the fluxes have been ignored in most models of lac bistability (Chung and Stephanopoulos, 1996; van Hoek and Hogeweg, 2006; Narang and Pilyugin, 2007; Ozbudak et al., 2004; Santillán et al., 2007; Tian and Burrage, 2005). To be sure, both fluxes were included in one of the models (Vilar et al., 2003), but their influence on bistability was not analyzed. The goal of this work is analyze this effect.
Recently, we studied the effect of DNA looping on the dynamics of the modified Chung-Stephanoupoulos model (Narang and Pilyugin, 2007). Here, we formulate and analyze an extended model of lac transcription that takes due account of DNA looping as well as the diffusive influx and the carrier efflux. We find that:
- 1.
The diffusive influx has no effect on the off threshold, but it significantly reduces the on threshold.
- 2.
The carrier efflux has no effect on the on threshold, but it significantly increases the off threshold.
We show that the on and off thresholds can be represented by simple analytical expressions.
2 Model

Fig. 6 shows the kinetic scheme of the model. Here, denotes lac permease; and denote the extracellular and intracellular inducer, respectively; GFP and RFP denote the green and red fluorescent protein synthesized by the reporter lac and constitutive gat operons, respectively; and GLU, SUC, GLY denote glucose, succinate, and glycerol. We assume that:
- 1.
The concentrations of the permease, intracellular inducer, GFP, and RFP, denoted , , , and , respectively, are based on the volume of the cells (mol L-1). The concentrations of the extracellular inducer and glucose, denoted and , respectively, are based on the volume of the reactor (mol L-1). The rates of all the processes are based on the volume of the cells (mol h-1 L-1). We shall use the term specific to emphasize this point.
The choice of these units implies that if the concentration of any intracellular component, , is mol L-1, then the evolution of in batch cultures is given bywhere and denote the specific rates of synthesis and degradation of in mol h-1 L-1, and is the specific growth rate in h-1.
- 2.
The specific growth rate is given by
where denotes the specific growth rate in the absence of glucose (i.e., in the presence of pure succinate), and is an increasing function of the extracellular glucose concentration, , satisfying , which accounts for the increase of the specific growth rate produced by addition of glucose to a culture growing on succinate.
- 3.
The saturation constant for carrier efflux, , is so large that . Hence, the net carrier-mediated specific uptake rate of is
where is the specific activity of the permease in the absence of glucose, and is a decreasing function of such that , which accounts for the reduction of the specific activity due to inducer exclusion.
- 4.
The net specific rate of expulsion of by diffusion follows the kinetics
- 5.
The intracellular inducer stimulates the transcription of the native and reporter lac operons, resulting in the synthesis of the lac enzymes and GFP, respectively.
- (a)
The specific synthesis rate of the permease, , is
(6) where is the specific synthesis rate in fully induced cells growing on succinate (); is a decreasing function of satisfying , which accounts for the repression of transcription due to reduction of CRP-cAMP levels in the presence of glucose; is the association constant for repressor-inducer binding; and characterize the repression due to repressor-operator binding and DNA looping, respectively.
The values of and are 20–50 and 1200, respectively, which reflect the fact that more than 95% of the total repression, , is due to the formation of DNA loops (Oehler et al., 1990; Oehler et al., 1994). The dissociation constant for repressor-inducer binding, , is 7–30 M for IPTG (Narang, 2007, Table 1). It is 10 times higher for TMG, based on a simple analysis of the data with Scatchard plots (Barkley et al., 1975, Table I). A similar estimate is obtained when Eq. (3) is used to fit the data shown in Fig. 4a. Assuming and , the best fits to this data are obtained when the dissociation constants for IPTG and TMG are assumed to be 24 and 470 M, respectively. - (b)
The specific synthesis rate of GFP is
where . This expression is obtained by assuming that the promoters of the reporter and native lac operons are identical, so that both operons have the same maximum specific synthesis rates in the absence of glucose, and are subject to the very regulation by CRP-cAMP and repressor-operator binding. However, the two operons differ with respect to regulation by DNA looping because the reporter lac operon lacks the auxiliary operator, . This precludes the formation of DNA loops by interaction between and .
Ozbudak et al. estimated the total repression of the lac reporter, , to be 170 (Ozbudak et al., 2004), which implies that .
- (a)
- 6.
The specific synthesis rate of RFP follows the constitutive kinetics
where is the specific synthesis rate of RFP in the absence of glucose, and is a decreasing function of such that , which accounts for the CRP-cAMP effect exerted in the presence of glucose.
- 7.
Protein degradation is negligible.
Given these assumptions, the mass balances yield
| (7) | ||||
| (8) | ||||
| (9) | ||||
| (10) |
It is convenient to rescale these equations. Ozbudak et al. scaled the GFP and RFP intensities by the corresponding intensities observed during steady exponential growth on succinate and excess TMG, but no glucose. Under these conditions, Eqs. (8)–(10) imply that , , and have the values , , and , respectively. Thus, we are led to define the dimensionless variables
If we scale the remaining variables, and , as follows,
we arrive at the dimensionless equations
| (11) | ||||
| (12) | ||||
| (13) | ||||
| (14) |
with the dimensionless parameters,
| (15) |
Here, is the ratio of the time constant for inducer expulsion by diffusion () relative to the time constant for growth on succinate (); is the extracellular inducer concentration, measured in units of ; and are the saturation constants for carrier uptake and expulsion, respectively, measured in units of .
The parameter, , is related to the steady state intracellular inducer level attained in fully induced cells exposed to chloramphenicol, succinate, and saturating inducer levels, if the carrier efflux is somehow abolished. Indeed, since h-1, min-1, and , the dilution term, , in (11) is negligibly small compared to the diffusive efflux, . The steady states are therefore given by the relations
| (16) | ||||
| (17) | ||||
| (18) | ||||
| (19) |
Equation (16) provides the steady state intracellular inducer level in cells exposed to fixed concentrations of chloramphenicol and succinate, and any given concentrations of extracellular inducer and glucose. If the carrier efflux is somehow abolished (), and the medium contains no glucose (), the steady state intracellular inducer level is given by the equation
| (20) |
If the cells are fully induced () and the extracellular inducer level is saturating (), the above equation becomes
where the first term was neglected because in induced cells, the diffusive influx is vanishingly small compared to the carrier influx. Thus, is the steady state intracellular inducer level, measured in units of , that is attained in fully induced cells exposed to chloramphenicol, succinate, and saturating levels of extracellular inducer, provided the carrier efflux is somehow abolished.
We can estimate the value of by observing that (20) is the dimensionless analog of (4). Indeed, multiplying (20) by yields the relation
which, upon comparison with (4), gives
Since moles min-1 mL-1 in fully induced cells, we conclude that mM.
If the medium contains the inducer, succinate, and possibly glucose, but no chloramphenicol, enzyme synthesis is not blocked. Instead, it responds to the prevailing intracellular inducer concentration, and the enzyme level evolves toward the steady state given by (17). In this case, the steady state intracellular inducer level satisfies the relation
| (21) |
obtained by substituting (17) in (16). Here, captures the cumulative effect of glucose due to inducer exclusion, catabolite repression, and enzyme dilution; and is a measure of the steady state intracellular inducer level in fully induced cells exposed to succinate, glucose, and saturating inducer levels.
We are particularly interested in:
- 1.
The variation of the steady states with the extracellular inducer concentration at any given glucose level (for example, , in Fig. 2a). This is completely determined by Eq. (21): Given any and , the equation can be solved for , which can then be substituted in (17)–(18) to obtain the corresponding and . We shall refer to (21) as the equilibrium condition.
- 2.
The variation of the thresholds with the extracellular glucose concentration (Fig. 2b). These thresholds are the points at which the steady state bifurcates (i.e., changes its stability or multiplicity). It is shown in Appendix A that a steady state bifurcates only if it satisfies the relation
(22) We shall refer to this equation as the bifurcation condition.
Thus, the steady states are completely determined by the equilibrium condition, whereas the thresholds must satisfy the equilibrium and bifurcation conditions.
3 Results and Discussion
3.1 The effect of dilution
To simulate the effect of the diffusion influx and the carrier efflux, we need the function, . In the course of estimating this function, we shall also resolve the discrepancy between the magnitudes of the cAMP-mediated repression reported by Ozbudak et al. and Kuhlman et al.
It follows from (18) and (19) that when the cells are grown in the presence of excess TMG, the ratio of the steady state GFP and RFP intensities is given by
Since this ratio was observed to be 1 all glucose concentrations (Fig. 3a), the lac and gat operons respond identically to CRP-cAMP, i.e.,
| (23) |
Moreover, the steady state RFP and GFP intensities are given by the equation
| (24) |
It follows that the 5-fold decline of and at saturating glucose concentrations, shown in Fig. 3b, represents the combined effect of reduced CRP-cAMP levels and enhanced dilution (as opposed to the the sole effect of reduced CRP-cAMP levels).
The effect of the reduced CRP-cAMP level, , cannot be estimated unless the effect of enhanced dilution, , is known. Ozbudak et al. did not report the specific growth rates at various glucose concentrations, but experiments show that (Narang et al., 1997):
- •
When E. coli K12 is grown on saturating levels of succinate + glucose, the cells consume only glucose during the first exponential growth phase.
- •
The maximum specific growth rate on glucose (0.74 h-1) is roughly 2 times that on succinate (0.44 h-1).
It follows that at saturating glucose concentrations, . Since under these conditions, (24) yields . Thus, roughly half of the 5-fold decline in Fig. 3b is due to the enhanced dilution rate at saturating glucose concentrations. Reduction of the CRP-cAMP levels accounts for the remaining 2.5-fold decline, which is consistent with the data obtained by Kuhlman et al.
In view of (24), we can assume that
| (25) |
which represents the best fit obtained to the data in Fig. 3b.
It remains to specify the function, , which characterizes the intensity of inducer exclusion. We assume that the saturation constants for inducer exclusion and cAMP activation/dilution are the same (7.6 M). Experiments show that the lactose uptake rate decreases 2-fold in the presence of high glucose concentrations (McGinnis and Paigen, 1969, Fig. 3). Thus, we are led to postulate the expression,
| (26) |
We shall discuss the implications of the foregoing assumption later on.
| Parameter | Value and reference |
|---|---|
| 0.68 mM (Ozbudak et al., 2004) | |
| 84 mM (Maloney and Wilson, 1973) | |
| 0.3 mM for TMG (Herzenberg, 1959) | |
| 0.007 mM for IPTG (Oehler et al., 2006) | |
| 40 (Oehler et al., 1994) | |
| 1200 (Oehler et al., 1994) | |
| 130 (Ozbudak et al., 2004) | |
| See Eq. (25) | |
| See Eq. (26) | |
| 310/ (Maloney and Wilson, 1973) |
3.2 The effect of the diffusive influx and carrier efflux
All the parameters required to study the effect of the diffusive influx and carrier efflux are now available (Table 1). Most of the simulations shown below were done with the parameter values for TMG. However, at the end of this section, we shall show the simulation for IPTG, and compare it with the experimental data.
We shall begin by considering the base case of no diffusive influx or carrier efflux. To this base case, we shall add the diffusive influx and the carrier efflux, one at a time, to examine their effects on the steady states and the thresholds. Finally, we shall show that that the general model containing both fluxes is essentially a composite of the two special cases accounting for the diffusive influx and carrier efflux.
3.2.1 No diffusive influx or carrier influx
In the absence of the diffusive influx and the carrier efflux, the equilibrium condition (21) becomes
| (27) |
We can determine the variation of the steady states with at any given by solving this equation for , and substituting it in (17) and (18). However, this approach can only be implemented numerically. It is more convenient to solve (27) for , thus obtaining
| (28) |
The variation of the steady state , , and with is then given by the parametric curves, , , and , respectively, where , , and are given by (17), (18), and (28), respectively.


Figure 7a shows the variation of the steady state and with at . Both variables are bistable over the very same 10-fold range of extracellular TMG concentrations. Furthermore, the GFP intensity and enzyme activity of the induced cells are identical (), but the GFP intensity of non-induced cells is significantly higher than their enzyme activity.
The foregoing trends can be understood in terms of the variation of the intracellular TMG levels with (Fig. 7b). In non-induced cells, the GFP intensity is significantly higher than the enzyme activity because the intracellular TMG levels are so small compared to that the reporter and native lac operons are transcribed at their basal rates. Since the reporter lac operon lacks , its basal transcription rate, , is 7 times higher than that of the native lac operon, . In induced cells, on the other hand, the inducer levels are so high that the repressor is completely inactivated, and both operons are transcribed at the very same (maximal) rates. Finally, the thresholds for and are the same because (17) and (18) imply that and are increasing functions of . Hence
are zero precisely when . Since is zero at and , so are and .


We are particularly interested in the variation of the on and off thresholds with , the concentration of extracellular glucose. In this regard, it is worth noting two points. First, since and always have the same thresholds, it suffices to focus on either one of these variables. In the simulations that follow, we present only the enzyme activities. Second, although we are interested in the variation of the thresholds with , we shall begin by determining their variation with . As we show below, this immediately yields their variation with because is a monotonically decreasing function of .
In the absence of the carrier efflux, the bifurcation condition (22) becomes
| (29) |
The thresholds satisfy (27) and (29), which imply that
| (30) |
It is shown in Appendix B that (30) has exactly two positive roots, , and they satisfy the relation, . The loci of the on and off thresholds are therefore given by the equations
| (31) |
which define two decreasing curves on the -plane (Fig. 8a). Furthermore:
- •
The on and off thresholds become infinitely large when approaches and , respectively (dashed lines in Fig. 8a).
- •
When , (31) reduces to
Thus, the curves are hyperbolic, and the ratio of the on threshold to the off threshold equals the constant, .
Taken together, these results imply that if , there is bistability with finite on and off thresholds (Fig. 7); if , there is no bistability (Fig. 8b); and finally, if , there is bistability with a finite off threshold, but no on threshold (Fig. 8c). We shall elaborate on the last case shortly.
The variation of the off and on thresholds with the glucose level, , follows immediately from Fig. 8a. Indeed, as increases from 0 to 1000 M, decreases from to , shown by the dotted vertical lines in Fig. 8a. It follows that as increases, the on and off thresholds as well as the ratio of the on to off threshold increase. Furthermore, the off threshold exists for all M, whereas the on threshold ceases to exist for some M.
We can get explicit expressions for the variation of the thresholds with by letting in (31), thus obtaining
Since decreases with , increases with . Thus, on the -plane, the thresholds are represented by two increasing curves (Fig. 8d). As expected, these curves diverge with increasing glucose levels, with the on threshold becoming unbounded at M.
The disappearance of the on threshold at intermediate values of is an example of irreversible bistability (Laurent and Kellershohn, 1999, p. 421). Indeed, it is evident from Fig. 8c that synthesis of the enzymes in induced cells can be switched off by gradually decreasing the extracellular inducer concentration. However, once the enzyme synthesis has been switched off in this manner, it cannot switched on again by any gradual increase of the extracellular inducer concentration. Irreversible bistability is thought to play an important role in development because it furnishes a mechanism for changing the cellular phenotype permanently. However, it is biologically implausible in the case of the lac operon. Due to the existence of the diffusive influx, non-induced (and in fact, even cryptic cells) can always be induced by exposing them to sufficiently high extracellular inducer levels (Fig. 4a). We show below that irreversible bistability disappears in the presence of the diffusive influx.
3.2.2 Diffusive influx, but no carrier efflux
In the absence of the carrier efflux, (21) becomes
| (32) |
which can be solved for to obtain
| (33) |
The variation of the steady state , , and with is given by the parametric curves, and , respectively, where and are given by (17) and (33), respectively.
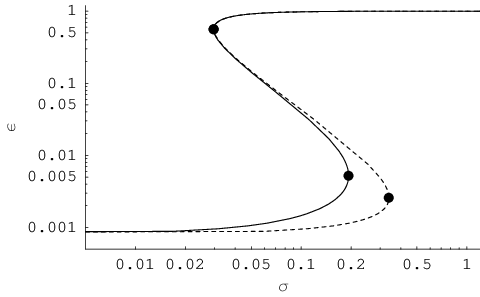
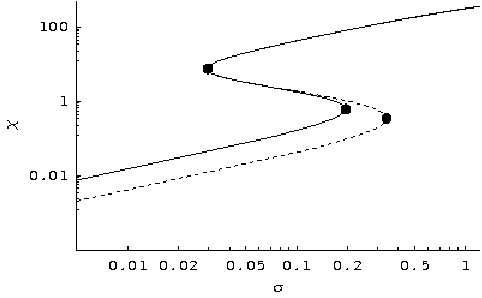
Figure 9a compares the variation of the steady state permease activities with at in the presence (full curve) and absence (dashed curve) of the diffusive flux. It is evident that the diffusive flux has no effect on the off threshold, but it significantly reduces the on threshold. The physical reason for this is as follows. The off threshold is a property of the induced cells. These cells contain such high permease levels that the diffusive influx makes virtually no contribution to the accumulation of TMG (see upper branches of the curves in Fig. 9b). In contrast, the on threshold is a property of the non-induced cells, which contain such low enzyme levels that the diffusive influx significantly improves the accumulation of TMG (see lower branches of the curves in Fig. 9b). This enhanced accumulation of TMG decreases the on threshold.
We have shown above that in the absence of glucose, the diffusive influx influences only the on threshold. Is this true even in the presence of glucose? We can address this question by constructing the loci of the on and off thresholds on the -plane. To this end, observe that the thresholds satisfy the equilibrium condition (32) and the bifurcation condition (29). These two equations can be solved for and to obtain the relations
| (34) | ||||
| (35) |
which provide the parametric representation, , of the thresholds on the -plane. The full curve in Fig. 10a shows a plot of this representation. It consists of an upper branch and a lower branch, which represent the on and off thresholds, respectively. Since these two branches meet in a cusp, bistability is reversible whenever it exists: Either both or none of the thresholds occur at any given . As expected, irreversible bistability, which corresponds to the existence of only one of the thresholds, disappears in the presence of the diffusive flux. Importantly, this conclusion does not depend on the precise values of the parameter values chosen for the simulations. It is shown in Appendix C that the geometry of the curves representing the thresholds is preserved, regardless of the parameter values.


To address the question posed above, it is useful to compare the thresholds in the presence of the diffusive influx with those obtained in its absence (dashed curves in Fig. 10a). This comparison shows that there are 3 distinct regimes. When , the full and dashed curves coincide, i.e., the diffusive influx has no effect on both thresholds. At large , the permease is so active that even in the non-induced cells, the diffusive influx makes no contribution to inducer accumulation. When 2000, the lower full and dashed curves coincide, but the upper full curve is significantly lower than the upper dashed curve. The influence of the diffusive influx is therefore identical to that observed at : It has no effect on the off threshold, and significantly decreases the on threshold. At these intermediate , the enzyme activity of the induced cells remains so large that the diffusive influx makes no contribution to inducer accumulation, but the enzyme activity of the non-induced cells becomes so small that the diffusive influx does enhance inducer accumulation. Finally, when , the enzyme activity becomes so small that the diffusive flux contributes significantly to inducer accumulation in both non-induced and induced cells. In fact, at sufficiently small , the inducer accumulates almost entirely by diffusion, i.e., . Since the intracellular TMG level is independent of the enzyme level, there is no positive feedback, and hence, no bistability. This is manifested in Fig. 10a by the formation of a cusp at which the two thresholds merge.
The qualitative variation of the thresholds with the glucose concentration can be inferred from Fig. 10a. Indeed, as the glucose concentration is increased from 0 to 1000 M, decreases from to , shown by the dotted lines in the figure. Evidently, as increases, both thresholds increase, but the ratio of the on to off threshold decreases (in contrast to the increase observed in the absence of diffusive flux).
The quantitative variation of the thresholds with is obtained by observing that (35) yields
| (36) |
The locus of the thresholds on the -plane is therefore given by the parametric representation, , where and are given by (36) and (34), respectively. Figure 10b shows that this representation yields two increasing curves that approach each other as increases.
3.2.3 Carrier efflux, but no diffusive influx
In this case, (21) becomes
| (37) |
which can be solved for to obtain
| (38) |
The variation of the steady state and with is given by the parametric curves, and , respectively, where and are given by (17) and (38), respectively.


Figure 11a shows the variation of the enzyme activity with at in the presence (full curve) and absence (dashed curve) of the carrier influx. Evidently, the carrier efflux has no effect on the on threshold, but it significantly increases the off threshold. This is because is so large that the carrier efflux is negligible in non-induced cells, which contain relatively small enzyme and inducer levels (Fig. 11b). However, the carrier efflux significantly reduces the the intracellular TMG level of the induced cells. The net effect of this reduction is to increase the off threshold of the induced cells.
It is instructive once again to study the variation of the thresholds with . The thresholds satisfy the equilibrium condition (37) and the bifurcation condition (22), which can be solved for and to obtain
| (39) | ||||
| (40) |
These relations define the parametric representation, , of the bifurcation curve on the -plane.
Figure 12a compares the thresholds in the presence of carrier efflux (full curves) with those obtained in its absence (dashed curves). Evidently, when , the carrier efflux has no effect on both thresholds. Under this condition, the enzyme activity and the intracellular TMG level are so small that carrier efflux is negligible even in the induced cells. As increases, carrier efflux from the induced cells becomes more significant, and the off threshold becomes progressively larger than that predicted in the absence of the carrier flux. When , the enzyme activity is so large that even the non-induced cells are subject to carrier efflux. At sufficiently large , the off threshold merges with the on threshold at a cusp, beyond which there is no bistability. The bistability disappears because under this condition, the intracellular TMG level is
which is independent of the enzyme level. The destabilizing effect of positive feedback therefore vanishes, and the prospect of bistability is eliminated.


Once again, the qualitative variation of the thresholds with can be inferred from Fig. 12a. As increases from 0 to 1000 M, decreases from to , shown by the dotted lines in the figure. Evidently, as increases, so do the on and off thresholds, as well as the ratio of the on to off threshold. Furthermore, since diffusive influx is absent, there is irreversible bistability: The off threshold exists for all , whereas the on threshold disappears at some M.
The quantitative variation of the thresholds with follows from (39), which yields
| (41) |
The variation of the thresholds with is given by the parametric representation, , where and are given by (41) and (40), respectively. This representation defines two increasing curves departing from each other (Fig. 12b).
3.2.4 Diffusive influx and carrier efflux
In this case, the steady state intracellular TMG level is given by (21), which can be solved for to obtain
| (42) |
where . The variation of the steady state and with is given by the parametric curves, and , respectively, where and are given by (17) and (42), respectively.


Fig. 13 compares the steady state profiles obtained at in the presence of the diffusive influx and carrier efflux (full curves) with those obtained in the presence of the diffusive influx only (short-dashed curves) and the carrier efflux only (long-dashed curves). It is evident that the upper and lower branches of the steady state curve, representing the induced and non-induced cells, respectively, are a composite of the steady states obtained in the presence of the diffusive influx and carrier efflux. Indeed, the lower branch of the full curve coincides with the lower branch of short-dashed curve, and the upper branch of the full curve coincides with the upper branch of the long-dashed curve. It follows that the steady states and threshold of the non-induced (resp., induced) cells is well approximated by the model accounting for only the diffusive flux (resp., carrier efflux). The reason for this is clear from the above discussion of the special cases. In the absence of glucose, the diffusive influx influences the TMG accumulation of non-induced cells only — it is vanishingly small in induced cells. Likewise, carrier efflux influences the TMG accumulation of induced cells only — it plays no role in non-induced cells.
The foregoing arguments were based on the steady state profiles obtained at , i.e., . It turns out that they are true at almost all . This becomes clear if we compare the thresholds for the general case with the thresholds obtained in the presence of diffusive influx or carrier efflux. The thresholds for the general case satisfy (21) and (22), which can be rewritten as
| (43) | ||||
| (44) |
The first equation can be solved to obtain , which can then be substituted in (44) to obtain . These functions determine the thresholds via the parametric representation, .


Figure 14a compares the thresholds thus obtained (full curves) with the thresholds obtained in the presence of diffusive influx (short-dashed curves) and carrier efflux (long-dashed curves). The thresholds exist only on a finite interval — they terminate in a cusp at both small and large . Over almost its entire range of existence, the upper branch of the full curve overlaps with the upper branch of the short-dashed curve, which represents the on threshold in the presence of the diffusive flux. Likewise, the lower branch of the full curve coincides with the lower branch of the long-dashed curve, which represents the off threshold in the presence of the carrier flux. Thus, the thresholds of the general case are a composite of the two special cases. The on (resp., off) threshold is well approximated by (34) and (35) [resp., (39) and (40)], which represent the thresholds in the presence of only the diffusive flux (resp., carrier efflux).
It is evident from Fig. 14a that as increases, both thresholds increase, but the ratio of on to off thresholds can increase, decrease, or pass through a maximum. For the parameter values shown in Table 1, and are such that the ratio passes through a maximum. The precise variation of the thresholds with is given by the parametric curve, , where
a relation that follows immediately from (44). This parametric curve consists of two increasing curves that diverge at low glucose concentrations, and converge at high glucose concentrations (Fig. 14b).
3.2.5 Comparison of the model simulations with the data for TMG
Comparison of the model simulations (dashed lines in Fig. 2b) with the data shows that the simulated off thresholds are higher, and the simulated on thresholds are lower, than the corresponding thresholds observed experimentally. Part of this discrepancy probably stems from the fact that the parameter values, which correspond to various strains of E. coli, are somewhat different from those shown in Table 1. However, the analysis of the data suggests that there are two additional sources of the discrepancy.

Dependence of on the the enzyme activity
The model assumes that the effect of inducer exclusion, characterized by the function , is completely determined by the extracellular glucose level. However, the data in Fig. 15 implies that also depends on the activity of the permease. The open triangles in the figure show the steady state intracellular TMG levels in cells induced to various levels, and then exposed to a carbon-free medium containing 1 mM TMG. The full triangles show the steady state intracellular levels attained when the carbon-free medium contains 1 mM TMG and 10 mM -methylglucoside (MG), a non-metabolizable analog of glucose that mimics its inducer exclusion effect. It is clear from the data that inducer exclusion is significant in cells containing low enzyme levels, but it disappears in fully induced cells.
If is completely determined by the extracellular glucose concentration, there is no combination of model parameters that can capture the data in Fig. 15. To see this, observe that the data was obtained in a carbon-free medium, which prevents efficient enzyme synthesis. The appropriate equation for modeling the data is therefore given by the following variant of Eq. (5)
| (45) |
Since the extracellular TMG level, , is constant (1 mM), the above equation implies that at any given , the enzyme activity in the absence of MG (or glucose) is times the activity in the presence of MG. This contradicts the data. At mM, for instance, the enzyme activity in the absence of MG is roughly half the activity in the presence of 10 mM MG. However, at mM, the activities are the same in the absence and presence of MG.
The molecular explanation for the data in Fig. 15 suggests that depends not only on , but also on the prevailing enzyme level (Mitchell et al., 1982). Indeed, inducer exclusion occurs because the uptake of MG or glucose results in the formation of dephosphorylated enzyme IIA (a transport enzyme for glucose), which inhibits lac permease by binding to it. In fully induced cells, the permease level is so high that most of it is essentially free of IIA. As the permease level decreases, so does the inhibition due to LacY-IIA binding.22 2 No data was obtained at scaled enzyme activities below because the recombinant strain used in these experiments was quasi-constitutive. Thus, the magnitude of the inducer exclusion effect depends on the prevailing permease level.
The model, which ignores the dependence of on the permease level, provides a good fit to the data obtained in the absence of -MG (full line in Fig. 15). However, it fails to capture the data obtained in the presence of -MG (dashed line in Fig. 15). It overestimates the inducer exclusion effect in induced cells, and underestimates this effect in cells containing lower enzyme levels. Consequently, the observed off threshold is expected to be lower, and the observed on threshold is expected to be higher, than the corresponding thresholds predicted by the model.


Dependence of on the enzyme activity
The model assumes that in the absence of glucose, the specific growth rate is a fixed constant, . However, the data shows that the specific growth rate varies significantly with the enzyme level of the cells (Fig. 16a). When the cells are exposed to 0.5 mM TMG, the specific growth rate is 30% lower than that of non-induced cells, and the graph suggests that the specific growth rate declines further at higher extracellular TMG levels. The reduced specific growth rate of the induced cells serves to decrease the off threshold because the lower the specific growth rate, the higher the enzyme and intracellular TMG levels.
In earlier work, we studied the dynamics of growth on lactose (Narang and Pilyugin, 2007). There, we showed that bistability is suppressed during growth on lactose because the specific growth rate increases with the enzyme level, thus enhancing the stabilizing effect of dilution. Since the specific growth rate decreases with the enzyme level during growth on TMG, it is plausible to expect that in this case, the stabilizing effect of dilution is depressed, and the bistable regime is enlarged.
3.2.6 Comparison of the model simulations with the data for IPTG
The above arguments suggest that the discrepancy between the data and the simulations would be reduced if the experiment was performed in the absence of glucose with a gratuitous inducer that does not result in a significant reduction of the specific growth rate. This conclusion seems to be consistent with the data.


It turns out that when the cells are grown in the presence of IPTG, the specific growth rate of the induced cells is only 5% smaller than the specific growth rate of the non-induced cells (Fig. 16b). Recently, Laurent et al. measured the variation of the enzyme activity with the extracellular IPTG levels in the absence of glucose (Fig. 17a). They found that the mean activity does not display the discrete all-or-none response observed by Ozbudak et al. (presumably due to the physiological heterogeneity of the cells and the inherent stochasticity of the induction process). However, there is clear evidence of bistability in the 5-fold range, 0.3–1.5 M, which is significantly smaller than the 10-fold range shown in Fig. 2a. The IPTG concentrations supporting bistability are significantly smaller than those observed by Ozbudak et al — the off and on thresholds are 0.3 and 1.5 M (compared to 3 and 30 M in Fig. 2a). This is because the affinity of IPTG for the repressor is an order of magnitude higher than that for TMG. Simulation of the model with M yields results that are in reasonable agreement with the data obtained by Laurent et al (Fig. 17b).
It remains to be seen if an extension of the model, accounting for the dependence of and on the prevailing enzyme level, can resolve the discrepancy with respect to the data for TMG.
4 Conclusions
Analysis of the experimental data shows that the diffusive influx and carrier efflux have a profound effect on inducer accumulation in non-induced and induced cells, respectively. Since bistability entails the coexistence of steady states corresponding to both non-induced and induced cells, neither one of these fluxes can be neglected. We analyzed a model of lac bistability taking due account of the diffusive influx and carrier efflux. We find that:
- 1.
The diffusive influx decreases the on threshold.
- 2.
The carrier influx increases the off threshold.
- 3.
Over a wide range of permease activities, the diffusive influx has no effect on the off threshold, and the carrier efflux has no effect on the on threshold. Since each of these fluxes influences only one of the thresholds, the combined effect of these fluxes can be captured by simple analytical expressions corresponding to two limiting cases.
- 4.
Simulations of the model show good agreement with the data for IPTG.
- 5.
There is a significant discrepancy with respect to the data for TMG. Analysis of the data suggests that this discrepancy is due to the dependence of the inducer exclusion effect and the specific growth rate on the prevailing lactose enzyme levels.
References
- Babloyantz and Sanglier (1972) Babloyantz, A., Sanglier, M., 1972. Chemical instabilities of “all-or-none" type in -galactosidase induction and active transport. FEBS Lett. 23, 364–366.
- Barkley et al. (1975) Barkley, M. D., Riggs, A. D., Jobe, A., Burgeois, S., Apr 1975. Interaction of effecting ligands with lac repressor and repressor-operator complex. Biochemistry 14 (8), 1700–1712.
- Chung and Stephanopoulos (1996) Chung, J. D., Stephanopoulos, G., 1996. On physiological multiplicity and population heterogeneity of biological systems. Chem. Eng. Sc. 51, 1509–1521.
- Cohn and Horibata (1959) Cohn, M., Horibata, K., 1959. Inhibition by glucose of the induced synthesis of the -galactoside-enzyme system of Escherichia coli. Analysis of maintenance. J. Bacteriol. 78, 601–612.
- Dekel and Alon (2005) Dekel, E., Alon, U., Jul 2005. Optimality and evolutionary tuning of the expression level of a protein. Nature 436 (7050), 588–592.
- Herzenberg (1959) Herzenberg, L. A., Feb 1959. Studies on the induction of -galactosidase in a cryptic strain of Escherichia coli. Biochim Biophys Acta 31 (2), 525–538.
- Jacob and Monod (1961) Jacob, F., Monod, J., 1961. Genetic regulatory mechanisms in the synthesis of proteins. J. Mol. Biol. 3, 318–356.
- Koch (1964) Koch, A. L., Jan 1964. The role of the permease in transport. Biochim Biophys Acta 79, 177–200.
- Kuhlman et al. (2007) Kuhlman, T., Zhang, Z., Saier, M. H., Hwa, T., Apr 2007. Combinatorial transcriptional control of the lactose operon of Escherichia coli. Proc Natl Acad Sci U S A 104 (14), 6043–6048.
- Laurent et al. (2005) Laurent, M., Charvin, G., Guespin-Michel, J., Dec 2005. Bistability and hysteresis in epigenetic regulation of the lactose operon. Since Delbrück, a long series of ignored models. Cell Mol Biol (Noisy-le-grand) 51 (7), 583–594.
- Laurent and Kellershohn (1999) Laurent, M., Kellershohn, N., Nov 1999. Multistability: a major means of differentiation and evolution in biological systems. Trends Biochem Sci 24 (11), 418–422.
- Lewis (2005) Lewis, M., Jun 2005. The lac repressor. C R Biol 328 (6), 521–548.
- Maloney and Wilson (1973) Maloney, P. C., Wilson, T. H., Dec 1973. Quantitative aspects of active transport by the lactose transport system of Escherichia coli. Biochim Biophys Acta 330 (2), 196–205.
- McGinnis and Paigen (1969) McGinnis, J. F., Paigen, K., Nov 1969. Catabolite inhibition: a general phenomenon in the control of carbohydrate utilization. J Bacteriol 100 (2), 902–913.
- Mitchell et al. (1982) Mitchell, W. J., Misko, T. P., Roseman, S., Dec 1982. Sugar transport by the bacterial phosphotransferase system. regulation of other transport systems (lactose and melibiose). J Biol Chem 257 (23), 14553–14564.
- Monod (1947) Monod, J., 1947. The phenomenon of enzymatic adaptation and its bearings on problems of genetics and cellular differentiation. Growth 11, 223–289.
- Narang (2007) Narang, A., 2007. Effect of DNA looping on the induction kinetics of the lac operon. J. Theoret. Biol., 247, 695–712.
- Narang et al. (1997) Narang, A., Konopka, A., Ramkrishna, D., 1997. New patterns of mixed substrate growth in batch cultures of Escherichia coli K12. Biotech Bioeng 55, 747–757.
- Narang and Pilyugin (2007) Narang, A., Pilyugin, S. S., October 2007. Bistability of the lac operon during growth of Escherichia coli on lactose or lactose + glucose., Bull. Math. Biol., accepted.
- Novick and Weiner (1957) Novick, A., Weiner, M., 1957. Enzyme induction as an all-or-none phenomenon. Proc. Nat. Acad. Sci. USA 43, 553–566.
- Oehler et al. (2006) Oehler, S., Alberti, S., Müller-Hill, B., 2006. Induction of the lac promoter in the absence of DNA loops and the stoichiometry of induction. Nucleic Acids Res 34 (2), 606–612.
- Oehler et al. (1994) Oehler, S., Amouyal, M., Kolkhof, P., von Wilcken-Bergmann, B., Müller-Hill, B., Jul 1994. Quality and position of the three lac operators of E. coli define efficiency of repression. EMBO J 13 (14), 3348–3355.
- Oehler et al. (1990) Oehler, S., Eismann, E. R., Krämer, H., Müller-Hill, B., Apr 1990. The three operators of the lac operon cooperate in repression. EMBO J 9 (4), 973–979.
- Ozbudak et al. (2004) Ozbudak, E. M., Thattai, M., Lim, H. N., Shraiman, B. I., van Oudenaarden, A., 2004. Multistability in the lactose utilization network of Escherichia coli. Nature 427, 737–740.
- Santillán et al. (2007) Santillán, M., Mackey, M. C., Zeron, E. S., Jun 2007. Origin of bistability in the lac operon. Biophys J 92 (11), 3830–3842.
- Spiegelman (1948) Spiegelman, S., 1948. Differentiation as the controlled production of unique enzymatic patterns. In: Danielli, J. F., Brown, R. (Eds.), Growth in relation to differentiation and morphogenesis. No. II in Symposium of the Society for Experimental Biology. Academic Press, pp. 286–325.
- Tian and Burrage (2005) Tian, T., Burrage, K., 2005. A mathematical model for genetic regulation of the lactose operon. In: Gervasi, O., Gavrilova, M. L., Kumar, V., Lagana, A., Lee, H. P., Mun, Y., Taniar, D., Tan, C. J. K. (Eds.), Lecture Notes in Computer Science. Vol. 3841. Springer.
- van Hoek and Hogeweg (2006) van Hoek, M. J. A., Hogeweg, P., Oct 2006. In silico evolved lac operons exhibit bistability for artificial inducers, but not for lactose. Biophys J 91 (8), 2833–2843.
- Vilar et al. (2003) Vilar, J. M. G., Guet, C. C., Leibler, S., May 2003. Modeling network dynamics: the lac operon, a case study. J Cell Biol 161 (3), 471–476.
- Yagil and Yagil (1971) Yagil, G., Yagil, E., 1971. On the relation between effector concentration and the rate of induced enzyme synthesis. Biophys. J. 11, 11–27.
Appendix A Necessary condition for a bifurcation
The Jacobian of Eqs. (11)–(14) at any steady state is
Evidently, two of the eigenvalues are . Hence, the steady state is stable if and only if the remaining two eigenvalues corresponding to the submatrix
have negative real parts. Since the trace is always negative, stability results whenever the determinant is positive. Hence, the necessary condition for a bifurcation is that the determinant be zero, that is,
Since , the bifurcation condition can be approximated by the relation
where and . This is the same as Eq. (22).
The asymptotic dynamics of Eqs. (11)–(14) reduces to the stability analysis of its steady states. Indeed, Eqs. (11)–(12) are uncoupled from equations (13)–(14). A direct calculation shows that the subsystem (11)–(12) has a negative divergence (i.e. the trace of the Jacobian is negative) in the entire state space. An application of the Bendixson-Dulac criterion eliminates the possibility of periodic orbits and saddle connections, hence any solution of (11)–(12) converges to some steady state. It follows immediately that the solution of (13)–(14) also converges to the corresponding steady state.
Appendix B The positive roots of Eq. (30)

We wish to show that has exactly 2 positive roots, , and is positive if and only if . This assertion has the a simple geometric interpretation. Since is a sigmoidal function for sufficiently large and , there are only two lines passing through the origin that touch the graph of , and they do so at the two points, and (Fig. 18). Furthermore, for any , the slope of the line passing through and is smaller than .
The formal proof is obtained by observing that , and at large ,
It follows that has at least 2 positive roots. In fact, it has exactly 2 positive roots because it has only 1 extremum on . Indeed,
which is zero if and only if , i.e., , where is the unique inflection point of the sigmoidal function, .
Appendix C Bifurcation diagram for diffusive influx

We wish to show that regardless of the parameter values, the functions, and , defined by (34) and (35), respectively, have the geometry shown in Fig. 19. It follows that as increases from , increases and decreases until a cusp forms at the point where . Beyond , decreases and increases until they approach 0 and , respectively. Thus, the variation of the thresholds on the -plane has the geometry shown in Fig. 10a, regardless of the parameter values.
Appendix D Bifurcation diagram for carrier influx

We show below that regardless of the parameter values, and , as defined by (39) and (40) have the geometry shown in Fig. 20. Hence, the variation of the thresholds on the -plane always has the geometry shown in Fig. 12a.
To see this, observe that since has exactly two positive zeros, (Appendix B), so does . Furthermore, has a unique maximum on . Indeed, if we let , can be rewritten as
which implies that
Now, the polynomial changes sign exactly once in the interval because , for large , and for all (i.e. is a concave function). Thus, the function has a unique maximum.
The function, , becomes infinite at points, , lying within . Indeed, (40) yields
so that if and only if
Now, becomes zero if and only if . It follows that is sufficiently large, at two points, lying within .
Finally, has exactly 1 extremum in which is attained at the very same value of that maximizes . Indeed,
where the term in parentheses is positive whenever because
It follows that and have opposite signs in the interval , and the functions and attain their extrema at the same values of . Since attains a unique maximum in the interval , so does .