Accumulation and extraction of ultracold neutrons from a superfluid helium converter coated with fluorinated grease
Abstract
We report experiments on the production of ultracold neutrons (UCN) in a converter of superfluid helium coated with fluorinated grease. We employed our technique of window-free extraction of accumulated UCN from the helium, in which they were produced by downscattering neutrons of a cold beam from the Munich research reactor. The time constant for UCN passage through the same extraction aperture as in a previous experiment was a factor two shorter, despite a lower mean velocity of the accumulated UCN in the present experiments. A time-of-flight measurement of the cold neutron spectrum incident on the converter allowed us to estimate the multi-phonon contribution to the UCN production. The UCN production rate inferred from two methods agrees with the theoretical expectation.
PACS numbers: 78.70.Nx, 28.20.Fc, 29.25.Dz, 61.12.Ha
Keywords: ultracold neutrons, UCN, UCN sources
∗email: zimmer@ill.fr
1 Introduction
Ultracold neutrons (UCN) have energies in the neV range and velocities up to a few meters per second. When impinging on suitable materials they undergo total reflection under any angle of incidence and can therefore be trapped in bottles and manipulated for a long time (see the books [1, 2] for an introduction to the physics of UCN). Owing to this feature UCN have become very useful in various fundamental investigations of neutron properties, with strong implications for particle physics and cosmology. The longstanding search for the neutron electric dipole moment investigates CP-violation beyond the standard model of particle physics [3, 4]. The accurate determination of the neutron lifetime is required for a detailed understanding of big bang nucleosynthesis [5], and to investigate strength and structure of the semi-leptonic weak interaction within the first quark family (see, e.g., the workshop proceedings [6, 7]). New topics with UCN are, among others, the demonstration of quantum levels of neutrons in the earth’s gravitational field [8], and even more recently, the search for neutron - mirror neutron transitions [9, 10]. The most intense UCN source at the Institut Laue Langevin in Grenoble [11] provides not more than UCN per cm3. In order to improve counting statistics, new UCN sources are being developed in many laboratories around the world [12, 13, 14, 15, 16, 17, 18].
An elegant method to produce UCN employs a converter of superfluid 4He in a beam of cold neutrons [19]. The kinematics defined by the dispersion relations of helium and the free neutron enables downscattering of cold neutrons with an energy around meV (wavelength nm) to ultracold energies via emission of a single phonon. In addition, multi-phonon processes occur which contribute to the integral UCN production rate for a wide range of incident neutron energies [20, 21]. At low temperatures the probability for upscattering is strongly suppressed by the Boltzmann factor. Therefore, and since pure 4He has no cross section for neutron absorption, a large density of UCN may build up in a converter with reflective walls. The storage time constant can of course not exceed a limit close to s set by the neutron beta decay lifetime.
In a recent experiment we have demonstrated for the first time that one may efficiently extract UCN from the converter after having them accumulated therein [22]. As in past experiments [16, 17, 23, 24] the UCN production rate was found to agree reasonably well with the theoretical expectation. We have developed a new cryostat designed to keep the source portable and easy to operate. With a short cooling cycle of a few days, our system is much more flexible than an earlier apparatus [25], which was designed to be installed close to the target of a spallation source. Our present apparatus is a prototype for a future UCN source to be installed at a strong cold neutron beam of a high-flux reactor, where no extraordinary cooling power is required. A particular feature is the vertical extraction of the UCN through a cold mechanical valve situated above the helium bath. In contrast to a previous attempt to extract accumulated UCN horizontally [26], no gaps or windows are required in our method. To gain first experience with this system, the UCN converter vessel and extraction guide system were made of stainless steel. In the first run it enabled us to measure, with negligible background, the UCN production rate and to study the temperature-dependent storage properties of the converter. Here we report new results obtained with the converter vessel coated with fluorinated grease (Fomblin). It has good reflection properties for UCN and, to our very surprise, positively influences the extraction time constant. Moreover, a time-of-flight (TOF) measurement of the incident cold neutron beam helped to improve the comparison with the theoretical UCN production rate.
2 Apparatus
The apparatus was already described in some detail in ref. [22]. The converter vessel has a volume of about liters, made from an electropolished stainless steel tube with length mm and inner diameter mm, closed by Ni windows on both ends. The lowest temperature attained for the completely filled vessel was K in the previous run, and K in the present. The maximum kinetic energy of UCN storable in the vessel is defined by the Fermi potential of the wall material, which is neV for the stainless steel used (and neV for the Ni windows), from which one has to subtract the Fermi potential of the superfluid helium ( neV). Due to a small neutron absorbing aperture with diameter mm placed at the entrance window to the converter, chosen in order to avoid activation of the vessel in these first test experiments, the volume intersected by the cold neutron beam (”UCN production volume”) was cm3, only. In the experiments reported here, the inner surface of the vessel was coated with a thick layer of fluorinated grease (Fomblin) with a Fermi potential of neV. UCN were extracted as previously through a flapper valve situated above the superfluid helium in the ”T” section of the storage tube, connecting the (uncoated) extraction line made of electropolished stainless steel to a 3He-gas UCN detector. The present experiments were again performed at the neutron guide ”NL1” at the Munich research reactor FRM II, using the same neutron beam collimation as in the previous setup [22].
3 Definition of time constants and measurements
UCN storage and extraction from the converter can be characterised by various time constants. The storage time constant quantifies the temporal decrease of UCN in the closed vessel. The rate contains a contribution due to wall collisions, absorbing impurities, and UCN escaping through small holes in the vessel. This contribution does not depend on temperature but on the kinetic energy of the UCN. In addition there are the rates for the -dependent UCN upscattering, and for neutron beta decay11 1 In the present experiments this contribution forgotten to mention in ref. [22] was still small compared to the sum of the other rates.,
| (1) |
The emptying time constant quantifies the temporal decrease of UCN in the vessel with the UCN valve open. Therefore,
| (2) |
where is the time constant for UCN passage through the extraction hole with area . From these time constants we may derive the detection probability for a UCN created in the converter vessel. It characterises the efficiency of the whole system including extraction and is given by
| (3) |
where the factor describes losses in the extraction line and imperfect detector efficiency. The conversion process employed in the present experiments produces a broad spectrum of low-energy neutrons. Only neutrons with energies below are trapped inside the converter vessel, whereas those with higher energies quickly escape.

The spectrum of the neutrons remaining in the vessel is shaped due to wall losses. The energy dependence of these losses is due to the increase with UCN energy of both the average loss probability per wall collision and the frequency of wall collisions. Thus the largest losses occur for those neutrons with energies close to the Fermi potential. However, if on a given time scale the change of the energy spectrum stays sufficiently small, the time constant is still well defined. This is found to be a reasonably good approximation for the accumulation of UCN at high temperatures, where the energy-independent dominates the rate (see eq.(1)). At lower temperatures we may still deduce values for the various s (still calling them ”time constants”), and study how they depend on the times of UCN accumulation and trapping.
The time constants and can be obtained from measurements in the ”buildup mode”. There, the closed converter is first irradiated with cold neutrons for a time , after which the beam is shut off and simultaneously the UCN valve is opened. During the whole process a time histogram of the UCN count rate is recorded. Figure 1 shows a series of such histograms for different accumulation times , which was obtained for the lowest temperature of the converter in the present runs. The decrease of the UCN count rate while emptying the vessel proceeds with a pure single-exponential; fits of the whole decay in each of the histograms with always resulted in a reduced close to unity and provided a value for for each of the histograms.
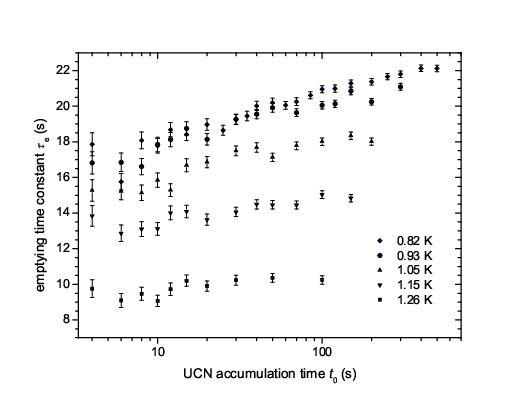
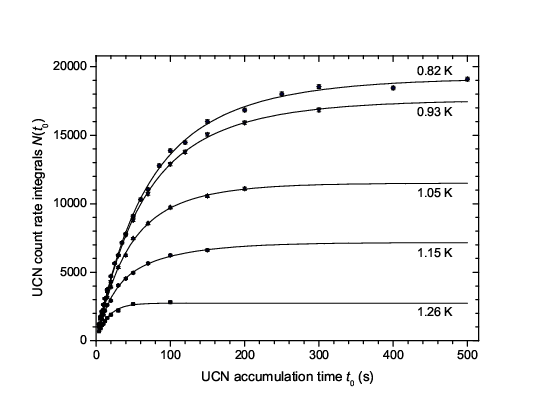
Figure 2 shows the integrals of all histograms measured. It demonstrates the saturation behaviour and the strong dependence of UCN accumulation for the range of temperatures investigated. If the time constant is sufficiently well defined, one can fit to the data the single-exponential buildup function
| (4) |
For the highest temperature, K, this fit has a reduced of . The fit becomes increasingly worse for the lower temperatures. As visible in fig. 3, there is also a dependence of on , which becomes increasingly pronounced for lower temperatures. These facts indicate the increasing influence of the first term in eq.(1) with decreasing temperature. The fit of a constant value to the data for at K has . For later use we summarise below the results of the fits to the data at this temperature, and the corresponding value for , obtained with eq.(2) and the value for from eq.(5). The uncertainties stated for , , and have been scaled to provide a fit with :
| (5) | |||||
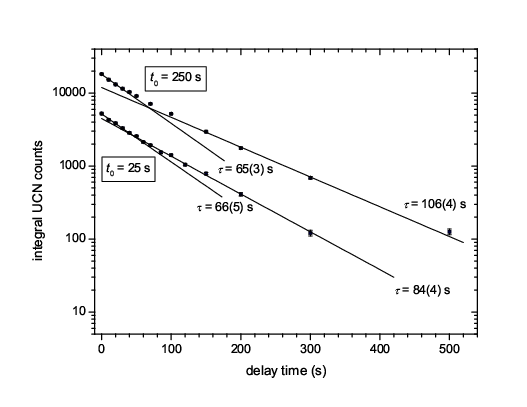
From the buildup-mode measurements as described before we cannot extract values for as a function of the time the UCN stay trapped in the vessel. In order to demonstrate this dependence we employed a variant of such measurements with a delayed extraction. There again the converter is first irradiated with cold neutrons while the UCN valve stays closed. After an accumulation time the beam is shut, but the UCN valve is opened only after a delay time . A series of such measurements provides histograms for the same but various . A plot of the count rate integrals of two series, for s and s, is shown in fig. 4. Values for can be obtained from single-exponential fits to a group of several data points. The variation of slope of the curves shown in fig. 4 indicates a more pronounced increase of with when UCN are accumulated for a longer time. This is to be expected, since after s the relative abundance of slower UCN with respect to the (more abundant) faster ones will be significantly higher than after s, due to the longer storage time constant of the slower UCN. Their presence in the vessel then becomes better visible in the delayed-extraction experiments.
Values for can also be deduced from the integral UCN counts for only two different delay times, using the relation
| (6) |
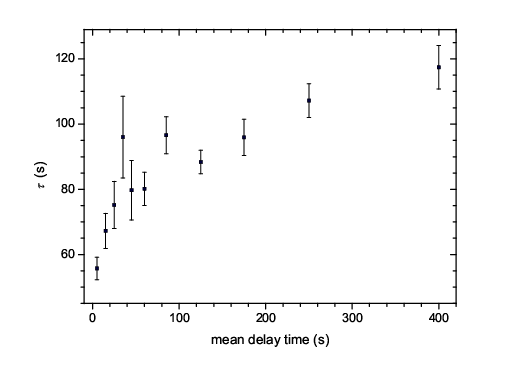
Figure 5 shows such an analysis for the series with s. The strong variation of time constants from one to two minutes demonstrates indeed how much at K the spectrum of the UCN remaining in the vessel is shaped by the energy dependence of the wall collisions during trapping.
In a third type of measurements, called ”continuous mode”, we measured the steady state count rate with the converter irradiated for a long time with cold neutrons while the UCN valve stayed open. The count rates measured are listed in Table 1. In the next section we will use and at K as input to determine the UCN production rate. For the purpose of illustration we present in Table 1 also values for derived from K K, which assumes that the same UCN spectrum prevails for the different temperatures. Remember that, as obvious from fig. 3, this assumption is only valid as an approximation. The values stated for the lower temperatures might represent the true value with a relative error in the order of %.
| [K] | |||||
|---|---|---|---|---|---|
| [s-1] | |||||
| [%] |
4 UCN production rate
The UCN production rate can be inferred from two methods, for which we
employ the data at the highest temperature, K, where the time
constants are sufficiently well defined.
First, as in the analysis of our last experiments [22], we may
use the stationary ”continuous mode” count rate . The
corresponding UCN production rate density is given by
| (7) |
Using the values for and stated in Table 1 and the value cm3 for the UCN production volume, we obtain
| (8) |
Lacking the knowledge of , the numerical value in eq.(8) provides a lower limit for .
A second value for the production rate density, , may be derived from
the saturated UCN number in the buildup-mode measurement, employing eq.(4). When UCN are accumulated for a long time, , the production rate equals the UCN loss rate. Denoting with the
saturated number of UCN in the vessel, of which only the fraction
is detected, this leads us to
| (9) |
Using the values for and from eq.(5) with from Table 1 we obtain
| (10) |
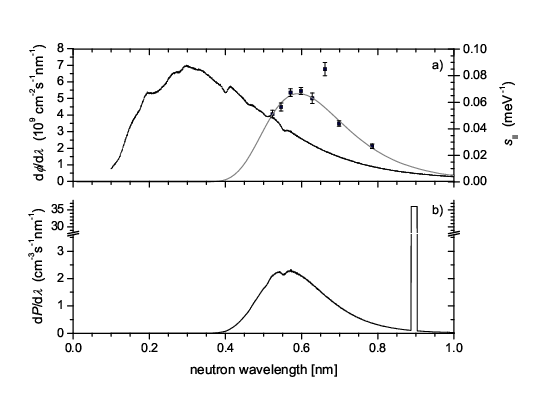
Hence, within the % accuracy of these two methods, . We may now compare the experimental findings with the theoretical expectation. This requires knowledge of the incident cold neutron spectrum which we measured in a separate experiment, using a time-of-flight (TOF) analysing device described in ref. [27]. It consists of a mechanical chopper and a 3He detector with a vertical slit. During a measurement the detector was moved horizontally in order to integrate over the whole divergence of the beam. The entrance aperture of the TOF analyser was placed at the position where previously was situated the entrance window to the converter vessel. We thus determined the neutron wavelength spectrum up to nm (frame overlap of the chopped bunches occured only for nm, where the intensity is negligibly small). The part for nm is shown in fig. 6. After the TOF measurements the spectrum was calibrated with a gold foil activation by the integral neutron flux.
The mechanism of UCN production contains contributions from single phonon emission and multiphonon processes. The single-phonon contribution to the production rate density in a helium converter with Be wall coating is s-1cm-3, where the differential flux at nm is given in cm-2s-1nm-1 [17]. For the present situation this value needs to be corrected for the Fermi potential of the Fomblin grease, i.e. divided by , with an uncertainty of due to the poor knowledge of the Fermi potential of the Fomblin grease. From the measured TOF spectrum shown in fig. 6a we find cm-2s-1nm-1, from which we expect a single-phonon production rate density s-1cm-3.
The differential multi-phonon production rate density is given by
| (11) |
is the number density and is the cross section per helium atom. and are the maximum kinetic energy and wavenumber of the neutrons trapped in the vessel. is the scattering function , evaluated on the dispersion curve of the free neutron, i.e. , with . It is modeled22 2 More details about the modeling of will be described in a forthcoming paper. to fit data from [28, 29] which is also shown in fig. 6a. Integration of from nm to for the measured incident differential flux provides an estimated lower limit of s-1cm-3 for the integral multi-phonon production rate . Difficult to estimate is the contribution to from the wavelength range nm. First, there is no direct experimental information available about and second, this region has a strong weight due to the relatively large . The -dependent measurements of UCN production by Baker and colleagues [17] indicate that a multi-phonon contribution exists also from the region nm. The measured integral multi-phonon and single-phonon production rates were found to add up evenly to the measured integral production rate [30]. This provides an experimental hint that for nm the multi-phonon contribution might be negligible. The fit function shown in fig. 6 was therefore designed to extend the range of available data with a smooth decrease to zero at nm. Integration of using the complete fitting function for yields s-1cm-3. Estimating the uncertainty of as the difference between the values with and without inclusion of the contribution from the range nm, we may expect a total UCN production rate of
| (12) |
Evidently, more experimental information about is required for a secure prediction of the UCN production rate induced by a white cold neutron beam. Note that this is particularly necessary for the region of short wavelengths, whereas the contribution to from the region nm is only s-1cm-3. We also note that predictions from the two model calculations [20, 21] for the region nm give mutually inconsistent results.
5 Discussion and conclusions
Our experiments demonstrate the feasibility of a versatile, intense UCN source at a cold neutron beam, providing UCN for experiments at room temperature. With the present prototype, at K and using a small extraction hole with area cm2, about % of the UCN produced in the Fomblin grease-coated converter vessel reached the detector. Compared to our previous experiment with the uncoated electropolished stainless steel converter vessel [22], the count rates of accumulated UCN observed immediately after opening the UCN valve, and also the integral UCN counts were almost a factor three higher, despite the lower Fermi potential of the Fomblin wall coating. This increase of UCN output is due to longer storage time constants and a faster passage of the UCN through the extraction hole. Values for as derived from eq.(2) can be compared to the gas-kinetic equation
| (13) |
where we insert l for the volume of the converter vessel, and the mean velocity of the trapped UCN, which, for a uniform distribution in velocity space, is given by with , where is the neutron mass. From the data for the Fomblin-coated vessel at K we thus expect s. The measured value, s, is much closer to the expected value than in our earlier experiments with the uncoated converter vessel. There, from eq.(13) with the Fermi potential of stainless steel we may expect s but measured s. A possible explanation is that UCN trajectories do not explore quickly enough the available phase space in the electropolished vessel, a hypothesis already raised earlier by W. Mampe and co-workers for their liquid-wall UCN bottle experiment [31]. Thus a certain roughness of the vessel walls seems to be necessary for efficient extraction of the UCN through a small hole. This should be taken into account in the design of a large converter vessel in order to keep the time needed to extract the UCN reasonably short.
The UCN production rate densities determined with two partly independent methods agree very well, s-1cm-3, and s-1cm-3. In our earlier experiment with the uncoated stainless steel vessel, we obtained the values s-1cm-3, and s-1cm-3. The accuracy of the comparison has thus been improved by more than a factor two in the present experiments. More important, also the comparison with the theoretical expectation has been improved by virtue of a dedicated TOF analysis of the cold neutron beam spectrum, due to which we may expect the UCN production rate density , with single- and multi-phonon contributions of similar size. Since the detector and extraction efficiencies, expressed by the factor , cannot be expected as perfect, the measured values come indeed very close to .
In the present experiments the saturated UCN density, normalised to the production volume did not exceed UCN per cm3. To avoid activation of the stainless steel vessel only a quarter of the total volume was irradiated with the cold beam. Also for practical reasons, significant divergence losses due to beam collimation were accepted. In addition, for simplicity of these first tests, we did not yet employ a wall material with low neutron absorption and a high Fermi potential of neV or beyond, such as Be, BeO or diamond-like carbon [32, 33]. There one will gain in UCN density both due to the larger energy of the storable neutrons and due to a larger storage time. In order to produce a larger total number of UCN, the converter vessel can be made much longer, due to the low cross section of cm2 for neutrons with wavelength nm [34], corresponding to a mean free path of about m. With a properly designed 4He converter and using an existing intense cold neutron beam at a high flux reactor, UCN densities in the order per cm3 with a total UCN number up to several seem within reach.
Acknowledgements: We are very grateful to the head of the Physics Department E18, Prof. S. Paul, and to the scientific director of the FRM II, Prof. W. Petry, for supporting this development. We also thank I. Altarev, A. Müller and W. Schott for some useful discussions. We gratefully acknowledge the help of M. Pfaller and his team from the central mechanical workshop of the physics faculty for careful manufacturing of many cryostat components. This work has been funded by the German BMBF (contract number 06MT250).
References
- [1] R. Golub, D. Richardson, S.K. Lamoreaux, Ultra-Cold Neutrons, IOP Publishing Ltd, 1991.
- [2] V.K. Ignatovich, The Physics of Ultracold Neutrons, Clarendon Press, Oxford 1990.
- [3] C.A. Baker et al., Phys. Rev. Lett 97 (2006) 131801.
- [4] M. Pospelov, A. Ritz, Annals Phys. 318 (2005) 119.
- [5] R.E. Lopez, M.S. Turner, Phys. Rev. D 59 (1999) 103502.
- [6] M. Arif et al. (Eds.), Precision Measurements with Slow Neutrons, J. Res. Nat. Stand. Technol. 110 (2005) 137.
- [7] H. Abele and D. Mund (Eds.), workshop on Quark mixing and CKM Unitarity, Heidelberg, September 2002 (Mattes Verlag, Heidelberg, 2003) [arXiv: hep-ph/0312124].
- [8] V.V. Nesvizhevsky, H.G. Börner, A.K. Petukhov, H. Abele et al., Nature 415 (2002) 297.
- [9] G. Ban, K. Bodek, M. Daum, R. Henneck et al., Phys. Rev. Lett. 99 (2007) 161603.
- [10] A.P. Serebrov, E.B. Aleksandrov, N.A. Dovator, S.P. Dmitriev et al., submitted to Phys. Lett. B [arXiv:0706.3600].
- [11] A. Steyerl, H. Nagel, F.-X. Schreiber et al., Phys. Lett. A 116 (1986) 347.
- [12] U. Trinks, F.J. Hartmann, S. Paul, W. Schott, Nucl. Instr. Meth. A 440 (2000) 666.
- [13] A. Fomin et al., PSI Report TM-00-14-01 (2000), see also http://ucn.web.psi.ch/.
- [14] A. Saunders, J.M. Anaya, T.J. Bowles et al., Phys. Lett B 593 (2004) 55.
- [15] Y.N. Pokotilovski, Nucl. Instr. Meth A 356 (1995) 412.
- [16] Y. Masuda, T. Kitagaki, K. Hatanaka et al., Phys. Rev. Lett. 89 (2002) 284801-1.
- [17] C.A. Baker, S.N. Balashov, J. Butterworth, P. Geltenbort et al., Phys. Lett. A 308 (2003) 67.
- [18] The LANSCE neutron EDM experiment, http://p25ext.lanl.gov/edm/edm.html.
- [19] R. Golub and J.M. Pendlebury, Phys. Lett. 53A (1975) 133.
- [20] E. Korobkina, R. Golub, B.W. Wehring, A.R. Young, Phys. Lett. A 301 (2003) 462.
- [21] W. Schott, J.M. Pendlebury, I. Altarev, S. Gröger et al., Eur. Phys. J. A 16 (2003) 599.
- [22] O. Zimmer, K. Baumann, M. Fertl, B. Franke, S. Mironov, C. Plonka, D. Rich, P. Schmidt-Wellenburg, H.-F. Wirth, B. van den Brandt, Phys. Rev. Lett. 99 (2007) 104801.
- [23] P.R. Huffman, C.R. Brome, J.S. Butterworth, K.J. Coakley et al., Nature 403 (2000) 62.
- [24] P. Ageron, W. Mampe, R. Golub, J.M. Pendlebury, Phys. Lett. 66A (1978) 469.
- [25] H. Yoshiki, K. Sakai, T. Kawai, S. Goto’o, Cryogenics 34 (1994) 277.
- [26] A.I. Kilvington et al., Phys. Lett. A 125 (1987) 416.
- [27] K. Zeitelhack, C. Schanzer, A. Kastenmüller et al., Nucl. Instr. Meth. A 560 (2006) 444.
- [28] K.H. Andersen, W.G. Stirling, R. Scherm, A. Stunault et al., J. Phys.: Condens. Matter 6 (1994) 821.
- [29] K.H. Anderson, private communication of unpublished results.
- [30] M. van der Grinten, private communication.
- [31] W. Mampe, P. Ageron, C. Bates, J.M. Pendlebury, A. Steyerl, Phys. Rev. Lett. 63 (1989) 593.
- [32] F. Atchison, B. Blau, M. Daum, P. Fierlinger et al., Phys. Lett. B 642 (2006) 24.
- [33] F. Atchison, B. Blau, M. Daum, P. Fierlinger et al., Phys. Rev. C 74 (2006) 055501.
- [34] H.S. Sommers, J.G. Dash, L. Goldstein, Phys. Rev. 97 (1955) 855.