QU Carinae: a SNeIa progenitor?
Abstract
Optical spectra obtained in 2006-07 of the nova-like cataclysmic variable QU Car are studied for radial velocities, line profiles, and line identifications. We are not able to confirm the reported 10.9 hr orbital period from 1982, partly because our sampling is not ideal for this purpose and also, we suspect, because our radial velocities are distorted by line profile changes due to an erratic wind. P-Cygni profiles are found in several of the emission lines, including those of C IV. Carbon lines are abundant in the spectra, suggesting a carbon enrichment in the doner star. The presence of [O III] 5007 and [N II] 6584 is likely due to a diffuse nebula in the vicinity of the system.
The wind signatures in the spectra and the presence of nebular lines are in agreement with the accretion wind evolution scenario that has been suggested to lead to SNeIa. We argue that QU Car is a member of the V Sge subclass of CVs, and a possible SNeIa progenitor. It is shown that the recent light curve of QU Car has 1 mag low states, similar to the light curve of V Sge, strengthening the connection of QU Car with V Sge stars, supersoft x-ray sources, and SNeIa progenitors.
Keywords:
QU Car–cataclysmic variables–supernovae–outflowsI Introduction
Although identification of the progenitors of Supernovae Ia (SNeIa) remains controversial, it is accepted that they originate in binary systems in which at least one component is a white dwarf (WD); those systems are grouped under the wide umbrella of cataclysmic variables (CVs). CVs are semi-detached binaries in which a WD is accreting material from its lower main sequence or evolved companion (Warner 1995). When the magnetic field of the WD is low, a luminous accretion disk leads the gas onto the WD; if the magnetic field of the WD exceeds 10MG, gas is guided onto the WD’s magnetic poles via its magnetic field lines. Depending on the orbital period, the mass transfer rate (), the white dwarf temperature and the donor star’s nature, CVs present a rich group of members, each providing valuable information on accretion physics, stellar evolution, binary star interaction and cataclysmic explosions.
Current theories for SNeIa progenitors hold that, either via Roche lobe overflow of the companion or via a wind, the WD accumulates H or He-rich material which is then burned to C and O on the WD. Under suitable conditions (determined primarily by the stability of onto the WD) the WD mass reaches the Chandrasekhar limit initiating a series of thermonuclear reactions eventually leading to a SNeIa (Hillebrandt & Niemeyer 2000). Although outlining this scenario is rather straightforward, the specifics are far from being understood or defined. For example, the nature of the companion star is uncertain, as well as how remains low enough to prevent the expansion of the star’s outer layers but high enough to allow stable H or He burning on the WD atmosphere without leading to a nova explosion. The WD mass necessary to initiate the thermonuclear reactions leading to the explosion is about 1.4M☉ and recent theoretical models conclude that a fast rotating WD with initial mass as low as 0.7M☉ can accrete efficiently and eventually reach the Chandrasekhar limit (Hachisu, Kato & Nomoto 2007). Currently, candidate progenitors are either double-degenerate (WD+WD) systems, or binaries that harbor a post main sequence companion (the single degenerate binary, or SDB, scenario). Double-degenerate systems are less promising candidates due to their low overall mass or long orbital periods (Parthasarathy et al. 2007). Favorable candidates are the SDBs (Langer et al. 2000) for which stellar evolution codes predict the presence of substantial outflows; the outflows result from H- or He-rich material that is processed on the WD and expelled under appropriate conditions (e.g. Han & Podsiadlowski 2004). Badenes et al. (2007) predict that the presence of stable, high-velocity winds (voutflow1000km/sec) should lead to the formation of cavities in the surrounding ISM. However, such cavities are not observed around existing SNeIa remnants. Badenes et al. (2007) suggest that if outflows exist from SNeIa progenitors, they should be irregular and variable in time and should not be able to affect the surrounding pre-SN environment.
Among the most promising SNeIa progenitors are some types of transient supersoft x-ray sources (SSS), recurrent novae, and V Sge-type CVs. The latter is a small category of semi-detached binaries with high mass transfer rates (10-7M☉yr-1) allowing nuclear burning on the white dwarf as mass transfer proceeds; these are considered to be the galactic counterparts of extragalactic SSS sources. Hachisu Kato (2003; hereafter HK03) model the long-term optical light curve of the prototype of the class, V Sge, and correlate the observed bright/faint states (1 mag in amplitude) of the system with the predictions of their accretion wind evolution scenario (AWE). In short, the mass of the WD increases until it reaches a critical limit at which time the WD burns the accumulated H and expels a large portion of the processed material (primarily C and O) in a fast wind. This wind sweeps away the disk surface increasing its luminosity (leading to an overall increase of the system brightness by up to 1 mag) and strips off the outer layers of the secondary star which becomes smaller than its Roche lobe; this halts mass transfer. The disk is then accreted onto the WD. Mass accretion eventually stops, leading to a cessation of the wind phase. Mass transfer starts again with the donor star regaining contact with its Roche lobe; this is also the beginning of a new cycle. At the same time, the white dwarf accumulates enough material to eventually reach the Chandrasekhar limit and finally explode as a SNeIa.
In this paper we present a spectroscopic study of QU Car, an unusual yet bright and understudied CV. QU Car was first reported in Stephenson et al. (1968) as an irregular variable HD310376, similar to the bright low-mass X-ray binary Sco X-1 and the old nova HR Lyr. QU Car shares with Sco X-1 rapid and erratic photometric variations, as well as marked changes in the emission line spectrum. However, in contrast to Sco X-1, QU Car sometimes has He absorption features and relatively weak x-ray emission. (Schild 1969). In the optical, the system is non-eclipsing and exhibits flickering of 0.1-0.2 mag on timescales of 1-10 min (Schild 1969; Gilliland Phillips 1982, hereafter GP82). In our study, we present new optical spectra suggesting that QU Car could be a member of the V Sge category and a likely SNeIa progenitor. The following section presents our data and data reduction technique, followed by the results of our analysis in and our discussion in . We summarize our findings in .
II Data Acquisition and Reduction
All our spectroscopic data were obtained with the RC Spectrograph on the CTIO 4-m Blanco telescope during four nights in 2006 and 2007. For each run, we used the KPGL3 grating, yielding a spectrum from 3800-7500 at 1.2/pixel, providing a resolution of 3. A log of our observations is provided in Table 1. For detector calibrations, we used the standard IRAF11 1 IRAF is distributed by the National Optical Astronomy Observatories, which are operated by the Association of Universities for Research in Astronomy, Inc., under cooperative agreement with the National Science Foundation. procedures, and for data reductions we used IRAF’s onedspec/twodspec packages.
Due to passing clouds we had strong telluric features at 5920-6020 and 6447-6610 for the 2006-Dec and 2007-Mar data. To correct for this absorption, we used data from the Wallace and Livingston (2003) atlas and the IRAF task “telluric”. Using “telluric” we interactively scaled the telluric features to match the observed spectra in regions having few stellar features; the goal was to minimize the RMS difference in these regions. For all our spectra, we achieved a residual between the scaled correction spectrum and the spectrum of our star of 0.008 (rms) for the selected regions. For the nights when we had passing clouds no standard stars were obtained; therefore the 2006-Dec and 2007-Mar data are not flux calibrated. For the 2007-Jun data we used LTT 4816 for flux calibration. The radial velocity corrected and summed spectrum of QU Car appears in Figure 1 (top) with prominent emission/absorption features identified; summed individual spectra from each epoch of observations are also plotted.
III Analysis
III.1 Radial Velocities
We used IRAF/splot with a Gaussian fit to derive radial velocities (RVs) and equivalent widths (EWs) of the emission lines. Conspicious lines include H, H, the CIII/NIII/OII blend (4640-4650 ), and He II 4686. The emission lines are rather weak with respect to the continuum. For example, the peak of the He II 4686 emission line is typically only 3-5% above the continum. This HeII line was used by GP82 to derive a binary orbital period of 10.9h, placing QU Car among the longer-period CVs. Table 2 lists our RV and EW measurements for this line. Our data do not cover a full orbit at any epoch; however measurements are available at various phases of different cycles. It was expected that our new data would be able to confirm the orbital period and provide a modern ephemeris, but that has not been the case. We first used a periodogram (Horne Balliunas 1986) on the GP82 He II data to confirm their period of 0.4540.014 days (10.9h). Figure 2 compares the periodogram of the radial velocities from GP82 with a periodogram over the same frequency range for our new data, using both He II 4686 and the central emission peak of H. The location of the 10.9h period adopted by GP82 is marked, and it is apparent that the periodograms of the two data sets are inconsistent. The GP82 data consists of 49 spectra on 7 nights over 363 days. Our new data is comprised of 57 spectra on 4 nights over 202 days. The two data sets appear to be similar in time coverage, suggesting that the GP82 period may be in error. However, the GP82 data contain two continuous sequences of 7.8h and 7.2h, while the longest sequences in our new data are 1.5h and 1.6h; this difference appears to be critical for this system.
Figure 3 (top) shows the radial velocity curve of the 1979 data from GP82, folded on the GP82 “combined He II” ephemeris. (The less extensive 1980 radial velocities in GP82 are not plotted because we were not able to reproduce the GP82 phases for the 1980 data using their “combined HeII” ephemeris.) The bottom panel shows our 2006-2007 He II RVs folded on the same ephemeris. Too many cycles have elapsed to expect the zeropoint of the GP82 ephemeris to remain valid for our new data; however, we expected some coherence when folded on the 10.9h period. Instead we see only monotonic or nearly monotonic sequences which are more rapid than even the steepest part of the fitted curve in the top panel. The quoted 3% uncertainly on the 10.9h period of GP82 accumulates to many cycles even over the 8-month span of our data. Therefore the apparent sine-like curve between phases 0.3 and 0.7 in the bottom panel of Figure 3 is not physical, because the data on either side of phase 0.5 are separated by 8 months. In fact, we carefully examined the power spectrum and folded RV curves for our data over the period range 0.05-10 days, finding no periodicities of consequence.
It appears that either the period of QU Car is substantially shorter than the GP82 result, or that the intervals of rapid RV changes seen in our RV data are non-orbital in nature. More extensive measurements are needed to tell for sure, but we prefer the latter explanation given the current data. The reason is that the line profiles in QU Car are likely distorted on time scales of 1-3 hours due to wind ”events”, similar to those described in optical wind lines for some nova-like CVs by Kafka et al. (2003) and Kafka & Honeycutt (2004). Evidence supporting this conclusion includes 1) QU Car clearly has an erratic wind (from the P Cyg profiles), 2) the He II 4686 line can have a strong wind component in some high inclination NL CVs (Honeycutt et al. 1986), and 3) the GP82 data also display occasional nearly monotonic changes in RV over 1-3h that are considerably faster than any portion of the fitted RV curve (one of these can be seen as the filled circles in the top panel of Figure 3). Such changes have little effect on the period analysis of GP82 because the lengths of their spectral sequences are considerably longer. This is not the case with our new data, making it impossible to improve or confirm the GP82 period study. A new comprehensive RV study of QU Car would certainly be helpful considering the importance (and brightness) of the system.
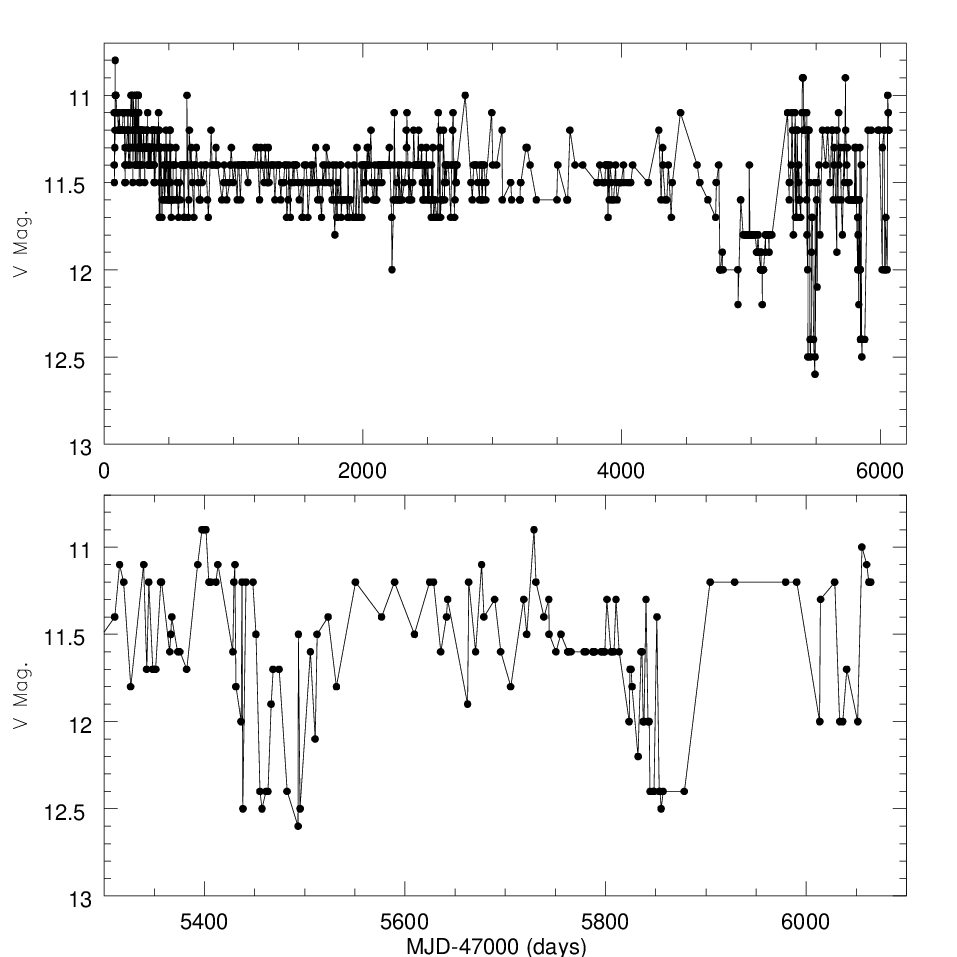
We also measured the RVs of the other emission lines; however none indicated any periodicity nor did they showed any coherent variation with the GP82 orbital period. Schild (1969) and GP82 examined their short-term photometric data for periodic modulation in the V-band light curve, but found none. The 0.2 mag “flaring” events appeared to be erratic on timescales of a few minutes. We examined the AAVSO light curve of the system (Figure 4) for periodicities but were unable to find any, even when we group the data to reduce the scatter.
III.2 The outflow from QU Car and nebula lines
In high disk CVs, winds often produce blueshifted absorption components to the emission lines. These P-Cygni profiles, most obvious in UV resonance lines such as C IV 1449 and Si IV 1397, are seen at times in both nova-like CVs and in dwarf novae during outburst. P-Cygni profiles appear mostly in low-inclination (i.e. disk almost face-on) CVs, indicating a bi-polar nature of the outflow. The lines are thought to form by resonance scattering in an accelerating wind, with velocities reaching 5000 km/s. Although the origin of the wind is uncertain, it is generally thought to arise from the inner accretion disk/boundary layer. Some CVs are known to have reliable P-Cygni profiles in optical He I and/or H lines; e.g. BZ Cam (Ringwald Naylor 1998) and Q Cyg (Kafka et al. 2003). Those P Cygni profiles are most conspicuous in the He I triplet lines at 5876 and 7065 whereas they are absent in the He I singlet line at 6678 (despite the fact that these three lines have very similar excitation levels). Kafka et al. (2003) argued that this behavior is due to the strongly metastable 23S effective ground state of the triplets, which becomes over-populated in conditions of low density and a dilute radiation field, over-populating in turn the 23P common lower level of HeI 5876 and 7065, leading to absorption in a low density wind.
In QU Car, variable and erratic P-Cygni profiles in N V 1238.8/1242.8 (doublet), O V 1371 and Si IV 1398 and C IV 1549 have already been reported (Knigge et al. 1994; Hartley et al. 2002; Drew et al. 2003). Their UV P-Cygni profiles have no apparent phase dependence and unknown time evolution. The modest velocities of the outflow (up to 2000 km/sec) suggested an outer-disk origin for the wind and an unusually high for the system (Hartley et al. 2002). In our (and older) optical data the He I triplet lines in QU Car did not exhibit P-Cygni profiles (see Figure 1). It is likely that strong C IV emission at 5802 overlaps any blueshifted absorption in the He I 5876 line. Occasional shallow absorption dips appear in the blue side of the H line, reaching 1000 km/sec. At the same time a broad P-Cygni profile is present at the blue end of the C IV 5807 line. The presence of diffuse interstellar bands at 5780, 5705 and 6494 complicate measuring the strength of this blue-shifted absorption. However, one can discern relative changes in the strength of the absorption profiles between epochs. The EW of the absorption component of the CIV line is included in Table 3, indicating up to 50 variability in the strength of the wind at different epochs. This CIV line likely originates from a C VC IV recombination cascade requiring 490ev, indicating the presence of a strong ionization field in the system. Such high ionization levels might also explain the lack of P-Cygni profiles in the lower-ionization He I lines. The velocity of the wind in C IV reaches 5700 km/sec; this is a lower limit since the C III 5696 line overlaps the P-Cygni profile at its blue end.
We were surprised to find traces of [O III] in the spectrum of QU Car. Of the two components of the doublet, only the 5007 component is present. This forbidden line appears in planetary nebula and active galactic nuclei (AGN) as a result of photoionized gas around a central source (e.g. Dimitrijevic et al. 2007). For AGNs the flux ratio in the doublet is near 3 (Dimitrijevic et al. 2007). If the process governing [OIII] emission in QU Car is similar to that in AGNs, then the [OIII] 4959 component is likely absent in QU Car due to its relative faintness. The detection of forbidden lines indicates the presence of a nebula. The line is weak and somewhat difficult to measure, but it appears that the [OIII] line in QU Car has substantial radial velocity variations, from 250 (epoch 3) to -128 km s-1 (epoch 2).
In our QU Car spectra the [O III] 5007 line has two components with nearly constant displacement from the line center of -500 and 370 km s-1. These likely arise from the front and back sides of an expanding shell or wind. We measured the EWs of the two components using Gaussian fits ; although the red component hardly changes, the blue component appears to vary in strength (see Table 3). This line is weak, but we nevertheless judge these changes to be real. Similar behavior of [O III] 5007 in seen in some symbiotic stars, with the line being split into two components, and variability in strength over intervals of months (Kenyon 1986).
The presence in QU Car of [N II] 6584 emission, which is also common in planetary nebulae, confirms the existence of a nebula in the vicinity of the star. Our data show EW variations in this line (more than 2X variation between epoch 1 and epoch 4), but again the line is weak. Undetected is [Si II] (at 6717 and 6731), which is characteristic of the nebulosity associated with the strong-wind CV BZ Cam (Greiner et al. 2001), and visual inspection of the spectra did not indicate any extended nebulosity. Overall, the presence of forbidden lines in QU Car is consistent with the outflows associated with the AWE mechanism, which we argue is operating in this system to produce the high state/low-state features in the light curve (see ), and the wind features in the spectrum.
III.3 Hydrogen and Helium emission lines
Figure 5 demonstrates graphically the variability in the strength and profile of hydrogen and helium lines in QU Car. Tables 2 and 3 also document the changes in EW. In the spectroscopic study of GP82, the H emission line seems to be transient, disappearing between phases 0.2-0.7, with a maximum EW of 3. When present, the emission component of the line is superposed on a wide absorption trough. The phasing of the RV variations of the H emission trailed the HeII RV curve by P/4. Drew et al. (2003) searched for absorption features in the optical that could reveal the nature of the donor star. They discuss the presence of the He II 5411 line and the complete absence of O VI 5290, both of which are characteristic of SSSs. Both GP82 and Drew et al. (2003) measure the He II 4686/H EW ratio to be greater than 2, in agreement with the typical value in SSSs. In our data, this ratio is always less than 1. Furthermore, in our data, the H line has the largest EW values and EW variations ever reported in QU Car: the EW varies from 14 to 0.6 at two successive epochs. (Table 3). At the same time, the surrounding Balmer lines do not follow this variation. We remain puzzled as to how this situation can occur. The H line is mostly single-peaked; however at times a second peak appears to be present (Figure 5). The He I 6678, 5876 and 7065 lines seem to also have an additional (red) component at times.
Drew et al. (2003) described an overabundance of carbon in QU Car with respect to both helium and oxygen, suggesting that it is likely due to an R-type carbon donor star. A number of C emission lines are identified in Figure 1; however there is no evidence of any absorption features from the secondary star. Perhaps the ultra-luminous accretion disk of QU Car masks detection of the secondary. However, the presence of both C III 5696 and C IV 5802,5812 is typical of carbon Wolf-Rayet (WR) stars and carbon-type central remnants of planetary nebulae, suggesting that the donor star may be carbon-rich. Considering a wide range of possibilities, the strong carbon features could be due to 1) carbon generated by nuclear burning on the white dwarf as part of the AWE cycle, 2) carbon rich gas accreted onto the WD from a carbon rich companion, or 3) a carbon WR secondary star contributing directly to the optical light in QU Car. If the latter is the case, then (following the Crowther et al. (1998) classification criteria for WR/WC stars), the ratio of C III 5696 to C IV 5802,5812 implies WC7 for the QU Car secondary star. This assumes that C III 5696 is not greatly affected by the absorption component of C IV.
IV A V Sge star and SNeIa progenitor?
Drew et al. (2003) used interstellar absorption features to derive a lower distance limit of 2kpc to QU Car, leading to 10-7M☉y-1, consistent with high in V Sge stars. The members of this class are considered to have evolved donor stars that transfer gas with 10-7M☉y-1. Furthermore, synthetic UV spectra and an empirical mass-period relation lead to a white dwarf mass of 1.2Msun (Linnell et al. 2008). The spectrum of QU Car seems similar to that of WX Cen, a member of the V Sge category and also a suggested SNeIA progenitor (Oliveira & Steiner 2004). Overall, QU Car appears to possess the key properties for being a SNeIa progenitor candidate under the AWE mechanism: very high , erratic winds (plus nebular lines), and high/low states (as described below). Figure 4 shows the long term AAVSO22 2 The data presented here are from the database of the American Association of Variable Star Observers (AAVSO), at http://www.aavso.org/ light curve of QU Car. Beginning in 2002 QU Car displayed 1 mag faint states resembling the faint states of the prototype of the class, V Sge (Robertson et al. 1997). In V Sge this repeated high/low state cycle has been interpreted as evidence for the accretion wind evolution scenario, leading to SNeIa (HK03). The AAVSO light curve for QU Car shows that such behavior is new for this system. We may be witnessing the onset of a V Sge (or SSS) phase in a CV.
V Summary
We have presented a new spectroscopic study of the bright nova-like QU Car. The highlights of this work are:
- •
We explored the orbital period of the system using He II radial velocities from this study and from GP82. We are unable to confirm the 10.9 hr period of GP82. We argue that this situation is lilely due to rapid variations (compared to orbital) in the line profiles (P-Cygni) of the He II line due to an erratic wind, combined with our relatively short time series. We use as support for this argument the fact that the wind variability time scales in NL CVs are in this range, and the presence of fast monotonic RV changes in our data as well as in GP82.
- •
Forbidden lines are detected in the QU Car spectrum, consistent with substantial mass outflow. The [O III] 5007 appears split, likely due to contributions from the front and back sides of an expanding flow.
- •
It is pointed out that the light curve of QU Car has low states very similar to those in V Sge. In V Sge these low states are taken as evidence for the operation of accretion wind evolution cycle that is thought to lead to SNeIa. We propose that QU Car is also a strong candidate for a SNeIa progenitor, based on this and other similarites to V Sge systems. These similarites include high and evidence for a strong wind from P Cygni profiles and nebular lines.
It is surprising that so little optical work has been done on this bright, important system. It is important to determine/refine the orbital period of QU Car. Photometric monitoring is needed to define the characteristics of the photometric cycle and allow accurate comparisons with the predictions of the accretion wind model. Higher resolution spectral data will provide information on the various ionization regions and possible emission lines from the nebula. High resolution corongraphic imaging should be employed to search for nebulosity. QU Car appears to be the brightest known member of the V Sge category, and a likely SNeIa progenitor. Further study can provide important information on the nature and the conditions that lead to mass accumulation onto the white dwarf during the wind accretion cycle.
- [2] Badenes, C., Hughes, J. P., Bravo, E., & Langer, N. 2007, ApJ, 662, 472
- [4] Crowther, P. A., De Marco, O., & Barlow, M. J. 1998, MNRAS, 296, 367
- [6] Dimitrijević, M. S., Popović, L. Č., Kovačević, J., Dačić, M., & Ilić, D. 2007, MNRAS, 374, 1181
- [8] Drew, J. E., Hartley, L. E., Long, K. S., & van der Walt, J. 2003, MNRAS, 338, 401
- [10] Gilliland, R. L., & Phillips, M. M. 1982, (GP82) ApJ, 261, 617
- [12] Greiner, J., et al. 2001, A&A, 376, 1031
- [14] Hachisu, I., & Kato, M. 2003, (HK03) ApJ, 598, 527
- [15] Hachisu, I., Kato, M., & Nomoto, K. 2007, ArXiv e-prints, 710, arXiv:0710.0319
- [17] Han, Z., & Podsiadlowski, P. 2004, MNRAS, 350, 1301
- [19] Hartley, L. E., Drew, J. E., & Long, K. S. 2002, MNRAS, 336, 808
- [21] Hillebrandt, W., & Niemeyer, J. C. 2000, ARA&A, 38, 191
- [23] Horne, J. H., & Baliunas, S. L. 1986, ApJ, 302, 757
- [25] Honeycutt, R. K., Schlegel, E. M., & Kaitchuck, R. H. 1986, ApJ, 302, 388
- [27] Kafka, S., Tappert, C., Honeycutt, R. K., & Bianchini, A. 2003, AJ, 126, 1472
- [29] Kafka, S., & Honeycutt, R. K. 2004, AJ, 128, 2420
- [31] Kenyon, S. J. 1986, The Symbiotic Stars, Cambridge and New York, Cambridge University Press, 1986
- [33] Knigge, C., Drew, J. E., Hoare, M. G., & La Dous, C. 1994, mnras, 269, 891
- [35] Langer, N., Deutschmann, A., Wellstein, S., Houmlflich, P. 2000, A&A, 362, 1046
- [36] Linnell, A. P., Godon, P., Hubeny, I., Sion, E. M., Szkody, P., & Barrett, P. E. 2008, ArXiv e-prints, 801, arXiv:0801.0704
- [38] Oliveira, A. S., & Steiner, J. E. 2004, MNRAS, 351, 685
- [40] Parthasarathy, M., Branch, D., Jeffery, D. J., & Baron, E. 2007, New Astronomy Review, 51, 524
- [42] Ringwald, F. A., & Naylor, T. 1998, AJ, 115, 286
- [44] Robertson, J. W., Honeycutt, R. K., & Pier, J. R. 1997, AJ, 113, 787
- [46] Schild, R. E. 1969, ApJ, 157, 709
- [48] Stephenson, C. B.; Sanduleak, N.; Schild, R. E. Astrophysical Letters, Vol. 1, p.247, 1968
- [50] Wallace, L., & Livingston, W. 2003, An atlas of the solar spectrum in the infrared from 1850 to 9000 cm-1 (1.1 to 5.4 micrometer), revised. By L. Wallace and W. Livingston. Tucson: National Solar Observatory, National Optical Astronomy Observatory, NSO Technical Report, 2003.,
- [52] Warner, B. 1995, Cataclysmic Variable Stars, Cambridge Astrophysics Series, Cambridge University Press
| UT Date | Spectra | Exp. time (s) | Notes |
|---|---|---|---|
| 2006-Dec-12 | 19 | 180 | partly cloudy |
| 2007-Mar-19 | 8 | 60 | clear; dark |
| 2007-Jul-01 | 2 | 180 | clear; full moon |
| 21 | 240 | ||
| 2007-Jul-02 | 8 | 300 |
| HJD | RV (km s-1) | EW (Å) |
|---|---|---|
| 2454081.809 | -136 | -1.9 |
| 2454081.812 | -115 | -2.0 |
| 2454081.815 | -151 | -2.0 |
| 2454081.819 | -156 | -2.2 |
| 2454081.822 | -182 | -1.9 |
| 2454081.825 | -199 | -1.8 |
| 2454081.829 | -203 | -1.8 |
| 2454081.833 | -223 | -1.9 |
| 2454081.836 | -217 | -1.9 |
| 2454081.839 | -216 | -2.0 |
| 2454081.842 | -217 | -2.1 |
| 2454081.845 | -226 | -2.1 |
| 2454081.848 | -224 | -2.1 |
| 2454081.852 | -235 | -2.3 |
| 2454081.855 | -222 | -2.3 |
| 2454081.858 | -218 | -2.3 |
| 2454081.862 | -197 | -2.5 |
| 2454081.865 | -176 | -2.5 |
| 2454081.870 | -235 | -2.4 |
| 2454178.622 | -288 | -1.5 |
| 2454178.624 | -266 | -1.5 |
| 2454178.627 | -226 | -1.5 |
| 2454178.629 | -225 | -1.4 |
| 2454178.631 | -237 | -1.9 |
| 2454178.633 | -257 | -1.8 |
| 2454178.635 | -256 | -1.6 |
| 2454178.637 | -282 | -1.8 |
| 2454282.285 | -96 | -2.6 |
| 2454282.289 | -111 | -2.6 |
| 2454282.293 | -93 | -2.6 |
| 2454282.297 | -43 | -2.8 |
| 2454282.301 | -9 | -2.9 |
| 2454282.305 | -14 | -2.8 |
| 2454282.309 | -20 | -2.8 |
| 2454282.313 | -32 | -2.7 |
| 2454283.471 | -55 | -2.5 |
| 2454283.474 | -68 | -2.6 |
| 2454283.477 | -75 | -2.5 |
| 2454283.480 | -36 | -2.5 |
| 2454283.483 | 12 | -2.5 |
| 2454283.489 | -7 | -2.4 |
| 2454283.492 | -23 | -2.6 |
| 2454283.495 | -26 | -2.5 |
| 2454283.498 | -38 | -2.7 |
| 2454283.501 | -41 | -2.3 |
| 2454283.504 | -35 | -2.6 |
| 2454283.507 | -73 | -2.6 |
| 2454283.510 | -93 | -2.5 |
| 2454283.514 | -100 | -2.5 |
| 2454283.517 | -106 | -2.9 |
| 2454283.520 | -107 | -3.0 |
| 2454283.523 | -128 | -2.7 |
| 2454283.526 | -129 | -3.0 |
| 2454283.529 | -120 | -2.8 |
| 2454283.532 | -129 | -2.7 |
| 2454283.535 | -134 | -2.9 |
| 2454283.538 | -177 | -2.9 |
| linebbOnly the EW of the Balmer line emission cores are measured | central wavelength | 2006-12-12 | 2007-03-19 | 2007-07-01 | 2007-07-02 |
|---|---|---|---|---|---|
| H | 4101 | -0.42 | -3.18 | -1.54 | |
| He II | 4199 | -0.37 | -0.15 | -0.25 | |
| Si II | 4265 | -0.39 | -0.46 | -0.32 | -0.26 |
| H | 4340 | -1.58 | -0.20 | -2.11 | -0.24 |
| He II | 4542 | -0.12 | -0.22 | -0.32 | -0.26 |
| C III/N III/O II | 4642 | -3.09 | -3.08 | -3.05 | -3.56 |
| He II | 4686 | -2.00 | -1.59 | -2.75 | -2.79 |
| H | 4861 | -13.94 | -0.58 | -3.17 | -7.60 |
| He I | 4922 | -0.21 | -0.19 | -0.29 | -0.23 |
| O III (full) | 5007 | -0.48 | -0.46 | -0.48 | -0.51 |
| O III (blue) | -0.31 | -0.19 | -1.16 | -0.45 | |
| O III (red) | -0.28 | -0.30 | -0.24 | -0.28 | |
| He II | 5409 | -0.31 | -0.50 | -0.45 | |
| C III | 5696 | -0.60 | -0.32 | -0.31 | -0.21 |
| C IV | 5801,5812 | -1.17 | -1.38 | -0.64 | -0.92 |
| C IV absccThese measurements are uncertain, since they overlap with the DIBs at 5780 and 5705. Their inclusion here is to demonstrate the variation of the wind absorption between epochs of observations. | 1.95 | 2.78 | 1.78 | 2.20 | |
| He I | 5875 | -0.12 | -0.13 | -0.31 | -0.20 |
| H | 6563 | -3.78 | -2.26 | -4.23 | -3.29 |
| N II | 6584 | -0.71 | -0.57 | -0.32 | -0.27 |
| He I | 6678 | -0.67 | -0.58 | -0.85 | -0.79 |
| He I | 7065 | -0.33 | -0.17 | -0.51 | -0.51 |