Lattice Dynamics and Thermal Equation of State of Platinum
Abstract
Platinum is widely used as a pressure calibration standard. However, the established thermal EOS has uncertainties, especially in the high - range. We use density functional theory to calculate the thermal equation of state of platinum, up to GPa and K. The static lattice energy is computed by using the LAPW method, with LDA, PBE, and the recently proposed WC functional. The electronic thermal free energy is evaluated using the Mermin functional. The vibrational part is computed within the quasi-harmonic approximation using density functional perturbation theory and pseudopotentials. Special attention is paid to the influence of the electronic temperature to the phonon frequencies. We find that in overall LDA results agree best with the experiments. Based on the DFT calculations and the established experimental data, we develop a consistent thermal EOS of platinum as a reference for pressure calibration.
pacs
64.30.Ef, 05.70.Ce, 71.15.Mb, 63.20.D-I Introduction
Platinum (Pt) is a widely used high-pressure standard. Its equation of state (EOS) at room temperature has been established by reducing shock Hugoniot [1, 2, 3, 4] and by ab initio linear-muffin-tin-orbital (LMTO) calculations[4] up to GPa. Mao et al.[5] used the EOS developed in Ref. 4 (Holmes et al.) to calibrate pressure in their compression experiment on Fe and Fe-Ni alloy. The bulk moduli measured at the earth’s core pressure are substantially higher than those extrapolated from seismological observations.[6, 7] A large pressure offset is needed to remove the discrepancy: about at GPa, at GPa. The origin of this offset is under investigation. One possibility is the EOS of Holmes et al. seriously overestimates pressure.[6] Singh raised other possibilities.[7] He noticed that the one-parameter EOS of platinum agrees with the EOS of Holmes et al. to 1 % at high pressures, and concluded that large systematic error in pressure scale is unlikely. He further proposed that the discrepancy is due to the pressure on the sample is different from the one on the pressure standard, in the high-pressure X-ray diffraction measurements.
There are conflicting reports on the uncertainties of Holmes et al.’s EOS. Dewaele et al.[8] measured the EOS of six metals at ambient temperature to GPa using a diamond anvil cell (DAC). By cross-checking different pressure scales they found Holmes et al.’s EOS overestimates pressure by GPa near GPa at room temperature. This conclusion is confirmed by other groups.[9, 10] While more recent calculations based on density functional theory (DFT) suggest Holmes et al.’s EOS underestimates, rather than overestimates, pressure. Xiang et al.[11] computed the thermal equation of state of platinum using LMTO and a mean field potential method. The pressure they obtained is to % higher than that of Holmes et al. at high pressures. Menéndez-Proupin et al. [12] reached similar conclusion using pseudopotentials. Both calculations employ the local density approximation (LDA) functional.[13] And the excess pressure is attributed to LDA in Ref. 12. However it can also be caused by other factors. In Table II of Ref. 11, the equilibrium volume decreases as the temperature increases. The electronic thermal pressure is negative according to this calculation, which is contrary to expectations. Ref. 12 uses an ultrasoft Rappe-Rabe-Kaxiras-Joannopoulos pseudopotential from the PWSCF website,[14] which contains only , and valence states. Its large cutoff radius ( a.u.) may cause error in studying the highly compressed structure.
Besides the room temperature isotherm, accurate thermal pressure () is needed to calibrate pressure in simultaneous high-pressure and high-temperature experiments. Experiments cannot easily determine over a wide temperature and volume range.[15] Consequently is often estimated by assuming it is linear in temperature and independent of volume.[1, 4] Theory can in principle do better. In quasi-harmonic approximation (QHA), DFT calculations give at any particular temperature and volume. It is desirable to combine the experimental data with DFT calculations, taking the advantages of both, and construct a more accurate thermal EOS for pressure calibration.
In this paper we have three goals: first is to check the accuracy of the theoretical EOS of platinum predicted by different exchange correlation functionals. In contrast with previous calculations, we find the room temperature isotherm computed with LDA lies below, and nearly parallel to the experimental compression data. The Fermi level of platinum lies in the band and gives a very large density of state (DOS) . Its vibrational frequencies are more sensitive to the electronic temperature than those of many other metals. A Kohn anomaly has been observed in platinum at K.[16] It becomes weaker and finally disappears when the temperature increases. Thus our second goal is to discuss the electronic temperature dependence of vibrations (ETDV) and its influence on the thermal properties. Our last goal is to provide an accurate thermal EOS for pressure calibration. For this purpose we make corrections to the raw DFT results. We correct the room temperature Gibbs free energy to ensure that it reproduces the experimental isotherm, then combine it with the DFT calculated temperature dependence to get . The thermal EOS and thermal properties deduced from the corrected Gibbs free energy are in good agreement with the known experimental data.
II Computational Method
The EOS of a material is determined by its Helmholtz free energy , which consists of three parts:
| (1) |
where is the static energy of the lattice, is the vibrational free energy, accounts for the thermal excitation of the electrons. is calculated by using the linearized augmented plane-wave (LAPW) method[17] and three different exchange-correlation functionals: LDA, Perdew-Burke-Ernzerhof (PBE),[18] and Wu-Cohen (WC).[19] The , , , , are described as valence states, others are treated as core states. The convergence parameter is , and the muffin-tin radius is 2.08 a.u.. A Monkhorst-Pack[20] uniform k-grid is used and the integration over the whole Brillouin zone is done with the tetrahedron method.[21] All the calculations using LAPW are performed with and without spin-orbit effect.
In contrast with the static lattice energy , which is sensitive to the relaxation of the core states and requires a full-potential treatment, thermal excitations contribute to much smaller energy variations and mostly depend on the valence states. We use pseudopotentials to compute the thermal effects. An ultra-soft Vanderbilt pseudopotential[22] is generated from the reference atomic configuration , including non-linear core corrections.[23] There are two projectors in the channel, and ; two in the channel, and an unbound at Ry above the vacuum level; one in the channel, . The local component is set in the channel at the vacuum level. The cutoff radii for each channel , , and local are 1.8, 1.9, 1.9 and 1.8 a.u., respectively. We use the scalar relativistic approximation and spin-orbit effect is not included. This pseudopotential reproduces the LAPW electronic band structure, both at the most contracted volume and the GPa experimental volume. We find pseudopotentials with different exchange-correlation functionals yield very similar electronic band structures for platinum, and we use LDA to compute all the thermal effects.
We consider different volumes, with lattice constants from 7.8 to 6.2 a.u.(17.58 Å3 to 8.83 Å3 in volume). For each volume , we use LAPW to compute its static energy and the LDA pseudopotental to evaluate its thermal free energy and . is treated within QHA with phonon frequencies dependent on electronic temperature (denoted as eQHA) as
| (2) |
where denotes the phonon frequency computed at volume and electronic temperature . In thermal equilibrium the system temperature , the ionic temperature , and are equal. We distinguish these three temperatures to emphasis the temperature dependence of phonon frequencies come from different sources. Anharmonic phonon-phonon interactions cause phonon frequencies to depend on , but they are omitted in QHA. Electronic thermal excitations disturb the charge distribution in the crystal and cause phonon frequencies depend on . In the normal QHA used for insulators and some metals, this effect is also ignored and has no temperature dependence (except through ). Platinum has a larger than many other metals and ETDV may have noticeable effects on its thermal properties. To quantitatively measure the influence of ETDV, we compare the vibrational free energies at volume and temperature (=, , … K) computed without/with ETDV. Without ETDV (normal QHA), phonon frequencies are computed at = K by using Methfessel-Paxton[24] (MP) smearing with a smearing parameter of Ry. The corresponding vibrational free energy is denoted as . With ETDV (eQHA) phonon frequencies have to be computed separately for each . This is achieved by using the Mermin functional[25] and Fermi-Dirac (FD) smearing. The corresponding vibrational free energy is denoted as . The difference between these two, =, describes the correction caused by ETDV. To get at arbitrary temperature between - K we fit a 4th order polynomial from
| (3) | |||||
The final vibrational free energy is computed as = (we omit the subscript ‘eQHA’ and denote as ).
Phonon frequencies in the above procedure are determined by density functional perturbation theory (DFPT)[26] as implemented in the Quantum ESPRESSO[27] package. The dynamical matrices are computed on an -mesh (29 points in the irreducible wedge of the Brillouin Zone). Force constant interpolation is used to calculate phonon frequencies at arbitrary vectors. The summation in Eq. (2) is evaluated on a -mesh.
The electronic free energy is determined by using the Mermin functional[25] and Fermi-Dirac smearing. Similar to getting , we first compute at every K from K to K, then we fit them to a 4th order polynomial
| (4) |
Terms other than represent deviations from the lowest-order Sommerfeld expansion , where is the electronic density of states at Fermi energy and volume . We find below K, keeping only the quadratic term does not introduce much error. The influence of the higher order terms becomes prominent at high temperatures. At K, the error reaches about %. The fitted quadratic coefficient differs from the Sommerfeld value by % (= Å3) to % (= Å3). It seems the Sommerfeld expansion works better at high pressures, where the electronic bands are more dispersive and is smaller. We combine with the static energy from LAPW and the vibrational free energy from the same pseudopotential to get the total free energy at volume . There are two popular parameterized forms to fit the total free energy , 4th order Birch-Murnahan[28](BM) and Vinet.[29] We find BM and Vinet are comparable in accuracy to fit the static and low temperature free energy, but BM yields much lower residual energies than Vinet for the high temperature results. Thus we use 4th order BM to get . Other thermodynamical properties are computed by finite difference.
All the pseudopotential calculations are carried out with the same plane-wave cutoff of Ry, charge-density cutoff of Ry, and a shifted Monkhorst-Pack mesh. To determine the convergence uncertainties of our results, we choose one volume ( = Å) and recompute its phonon frequencies at = 0 K, with a mesh and a higher plane-wave cutoff ( Ry). The two sets of phonon frequencies differ by % at most. The corresponding differ by mRy at K, mRy at K. The influence of ETDV is much greater than the convergence uncertainties. For some modes phonon frequencies change by % or more from = K to = K. The free energy correction is about mRy at K.
III Summary of Previous Works
Besides the two calculations[11, 12] mentioned in the introduction, which focus on the thermal EOS of platinum, there are some other papers related to this subject. Cohen et al.[30] computed the static EOS of platinum using LAPW and PBE, and treated it as an example to discuss the accuracy of different EOS formations. They found Vinet fitted better than 3rd order BM. The accuracy of 4th order BM and Vinet were comparable. Tsuchiya et al.[31] computed the electronic thermal pressure () of Au and Pt using LMTO and LDA. At K, is GPa for Pt, while only GPa for Au. This is caused by the different of the two metals. The small ETDV effect ( % change in phonon frequency from = K to K) observed on gold[32] is consistent with this picture. Wang et al.[33] used LAPW and an average potential method to determine the thermal contributions. Then they reduced the experimental shock Hugoniot and got the room temperature isotherm of Pt. This isotherm is very similar to that of Holmes et al., in spite of the fact that in the latter case, thermal pressure is estimated semi-empirically. Ref. 34 computed the static EOS of platinum using pseudopotentials with/without spin-orbit effects up to GPa. In the following section, we compare our calculations with these previous ones whenever appropriate.
On the experimental side, The reduced isothermal -- EOS from shock wave experiments are widely used as primary pressure scales. At present they are also the only experimental sources for -- data at very high pressures. The shock Hugoniot of platinum was first obtained by using chemical explosives.[1] The reduced room temperature isotherm was up to GPa. Holmes et al.[4] went to higher compression ratio using a two-stage light-gas gun. The final shock Hugoniot is a combination of these two sets of data. In spite of the crucial role of the reduced shock EOS, its accuracy suffers from low precision in measurements, and theoretical simplifications made in the reducing process.[35, 10] With the development of DAC and third-generation synchrotron light source, cross-checking different pressure scales became feasible. More accurate thermal EOS were obtained by using this method.[8, 15]
Recently, Dorogokupets et al.[36] constructed a semi-empirical model to describe the thermal properties of Al, Au, Cu, Pt, Ta and W, The model contains about 20 parameters, which are fitted to the available experimental data on the heat capacity, enthalpy, volume, thermal expansivity, bulk modulus and shock Hugoniot. Based on this model they reanalyzed the data in Ref. 8 up to 100 GPa. The resulting EOS, which are consistent with the measured thermal properties, are believed to be more accurate than the original in the corresponding pressure range.[37] A simplified version of the model[38] yields similar EOS at low pressures. However their high pressure extrapolations differ by 2.5 % near 240 GPa. It will be interesting to use DFT to explore the EOS at very high pressures, which are still out of reach for the current DAC experiments.
IV Results and Discussions
IV.1 Static Equation of State
Before studying the EOS at finite temperature, we examine the static EOS computed by using different exchange-correlation functionals, and compare them with previous calculations. Excluding the thermal effects (which amount to GPa at room temperature) helps to identify the origin of their differences. Fig. 1 shows the static pressure vs. volume relations using different exchange-correlation functionals. The corresponding EOS parameters are listed in Table 1. The experimental data at room temperature are also included in the figure to give a rough estimate of the difference. Comparing to the experiments, in the entire volume range LDA underestimates pressure while PBE overestimates. WC improves on PBE, but still overestimates. A detailed comparison between the calculated room temperature isotherms (including the thermal effects) and the experimental data will be given in Sec. IV.3. DFT has many different implementations, such as LAPW, LMTO, and various pseudopotentials. If the calculations are good, they should yield similar results. We compare our LDA calculations with previous ones in Fig. 2. Two of our own pseudopotential calculations are included for comparison. One is the Vanderbilt pseudopotential that we use to compute the thermal effects, denoted as pseudo-1. The other is a Rappe-Rabe-Kaxiras-Joannopoulos pseudopotential from the PWSCF website (Pt.pz-nd-rrkjus.UPF), denoted as pseudo-2. The static EOS predicted by pseudo-1 is similar to that of LAPW. Their EOS parameters differ by no more than 0.5 %. The previous overestimations of pressure are probably caused by the large cutoff radius and insufficient number of valence electrons (Ref. 12), or another issue related to the negative electronic thermal pressure (Ref. 11).


| Vinet | B-M | ||||||
| (Å3) | (GPa) | (Å3) | (GPa) | (GPa-1) | |||
| LDA | 14.752 | 308.02 | 5.446 | 14.761 | 309.29 | 5.295 | -0.02666 |
| LDA+SO | 14.784 | 301.17 | 5.533 | 14.785 | 301.13 | 5.510 | -0.03214 |
| LDA(pseudo-1) | 14.719 | 308.69 | 5.423 | 14.726 | 309.61 | 5.295 | -0.02681 |
| LDA(pseudo-2) | 15.055 | 297.48 | 5.515 | 15.060 | 299.28 | 5.375 | -0.02873 |
| LDAa | 14.90 | 300.9 | 5.814 | ||||
| LDAb | 15.073 | 293 | 5.56 | ||||
| LDAc(HGH) | 14.82 | 305.99 | 5.32 | – | |||
| LDA+SOc,d(TM) | 15.2 | 291.18 | 5.35 | – | |||
| PBE | 15.679 | 242.50 | 5.639 | 15.678 | 245.88 | 5.464 | -0.03620 |
| PBE+SO | 15.751 | 231.97 | 5.762 | 15.754 | 229.96 | 5.850 | -0.04932 |
| PBEa | 15.77 | 243.3 | 5.866 | ||||
| PBEc(HGH) | 15.59 | 250.85 | 5.65 | – | |||
| PBEe | 15.69 | 248.9 | 5.43 | ||||
| WC | 15.171 | 280.63 | 5.500 | 15.177 | 283.49 | 5.306 | -0.02889 |
| WC+SO | 15.223 | 269.97 | 5.630 | 15.223 | 269.00 | 5.670 | -0.03893 |
Platinum is a heavy element, and its electronic band structure is sensitive to spin-orbit effect.[40] We find inclusion of the spin-orbit effect increases the equilibrium volume, no matter which exchange correlation functional is used. This tendency has also been observed by Bercegeay et al.[34] in their pseudopotential calculations. However, the EOS parameters are not independent of each other. The variation of the equilibrium volume largely compensates that of the bulk modulus and the actual pressure difference is within 0.7 % at high pressures.
Using pseudopotentials instead of the all electron LAPW may introduce error in computing phonon frequencies, especially at high pressures. Since lattice vibrations are closely related to the force/stress on the atoms, we estimate the error in phonon frequencies by analysing the error in static pressure. At high pressures (150-550 GPa), the pressure difference between LAPW (with LDA functional) and pseudo-1 is about %. The error in phonon frequencies caused by using pseudo-1 is likely to be of the same order. Since the influence of spin-orbit effect is half of the pseudopotential uncertainty, it is ignored completely in the following calculations.
IV.2 Phonon Dispersion and Its Electronic Temperature Dependence
Fig. 3 shows the phonon dispersions at the experimental ambient condition lattice constant = a.u..[8] One is computed at = K. The other at = K, close to platinum’s melting point at ambient pressure K.[41] The Kohn anomaly (near =) disappears when the electronic temperature is high, and the vibrational DOS varies noticeably. The corresponding corrections to the vibrational free energy, , are shown in Fig. 4 (a). is always positive. As volume decreases, it diminishes and finally becomes negligible. ETDV originates in the thermal excitations of the electrons near the Fermi surface, and the number of thermal excited electrons is proportional to in the lowest-order Sommerfeld expansion. For smaller volumes, the electronic bands are more dispersive and decreases, as shown in Fig. 4(b). ETDV diminishes accordingly.


Figure 5 and 6 show the volume thermal expansion coefficient , heat capacity at constant pressure , entropy , and the temperature-dependent part of the Gibbs free energy =-. Including ETDV removes about half of the discrepancies between experiments and calculations based on normal QHA. The remaining small differences between theory and experiment are attributed to anharmonic phonon-phonon interactions[42] and electron-phonon interactions.[43] These two effects are of the same order of magnitude[43] as for metals, but explicit perturbative calculations to determine their magnitudes are computational demanding and beyond the scope of the current paper. We notice DFT calculations based on QHA describe well the thermal properties of other metals, such as gold,[32] silver,[44] copper,[45] up to melting point. This is in contrast with ionic crystals like MgO, where there are large deviations from QHA at high temperatures. It is possible that the effects of anharmonic phonon-phonon interaction and electron-phonon interaction tend to cancel each other in these metals. Further work is needed to clarify this issue.


IV.3 Room Temperature Isotherms
By fitting the total Helmholtz free energy at K, we get the theoretical K isotherms, as shown in Fig. 7. Their parameters are listed in Table 2. In the low pressure range, the LDA isotherm and the experimental data are almost parallel. As pressure increases, they start to merge. It seems LDA works better at high pressures. Regarding to EOS parameters, LDA gives equilibrium volumes closest to the experiments, WC yields closest bulk modulus () and the derivative of the bulk modulus (). Some people[8, 34] prefer to compare pressures from two EOS (labeled as EOS-I and EOS-II) at the same compression, i.e. the same value of . is the corresponding equilibrium volume, for EOS-I, for EOS-II. Such comparisons can give favorable agreement when and of EOS-I are close to those of EOS-II, even and are quite different.[8] As mentioned before, the EOS parameters are not independent of each other. It can be fortuitous that and agree well. Judged from pressure vs. volume relation, LDA is the optimal functional for platinum. It is worth noting the LDA (HGH) pressure vs. volume relation reported in Ref. 34 is similar to those obtained in this study. However, Ref. 34 presents data in volume vs. compression, and concludes LDA overestimates pressure by GPa near GPa. In fact, although ( GPa from this study) is much larger than ( GPa from Ref. 8), the bulk modulus computed at the experimental equilibrium volume (15.095 Å3) is GPa, quite close to . Thus when plotted in pressure vs. volume, the isotherm computed by LDA is nearly parallel with the experimental data in the low pressure range.


| Vinet | B-M | ||||||
|---|---|---|---|---|---|---|---|
| (Å3) | (GPa) | (Å3) | (GPa) | (GPa-1) | |||
| LDA | 14.884 | 291.25 | 5.547 | 14.886 | 291.65 | 5.496 | -0.03232 |
| LDA () | 269.96 | 5.640 | 269.91 | 5.626 | -0.03730 | ||
| LDAa | 15.188 | 281 | 5.61 | ||||
| PBE | 15.864 | 225.55 | 5.751 | 15.866 | 225.34 | 5.741 | -0.04709 |
| WC | 15.322 | 263.93 | 5.601 | 15.325 | 264.72 | 5.530 | -0.03580 |
| Holmesb | 15.10 | 266 | 5.81 | ||||
| Dewaelec | 15.095 | 273.6 | 5.23 | ||||
| Dorogokupetsd | 15.095 | 276.07 | 5.30 | ||||
| McQueene | 15.123 | 277.715 | 4.821 | -0.01379 |
IV.4 Thermal EOS of Platinum for Pressure Calibration
In the previous sections the thermal properties of platinum is discussed from a pure theoretical point of view. We have computed the static lattice energy using LAPW, and found spin-orbit interactions are not important in determining the EOS of platinum. We have used QHA to calculate the vibrational free energy , and found including ETDV improves the agreement on the thermal properties. We have calculated the electronic free energy using Mermin functional. The resulting thermal properties, e.g. the temperature-dependent part of the Gibbs energy , are close to the experimental data at GPa, The room temperature isotherm computed by LDA merges to the reduced shock data at high pressures, indicating LDA works better at high pressures.
Based on these DFT results and all the available experimental data, we try to construct a consistent -- EOS of platinum up to GPa and K. To reach this goal, first we need to include the physical effects which are missing in our original model. A phenomenological term[38] is added to the total Helmholtz energy to account for the anharmonic phonon-phonon interactions and electron-phonon interactions, where is the volume of a primitive cell at ambient condition ( Å). The quadratic temperature dependence comes from the lowest order perturbation at high temperatures. and are two parameters to be fitted. We find setting equals K-1, equals yields good agreement between theory and experiments on , and at GPa, as illustrated in Figs. 5(a) and 6(a). The contribution to thermal pressure can be estimated by differentiating with respect to volume. At K, is GPa when equals , GPa when equals .
Having obtained accurate , the next step is to get reliable . We choose the room temperature EOS developed by Dorogokupets et al.[36] as our reference below GPa. It has been cross checked with other pressure scales, and is likely to be more accurate than the reduced shock data of Ref. 1 in this pressure range. On the other hand, extrapolating an EOS fitted at low pressures to higher range can be dangerous. We assume LDA works better at high pressures, and the difference between the exact (obtained in an ideal, very accurate experiment) and LDA isotherm approaches to zero as pressure increases.
We compare Dorogokupets’s EOS[36] (=15.095 Å3, =276.07 GPa, = in Vinet form) with our room temperature isotherm computed by LDA (=14.884 Å3, =291.25 GPa, = in Vinet form). The volume difference between these two at each pressure is shown in Fig. 8. Since decreases rapidly as pressure increases, we use exponentially decaying functions to fit and extrapolate. We correct the calculated room temperature Gibbs energy by setting . The isotherm derived from coincides with Dorogokupets’ EOS below GPa. the upper limit of their fitting. Above GPa, is almost zero, and the isotherm derived from is the same as the uncorrected one. The uncertainty due to volume extrapolation in the intermediate region ( GPa to GPa) is estimated from bulk modulus to be less than GPa. It is worth noting that the established EOS of platinum are quite quite similar to each other below GPa, as shown in Fig. 7(b). Choosing a different reference such as the one in Ref. 8 will only change the results near GPa by GPa.

We combine with the temperature-dependent part of the Gibbs energy , and get the corrected Gibbs energy at temperature . From we derive all the other thermodynamical properties. Thermal properties like , , , which depend on the temperature derivatives of the Gibbs energy, are not affected by changing . In contrast, the isothermal bulk modulus and adiabatic bulk modulus will be influenced, as shown in Fig. 9.


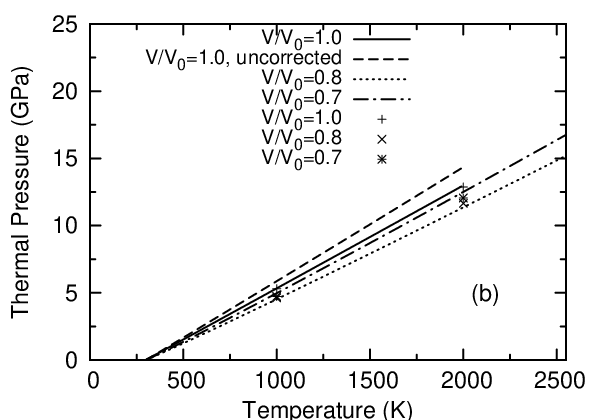
After corrections, both thermal expansivity and bulk modulus agree with the experiments well. We expect the product to be accurate. Integrating we get the thermal pressure, . The calculated and , before and after corrections, are shown in Fig. 10. is often assumed to be independent of volume and linear in temperature, i.e. is a constant. Ref. 1 assumes the thermal energy , the thermal Grüneisen parameter , where =, and = Å3. The thermal pressure is obtained from Mie-Grüneisen relation
| (5) |
In Ref. 4, is estimated to be GPa/K. Both values lie within the variation of the calculated , as shown in Fig. 10(a). We find that () has noticeable volume dependence. At fixed temperature, it first decreases, reaches a minimum at about , then increases. Such behavior originates in the pressure dependence of the thermal expansivity (Fig. 5(b)) and bulk moduli (Fig. 9(b)). This feature has also been observed in Ref. 36, as shown in Fig. 10(b). However it is missing in the previous ab initio calculation.[11]

Thermal Grüneisen parameter is an important quantity. Empirically it is often assumed to be independent of temperature. Its volume dependence is described by a parameter =, and can be represented in as From Mie-Grüneisen relation, it is obvious that is related to the volume dependence of . If equals 1, is independent of volume. If is greater than 1, gets smaller as volume decreases. In Ref. 1 is assumed to equal . Fei et al.[9] determined by fitting the measured -- data to the Mie-Grüneisen relation up to GPa. They gave = and =. Zha et al.[10] extended measurements to GPa and K. Their fit gave = and =. Our calculation indicates that the temperature dependence of is small. The volume dependence of is shown in Fig. 11. The uncorrected DFT calculation tends to overestimate . At ambient condition equals . After corrections, =. The corresponding equals , much larger than the value obtained in Ref. 9 and 10. We notice previous DFT calculation on gold[32] also gives much larger than the value in Ref. 9. This is probably due to the small pressure range explored in Ref. 9, and limited number of data points measured in Ref. 10.


Adding the thermal pressure to the room temperature isotherm, we get the thermal EOS of platinum, as shown in Table 3. We compare our results with two DAC measurements in Fig. 12. Within the error of the experiments, the agreement is reasonably good. For convenience of interpolation, parametric forms of the thermal EOS are listed in Table 4.
| 0.00 | 0.00 | 1.51 | 5.31 | 9.14 | 12.97 | ||||||
|---|---|---|---|---|---|---|---|---|---|---|---|
| 0.05 | 16.22 | 17.62 | 21.20 | 24.83 | 28.48 | 32.16 | |||||
| 0.10 | 38.32 | 39.64 | 43.05 | 46.52 | 50.03 | 53.57 | 57.14 | ||||
| 0.15 | 68.41 | 69.67 | 72.97 | 76.34 | 79.77 | 83.24 | 86.73 | 90.25 | |||
| 0.20 | 109.46 | 110.71 | 113.99 | 117.37 | 120.82 | 124.31 | 127.83 | 131.39 | 134.98 | ||
| 0.25 | 166.45 | 167.74 | 171.15 | 174.69 | 178.29 | 181.94 | 185.63 | 189.36 | 193.13 | 196.94 | 200.81 |
| 0.30 | 247.37 | 248.72 | 252.34 | 256.07 | 259.88 | 263.73 | 267.64 | 271.58 | 275.57 | 279.58 | 283.63 |
| 0.35 | 362.30 | 363.65 | 367.31 | 371.10 | 374.98 | 378.91 | 382.90 | 386.94 | 391.01 | 395.12 | 399.25 |
| 0.40 | 525.86 | 526.93 | 530.04 | 533.39 | 536.86 | 540.40 | 543.99 | 547.62 | 551.28 | 554.99 | 558.76 |


| (1) | |||||
|---|---|---|---|---|---|
| (Å3) | 14.9924 | 0.295837 | 0.194441 | -0.0917141 | 0.024365 |
| (GPa) | 290.539 | -45.4082 | -9.38792 | 5.09573 | -1.40266 |
| 5.11956 | 0.52903 | 0.0733263 | -0.0195011 | 0.0229666 | |
| (GPa-1) | -0.0275729 | -0.0120014 | -0.0114928 | 0.00672243 | -0.00359317 |
| (2) | |||||
| (Å3) | 13.2246 | 0.128227 | 0.049052 | -0.0160359 | 0.00241857 |
| (GPa) | 523.48 | -30.3849 | -3.86087 | 1.31313 | -0.222027 |
| 4.24183 | 0.217262 | -0.0235333 | 0.00944835 | -0.000371746 | |
| (GPa-1) | -0.00125873 | -0.00268918 | 2.13874e-05 | -3.57657e-05 | -1.75847e-05 |
| (3) | |||||
| (Å3) | 11.4929 | 0.0672156 | 0.0119585 | -0.00243269 | 0.000219022 |
| (GPa) | 951.004 | -21.0874 | -2.84254 | 0.654708 | -0.0639296 |
| 4.31383 | 0.05775 | -0.00505386 | 0.00245414 | -0.000167453 | |
| (GPa-1) | -0.00588145 | -0.00130468 | 0.000221904 | -6.51359e-05 | 4.99978e-06 |
The -- thermal EOS we obtained are very similar to the one in Ref. 36 below GPa, This is expectable as we used the K isotherm in Ref. 36 as the reference to correct the room temperature Gibbs energy, and the thermal properties calculated from both approaches agree well with the experiments. In this - range, the uncertainty of our EOS is comparable to the one in Ref. 36 . Above GPa, the uncertainty is about %, which is difference between the LAPW (LDA) and pseudo-1 static EOS. Other sources of error, e.g. convergence uncertainty ( %) and ignoring spin-orbit effect ( %) are smaller effects. To check the accuracy of our thermal EOS at high pressures, we start from the corrected Gibbs energy and compute the theoretical Hugoniot by solving the Rankine-Hugoniot equation:
| (6) |
where , are the internal energy, pressure at volume and temperature . , are the internal energy, pressure at the initial volume and temperature . The results are shown in Fig. 13. The predicted Hugoniot pressure is in good agreement with measurements. The temperature predicted by DFT is lower than the empirically deduced value in Ref. 1. The reduction in Ref. 1 neglects the electronic thermal pressure, and this may cause overestimating Hugoniot temperature.[4]
We end this section by comparing our room temperature isotherm with that of Holmes et al.. Below 70 GPa, they are almost identical. At high pressures (- GPa), the pressure from our EOS is about % lower than the one from Holmes et al.. Holmes et al. used LMTO with the atomic-sphere approximation to get the static EOS. In principle, the full potential LAPW method used in this study is more accurate. It seems the EOS of Holmes et al. overestimates pressure systematically at high compression ratio. But the magnitude is much smaller than the pressure offset needed to compensate the discrepancy between Mao et al.’s experiment and seismological extrapolation. The real cause of the discrepancy might be a combination of several factors.


V Conclusions
In this paper, we report our calculations on the static and thermal EOS of platinum using DFT with different exchange correlation functionals. Contrary to previous reports, we find the room temperature isotherm computed with LDA lies below, and nearly parallel to the experimental compression data. We study the lattice dynamics of platinum within QHA, and find the electronic temperature dependence of vibrations plays a noticeable role in determining the thermal properties of platinum. Combining the experimental data with DFT calculations, we propose a consistent thermal EOS of platinum, up to GPa and K, which can be used as a reference for pressure calibration.
Acknowledgements.
We thank P. B. Allen, P. I. Dorogokupets, A. Floris, B. B. Karki for discussions and help; A. Dewaele for suggestions and taking Ref. 38 to our attention; Y. W. Fei for sending us Ref. 10. We are in debt to the anonymous referees for careful reviews. The pseudopotential calculations were performed at the Minnesota Supercomputing Institute (MSI) with the Quantum ESPRESSO package (http://www.pwscf.org). The LAPW calculations were performed at Brookhaven National Laboratory (BNL) with the WIEN2k package (http://www.wien2k.at). TS was supported by NSF ITR Grant No. ATM0426757. RMW, KU, and ZW were supported by NSF/EAR 0230319, 0635990, and NSF/ITR 0428774 (VLab).References
- [1] R. G. McQueen, S. P. Marsh, J. W. Taylor, J. M. Fritz, and W. J. Carter, in High Velocity Impact Phenomena, edited by R. Kinslow (Academic press, New York, 1970), chap. 7.
- [2] J. A. Morgan, High Temp. High Pressures 6, 195 (1974).
- [3] J. C. Jamieson, J. N. Fritz, and M. H. Manghnani, in High-Pressure Research in Geophysics, edited by S. Akimoto and M. H. Manghnani (Cent. for Acad. Publ., Tokyo, 1982).
- [4] N. C. Holmes, J. A. Moriarty, G. R. Gathers, and W. J. Nellis, J. Appl. Phys. 66, 2962 (1989).
- [5] H. K. Mao, Y. Wu, L. C. Chen, and J. F. Shu, J. Geophys. Res. 95, 21737 (1990).
- [6] F. D. Stacey and P. M. Davis, Phys. Earth Planet. Inter. 142, 137 (2004).
- [7] A. K. Singh, Phys. Earth Planet. Inter. 164, 75 (2007).
- [8] A. Dewaele, P. Loubeyre, and M. Mezouar, Phys. Rev. B 70, 094112 (2004).
- [9] Y. W. Fei, A. Ricolleau, M. Frank, K. Mibe, G. Shen, and V. Prakapenka, Proc. Natl. Acad. Sci. USA 104, 9182 (2007).
- [10] C. S. Zha, K. Mibe, W. A. Bassett, O. Tschauner, H. K. Mao, and R. J. Hemley, J. Appl. Phys. 103, 054908 (2008).
- [11] S. K. Xiang, L. C. Cai, Y. Bi, F. Q. Jing, and S. J. Wang, Phys. Rev. B 72, 184102 (2005).
- [12] E. Menéndez-Proupin and A. K. Singh, Phys. Rev. B 76, 054117 (2007).
- [13] J. P. Perdew and A. Zunger, Phys. Rev. B 23, 5048 (1981).
- [14] There are two LDA ultrasoft Rappe-Rabe-Kaxiras-Joannopoulos pseudopotentials on the PWSCF (www.pwscf.org) website. ‘Pt.pz-rrkjus.UPF’ is the one without nonlinear core correction ‘Pt.pz-nd-rrkjus.UPF’ includes this correstion. Both have a cutoff radius of 2.6 a.u., both yield static EOS stiffer than that of Holmes et al. The results reported in PRB (76) 054117 (2007) are very close to our calculations using ‘Pt.pz-nd-rrkjus.UPF’.
- [15] Y. W. Fei, J. Li, K. Hirose, W. Minarik, J. V. Orman, C. Sanloup, W. V. Westrenen, T. Komabayashi, and K. Funakoshi, Phys. Earth Planet. Inter. 143-144, 515 (2004).
- [16] D. H. Dutton, B. N. Brockhouse, and A. P. Miller, Can. J. Phys. 50, 2915 (1972).
- [17] P. Blaha, K. Schwarz, G. K. H. Madsen, D. Kvasnicka, and J. Luitz, in WIEN2k: An Augmented Plane Wave and Local Orbitals Program for Calculating Crystal Properties, edited by K. Schwarz (Vienna University of Technology, Vienna, Austria, 2001).
- [18] J. P. Perdew, K. Burke, and M. Ernzerhof, Phys. Rev. Lett. 77, 3865 (1996).
- [19] Z. Wu and R. E. Cohen, Phys. Rev. B 73, 235116 (2006).
- [20] H. J. Monkhorst and J. D. Pack, Phys. Rev. B 13, 5188 (1976).
- [21] P. E. Blőchl, O. Jepsen, and O. K. Andersen, Phys. Rev. B 49, 16223 (1994).
- [22] D. Vanderbilt, Phys. Rev. B 41, 7892 (1990).
- [23] S. G. Louie, S. Froyen, and M. L. Cohen, Phys. Rev. B 26, 1738 (1982).
- [24] M. Methfessel and A. T. Paxton, Phys. Rev. B 40, 3616 (1989).
- [25] N. D. Mermin, Phys. Rev. 137, A1441 (1965).
- [26] S. Baroni, P. Giannozzi, and A. Testa, Phys. Rev. Lett. 58, 1861 (1987).
- [27] S. Baroni, A. DalCorso, S. de Gironcoli, P. Giannozzi, C. Cavazzoni, G. Ballabio, S. Scandolo, G. Chiarotti, P. Focher, A. Pasquarello, K. Laasonen, A. Trave, R. Car, N. Marzari and A. Kokalj, http://www.pwscf.org/.
- [28] F. Birch, Phys. Rev. 71, 809 (1947).
- [29] P. Vinet, J. R. Smith, J. Ferrante, and J. H. Rose, Phys. Rev. B 35, 1945 (1987).
- [30] R. E. Cohen, O. Gülseren, and R. J. Hemley, Am. Mineral. 85, 338 (2000).
- [31] T. Tsuchiya and K. Kawamura, Phys. Rev. B 66, 094115 (2002).
- [32] T. Tsuchiya, J. Geophys. Res. 108, 2462 (2003).
- [33] Y. Wang, R. Ahuja, and B. Johansson, J. Appl. Phys. 92, 6616 (2002).
- [34] C. Bercegeay and S. Bernard, Phys. Rev. B 72, 214101 (2005).
- [35] A. D. Chijioke, W. J. Nellis, and I. F. Silvera, J. Appl. Phys. 98, 073526 (2005).
- [36] P. I. Dorogokupets and A. R. Oganov, Phys. Rev. B 75, 024115 (2007).
- [37] A. Dewaele, private communication.
- [38] P. I. Dorogokupets and A. Dewaele, High Pressure Res. 27, 431 (2007).
- [39] This TM pseudopotential is constructed from atomic configuration, the cutoff radius of is a.u., which is probably too large. The HGH pseudopotential is constructed from and does not have this problem.
- [40] A. DalCorso and A. M. Conte, Phys. Rev. B 71, 115106 (2005).
- [41] A. Kavner and R. Jeanloz, J. Appl. Phys. 83, 7553 (1998).
- [42] R. A. Cowley, Rep. Progr. Phys. 31, part 1, 123 (1968).
- [43] P. B. Allen and J. C. K. Hui, Z. Physik B 37, 33 (1980).
- [44] J. Xie, S. de Gironcoli, S. Baroni, and M. Scheffler, Phys. Rev. B 59, 965 (1999).
- [45] S. Narasimhan and S. D. Gironcoli, Phys. Rev. B 65, 064302 (2002).
- [46] R. K. Kirby, Inter. J. of Thermophys. 12, 679 (1991).
- [47] J. W. Arblaster, Platinum Metals Rev. 38, 119 (1994).
- [48] S. M. Collard and R. B. McLellan, Acta Metall. Mater. 40, 699 (1992).