The dark matter environment of the Abell 901/902 supercluster: a weak lensing analysis of the HST STAGES survey
Abstract
We present a high resolution dark matter reconstruction of the Abell 901/902 supercluster from a weak lensing analysis of the HST STAGES survey. We detect the four main structures of the supercluster at high significance, resolving substructure within and between the clusters. We find that the distribution of dark matter is well traced by the cluster galaxies, with the brightest cluster galaxies marking out the strongest peaks in the dark matter distribution. We also find a significant extension of the dark matter distribution of Abell 901a in the direction of an infalling X-ray group Abell . We present mass, mass-to-light and mass-to-stellar mass ratio measurements of the structures and substructures that we detect. We find no evidence for variation of the mass-to-light and mass-to-stellar mass ratio between the different clusters. We compare our space-based lensing analysis with an earlier ground-based lensing analysis of the supercluster to demonstrate the importance of space-based imaging for future weak lensing dark matter ‘observations’.
1 Introduction
Observations and theory both point to the importance of environment on the properties of galaxies. Early-type galaxies are typically found in more dense regions compared to late-type galaxies (Dressler, 1980), galaxy colour and luminosity are found to be closely related to galaxy density (Blanton et al., 2005) and the fraction of star-forming galaxies also shows a strong sensitivity to the density on small Mpc scales (Balogh et al., 2004; Blanton et al., 2006). Theoretically there are a number of physical mechanisms that could cause these effects in dense environments. These processes can change the star formation history, gas content and/or morphology of a galaxy through, for example, ram-pressure stripping (Gunn & Gott, 1972; Larson et al., 1980; Balogh et al., 2000) and/or the tidal effects of nearby galaxies (Moore et al., 1996, galaxy harassment,) and/or the tidal effects of the dark matter potential (Bekki, 1999; Moore et al., 1998). They depend differently on cluster gas, galaxy density and the dark matter potential however, with ram-pressure stripping dependent on the gas distribution compared to tidal effects which are dependent on the overall potential. A key difficulty in disentangling these effects observationally, is that typically the tidal potential is only constrained in a global sense through the measured velocity dispersion of a cluster, or a richness or total luminosity estimate. This results in an assumed spherical tidal potential model that is smoothed over the small scales that are relevant for tidal stripping and harassment studies.
In this paper we study the complex Abell 901/902 supercluster, hereafter A901/2, in the first of a series of papers from the STAGES11 1 ‘Space Telescope A901/902 Galaxy Evolution Survey’ (HST GO-10395, PI M. E. Gray), www.nottingham.ac.uk/ppzmeg/stages collaboration. From a rich multi-wavelength dataset the A901/2 supercluster permits a thorough investigation of the relationships between galaxy morphology (Gray et al., 2008; Lane et al., 2007, from Hubble Space Telescope (HST) and ground-based imaging,), luminosity, stellar mass and colour (Wolf et al., 2003; Borch et al., 2006, from the COMBO-17 survey with 17-band optical imaging,), star formation rates (Bell et al., 2007, from 24m Spitzer data,), galaxy density (Wolf et al., 2005; Gray et al., 2004), and the hot intra-cluster medium (Gilmour et al., 2007; Gray et al., 2008, from XMM observations,). One of the key reasons to obtain HST imaging of this supercluster was to construct a high resolution, reliable and accurate map of the projected total mass density distribution. Using weak gravitational lensing techniques we are able to reconstruct the distribution of both dark and luminous matter and quantify the significance of the structures that are seen, updating the previous ground-based weak lensing analysis of Gray et al. (2002). This extra dimension to the multi-wavelength view of A901/2 will be a key ingredient in future studies where we hope to be able to separate the effects of tidal and gas-dynamical influence on galaxy formation and evolution.
Weak gravitational lensing is now a well established method for studying the distribution of dark matter. Light from distant galaxies is deflected by the gravitational effect of the intervening structures, inducing a weakly coherent distortion in the shapes of galaxy images. The strength of this lensing effect is directly related to the projected mass along the line of sight, and it can therefore be used to map dark matter in dense regions (Gray et al., 2002; Gavazzi et al., 2004; Dietrich et al., 2005; Clowe et al., 2006; Mahdavi et al., 2007, see for example).
The first weak lensing analysis of A901/2 by Gray et al. (2002) used deep ground-based -band observations from the COMBO-17 survey (Wolf et al., 2003). This analysis revealed three significant peaks in the dark matter distribution at the locations of the A901a, A901b and A902 clusters, in addition to a low significance south west peak co-incident with a galaxy group, hereafter referred to as the SW group. This analysis also showed a filamentary extension between the A901a and A901b clusters. As this filament was located across the CCD chip boundary in the mosaic image, however, Gray et al. (2002) could not rule out the possibility of this structure originating from residual uncorrected distortions from the point spread function (PSF) of the telescope and detector. The Gray et al. (2002) ground-based analysis also reported a candidate giant arc. The STAGES HST imaging can rule out this candidate arc as a co-incidental alignment of objects. STAGES does however resolve several other candidate arcs around supercluster galaxies, which will be presented in Aragón-Salamanca et al. (2008) and Gray et al. (2008).
Using the accurate photometric redshift information from the A901/2 17-band observations of the COMBO-17 survey, where the photometric redshift error for , Taylor et al. (2004) extended the Gray et al. (2002) analysis, by creating a three-dimensional reconstruction of the A901/2 dark matter distribution. This analysis revealed a previously unknown higher redshift cluster located behind A902 that is at . This cluster was named, and hereafter referred to as, CB1 by Taylor et al. (2004). We have updated the redshifts of both CB1 and A901/2 in this analysis based on an improved photometric redshift catalogue and the addition of some spectroscopic redshifts.
In this analysis we revisit the dark matter distribution in A901/2 using deep HST observations. The dominant source of noise in the weak lensing analysis of clusters is the Gaussian noise introduced from the random intrinsic ellipticities of galaxies. Weak lensing maps of dark matter on small scales therefore benefit greatly from the high resolution that HST has to offer. HST triples the number density of resolved galaxies from which the lensing signal can be measured, reducing the intrinsic ellipticity noise on small scales. In addition, the high resolution space-based data permits higher signal-to-noise shape measurements and a narrower PSF, thus implying a more accurate PSF correction.
This paper is organised as follows. In section 2 we describe the weak lensing theory that is related to this analysis, and the maximum likelihood method that we use to reconstruct the dark matter distribution. We describe the data and weak lensing measurement method in section 3. We present our results in section 4, including NFW profile mass measurements in section 4.1 and the dark matter reconstruction and ground-based comparison in section 4.2. A first comparison of the dark matter, galaxy light and stellar mass distribution is presented in section 4.3 along with mass, mass-to-light and mass-to-stellar mass ratio measurements. A more detailed comparison of the mass, gas and galaxies of A901/2 will appear in a forthcoming analysis. We investigate the significance of the supercluster substructure that is resolved in our dark matter reconstruction in section 4.4 and discuss our findings and conclude in section 5. Throughout this paper we assume a CDM cosmology with , , and . All magnitudes are given in the Vega system.
2 Method and Theory
Gravitational lensing is sensitive to the projected surface mass density along the line of sight , typically denoted by the convergence . In the case of a single lens,
| (1) |
where is the angular diameter distance to the lens, is the angular diameter distance to the lensed source galaxies, and is the angular diameter distance from the lens to the source.
The coherent distortion, or reduced shear , that is detected in the images of distant sources allows for the reconstruction of the projected intervening matter as , and
| (2) |
where is the true shear, , and is the second derivative of the lensing potential (Bartelmann & Schneider, 2001, see for example).
The strength of all lensing distortions is invariant under the transformation , where is a constant (Gorenstein et al., 1988). This is known as the ‘mass sheet degeneracy’ implying that all lensing observations are insensitive to a constant mass sheet across the field of view () in addition to a dependent rescaling of the ‘original’ surface mass density. For wide-field images of relatively isolated clusters, where is weak, one can significantly reduce this bias using the statistic of Clowe et al. (1998). The statistic gives a model free estimate of the mass enclosed within a radius and is given by
| (3) |
where is defined to be the radius outside which the cluster density is expected to be very low, based on initial mass estimates, and is the field-of-view radius. The second term therefore essentially measures the constant . In the case of A901/2 we find where is measured from the centre of the STAGES mosaic which is centred on the supercluster. This measure is consistent with what would be expected from large-scale structure and the NFW multi-halo model of the A901/2 supercluster that we develop in section 4.1. We therefore assume a zero mass sheet degeneracy correction in the analysis that follows.
2.1 Dark Matter reconstruction
In this paper we use a maximum likelihood method to reconstruct the surface mass density . Starting with a ‘best guess’ Kaiser & Squires (1993) reconstruction, the lensing potential is constructed on a pixelised grid and is allowed to vary to produce the minimum difference between the reconstructed and observed reduced shear field. The benefit of using this method is that a varying noise estimate can be obtained across the whole region enabling the significance of each structure in the dark matter map to be accurately quantified. Furthermore it does not rely on the assumption that the observed reduced shear is approximately equal to the true shear , which for the A901/2 supercluster would introduce errors at the 15% level. We smooth the resulting maps with a Gaussian of smoothing scale 0.75 arcmin, which is equal to kpc at the supercluster redshift . This smoothing scale provides the best trade-off between high resolution and high signal-to-noise.
We determine the location of peaks from the local maxima and minima in the signal-to-noise weak lensing map. Occasionally we find two peaks that are separated by less than half the smoothing radius. These arise from small noise fluctuations on top of a larger fluctuations and in these cases we only count a single peak with significance given by the maximal peak within the smoothing radius. Once peaks are detected in a weak lensing mass map their significance has to be compared to what is expected from a smoothed random noise map, where a noise peak, for example, is much more common than would naively be expected. As shown by Van Waerbeke (2000), the statistics of peaks in a smoothed pure noise map follow the peak statistics of a two-dimensional Gaussian random field (Bond & Efstathiou, 1987). We use both the peak signal-to-noise and the radial peak profile to calculate the global probability of a detected dark matter peak arising from noise using Equation (45) of Van Waerbeke (2000).
2.2 Model-free Mass measurement
As our dark matter reconstruction reveals structures that are far from the spherically symmetric simple isothermal sphere and NFW models (Navarro et al., 1997) that are often fit to estimate masses from weak lensing measurements (Hoekstra, 2007, see for example), our preferred method to measure mass uses a model-free mass estimate. Following the idea of the statistic (Equation 3), we measure the mass of structures within an aperture. For the main structures in the supercluster we define apertures by the and enclosed regions in the dark matter signal-to-noise maps. In the cases of smaller cluster substructure, where the smoothed structures appear to be more spherical, we use circular apertures of radius 0.75 arcmin to match the smoothing scale used in the dark matter reconstruction. The ‘aperture’ mass is given by
| (4) |
where is the projected pixel area at the cluster redshift in , are pixels enclosed by the chosen aperture and is the critical surface mass density, given in Equation 1.
2.3 NFW profile model
The main drawback of using the model-free mass estimate in Equation 4 is the inability to separate mass at different redshifts. This is because the dark matter reconstruction measures the projected surface mass density along the line of sight. In the case of the A901/2 supercluster there is a higher redshift cluster, CB1, that lies behind A902 (Taylor et al., 2004) such that the model free mass estimate for the A902 region gives the combined mass of A902 and CB1. To obtain separate mass estimates for the A902 and CB1 cluster and to enable a comparison to future analyses of numerical simulations, we therefore also present mass estimates for the dark matter structures in A901/2 using an NFW halo model.
The NFW halo model has been shown in numerical simulations to provide a good fit to the spherically averaged profile of all dark matter halos irrespective of their mass (Navarro et al., 1997). The NFW model for the density profile of a halo at redshift is given by
| (5) |
where is the characteristic density, is the scale radius and is the critical density given by . We follow Dolag et al. (2004) defining the virial radius as the radius where the mass density of the halo is equal to , such that the corresponding virial mass is given by
| (6) |
As the mass enclosed within a radius is given by
| (7) |
defining the concentration parameter as , the characteristic halo density is given by
| (8) |
For a given CDM cosmology, the halo mass and concentration are related (Navarro et al., 1997; Bullock et al., 2001; Eke et al., 2001; Dolag et al., 2004), where the dependence is calculated through fits to numerical simulations. In this paper we use the relationship between halo mass and concentration derived by Dolag et al. (2004).
The expression for the weak lensing shear and convergence induced by an NFW dark matter halo, given in Bartelmann (1996) and Wright & Brainerd (2000), depends on the redshift of both the lens and source galaxies. In this analysis we have accurate redshifts for the majority of the A901/902 cluster galaxies but no redshift information for of our source galaxies as they are too faint to calculate a COMBO-17 photometric redshift. The maximum-likelihood method of Schneider & Rix (1997) was designed to take advantage of such a data set for analysing the galaxy-galaxy lensing statistically (Kleinheinrich et al., 2006; Heymans et al., 2006), and it is this method that we have adapted for cluster lensing and describe below.
For a model cluster density profile, in the case where all galaxy redshifts are known, the weak shear and convergence experienced by each source galaxy can be predicted by summing up the shear and convergence contributions from all the foreground clusters. In this analysis the redshifts of the source galaxies are unknown, and we therefore assign those galaxies a magnitude-dependent redshift probability distribution given by Equation 15 of Heymans et al. (2005) updated with the magnitude-redshift relation of Schrabback et al. (2007), where the average median redshift is given by
| (9) |
We are then able to calculate the expectation value of the observed reduced shear through Monte Carlo integration by drawing a source galaxy redshift estimate from the distribution , times, where in this analysis. Testing larger values for did not change the result. For each estimate the induced cluster lensing shear is calculated with the resulting mean reduced shear given by
| (10) |
The intrinsic source galaxy ellipticity is then calculated, . The distribution of each component of the observed galaxy ellipticity is well described, for the STAGES survey, by a Gaussian of width . As the induced reduced shear is relatively weak, the probability for observing an intrinsic ellipticity of is then given by
| (11) |
The best-fit dark matter halo parameters are determined by maximising the likelihood where the product extends over all source galaxies .
3 The STAGES Data
The STAGES survey (Gray et al., 2008) spans a quarter square degree centered on the A901/2 supercluster. Imaged in F606W, using the HST Advanced Camera for Surveys (ACS), the 80 orbit mosaic of 80 ACS tiles forms the second largest deep image taken by HST. A detailed account of the STAGES reduction method will be presented in Gray et al. (2008). It is very similar to the reduction used for the GEMS survey discussed in Heymans et al. (2005) and Caldwell et al. (2008), differing only in the dither and drizzle strategy. For STAGES, each image consists of four co-added dithered images combined with a Gaussian drizzling kernel with a resulting 0.03 arcsecond pixel scale, as suggested by Rhodes et al. (2007). STAGES is complemented by 17-band optical imaging from the COMBO-17 survey which provides, for galaxies brighter than , accurate photometric redshifts with errors , spectral energy distribution galaxy classification, and stellar mass estimates from low resolution 17-band spectra fits to parameterised star formation history models (Borch et al., 2006; Wolf et al., 2004).
3.1 Weak lensing shear measurement
To measure the reduced weak lensing shear , we use the data reduction steps and method described in Rix et al. (2004) and Heymans et al. (2005). The shear measurement aspect is based on the Kaiser et al. (1995) method. As we are primarily interested in the variation in the dark matter map we have updated our shear measurement pipeline to maximise the signal-to-noise by including a polynomial fit to the shear seeing correction (Luppino & Kaiser, 1997) as a function of galaxy size. We also include the Hoekstra correction to the shear polarisability tensor detailed in Heymans et al. (2006). The accuracy of these updates has been verified using the publicly available suite of simulations from the Shear TEsting Programme22 2 www.physics.ubc.ca/heymans/step.html (Heymans et al., 2006; Massey et al., 2007). The modifications successfully reduced the noise on the shear measurement, quantified through the root-mean-square variation of the measured ellipticity , from to .
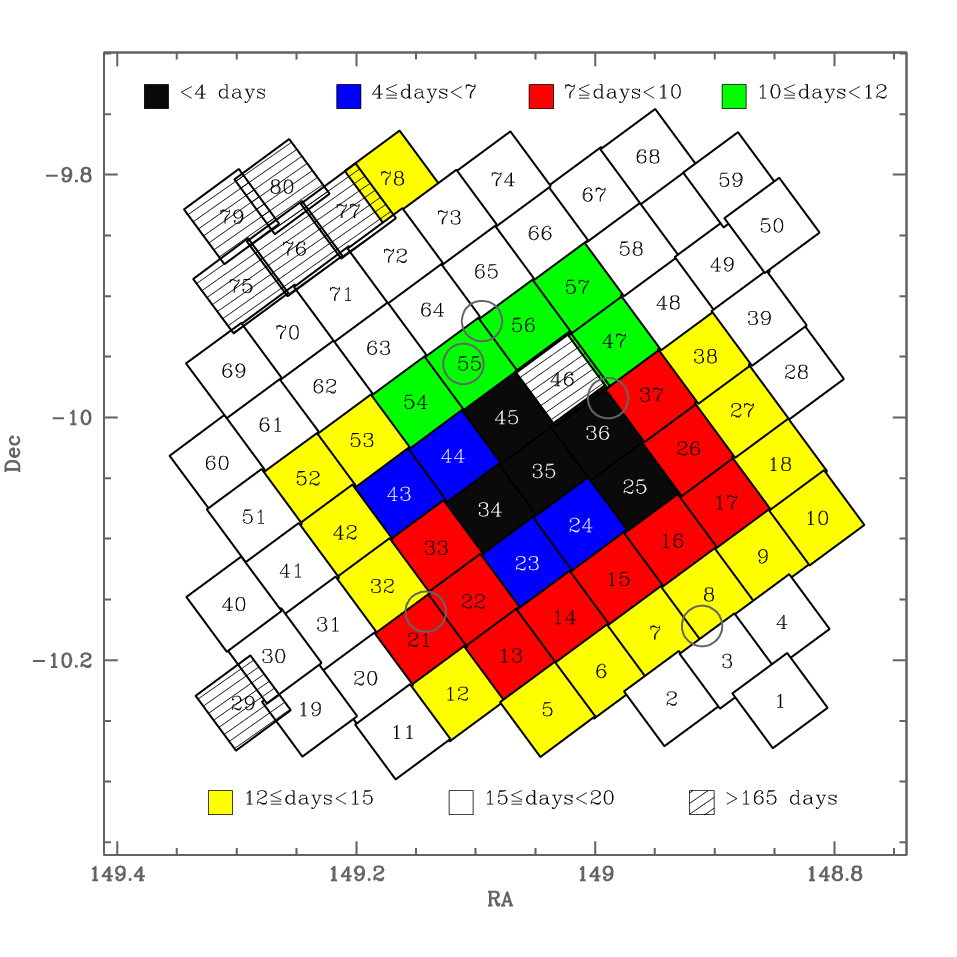
We use the same method as Heymans et al. (2005) to account for the time variation of the ACS PSF, namely to divide the data into sets imaged in a short period of time and assume that the temporal variation during that time is minimal. The majority of the A901/2 field was observed in the space of 20 days, with the remaining 10% imaged at a later date over the space of 4 days. Owing to the relatively low galactic latitude of the A901/2 field and the resulting high stellar density of useful stellar images per ACS image, we are able to split the data into seven groups to achieve good temporal sampling of the PSF distortion. This number was chosen to balance between the need to use as many ACS images as possible to maximise the signal-to-noise on the average measured stellar ellipticity as a function of CCD position, whilst requiring as many time bins as possible to minimise the temporal variation of the PSF pattern. Figure 1 shows the tiling pattern of the STAGES ACS observations denoting each group of data that was used to make the seven different PSF models. With this semi-time dependent model we find and remove temporal variation during the A901/2 observations. Averaged across the ACS field-of-view, this temporal variation is at the 1% level on the measured stellar ellipticity. As this variation is more than an order of magnitude lower than the weak lensing signal from the A901/2 supercluster our semi-time dependent PSF model is more than sufficient for this analysis. We might expect to see low-level systematics for the ACS images whose observation date is isolated at the start or end of a data group, affecting tiles 21, 33, 36, 43, 44, 46, 47, 57, 69 and 72. Indeed in the analysis that follows we find B-modes, an indication of systematics (Crittenden et al., 2002), in tiles 21, 33, 35, 36 and 57. These residual systematics will be taken into account by including a conservative systematic error term, based on the B-mode amplitude, in the analysis that follows. Note that Schrabback et al. (2007) and Rhodes et al. (2007) present significantly more advanced methods to model the temporal variation of the ACS PSF designed for the detection of the weaker lensing signal from large-scale structure which will be investigated further in a future analysis.
In the time since the ACS observations of the GEMS survey used by Heymans et al. (2005), the charge transfer efficiency (CTE) of the ACS has degraded significantly. During the CCD readout, as the CTE degrades over time, the amount of charge left behind increases. This results in image ‘tails’ developing along the readout direction, with the most severe effects seen in the furthest objects from the readout amplifiers. As the amount of charge left behind in each charge transfer is independent of the pixel count, CTE impacts on the shapes of fainter objects more significantly than brighter objects, and hence this distortion is not taken into account by the PSF correction. We follow Rhodes et al. (2007) by using an empirical CTE correction for the shear component, along the readout direction, where . is the distance from the readout amplifier and SN is a signal-to-noise estimate that we define as the ratio of the flux and flux error measurements from SExtractor (Bertin & Arnouts, 1996). A is a normalisation constant derived to minimise the average measured shear , where , is the PSF corrected galaxy ellipticity and is the shear polarisabilty tensor from Luppino & Kaiser (1997). For the faintest galaxies that are furthest from the readout amplifier, and hence the most strongly affected, , but on average which is more than an order of magnitude lower than the weak lensing signal from the A901/2 supercluster. We measure the average before applying the CTE correction to be and after correction . Any residual CTE distortions that remain after the correction are therefore very weak in comparison to the supercluster lensing signal. As the original CTE distortion varies across the ACS field of view and hence across the STAGES mosaic, any residual CTE distortions would however be included in our B-mode analysis and hence the errors in the results that follow.
3.2 Galaxy selection and redshift estimation
As we are interested in the dark matter in A901/2 at a redshift of , we select galaxies that are likely to be at higher redshifts and thus lensed by the supercluster. As the majority of our galaxies are too faint to calculate a COMBO-17 photometric redshift, the best option is to use a magnitude selection based on the relationship between median redshift and F606W magnitude derived in Schrabback et al. (2007) and given in Equation 9. To ensure that the majority of objects have , we select galaxies with , corresponding to a median redshift . We also include selection criteria chosen to optimise the accuracy and reliability of the weak lensing shear measurement, selecting galaxies with S/N , magnitude , and galaxy size pixels. Our resulting weak lensing catalogue includes over 60000 objects, or roughly 65 galaxies per square arcmin. The average galaxy magnitude of this sample is , implying a median redshift . Assuming a redshift distribution given by (Baugh & Efstathiou, 1993), we estimate a contamination of our source galaxy catalogue from objects that are foreground to the cluster. The dilution of the signal by foreground galaxies is therefore well within the statistical noise of our analysis.
To calculate the model-free mass estimate in Equation 4 we place the background source galaxy sample at one redshift taken to be the median redshift of the sources. We choose to use the median, as the high redshift tail of the redshift distribution of faint galaxies is poorly constrained observationally (Benjamin et al., 2007, see for example) leading to a potentially biased measure of the mean redshift. However note that this choice is fairly unimportant as for and , the redshift of A901/2, the important distance ratio in Equation 1 is fairly insensitive to the value of . For example, a large increase of from to increases by only . Hence for this deep analysis, where the majority of sources have redshifts , placing all lensed galaxies at one redshift is a good approximation.

| Structure | RA | Dec | |||||
| (deg) | (deg) | (arcmin) | |||||
| One Halo: | |||||||
| A901a | 149.1099 | -9.9561 | |||||
| A901b | 148.9889 | -9.9841 | |||||
| A902 | 149.1424 | -10.1666 | |||||
| SW group | 148.9101 | -10.1719 | |||||
| Two Halo: | |||||||
| A901a | 149.1099 | -9.9561 | |||||
| A901 | 149.0943 | -9.9208 | - | ||||
| A902 | 149.1424 | -10.1666 | |||||
| CBI | 149.1650 | -10.1728 | - | ||||
| SWa | 148.9240 | -10.1616 | |||||
| SWb | 148.9070 | -10.1637 | - |
4 Results
In this section we present the results of our weak lensing analysis of the A901/2 supercluster including cluster mass estimates, a comparison of three different weak lensing dark matter reconstructions and a comparison of the resulting dark matter distribution to the distribution of light in the supercluster.
4.1 Mass estimates for NFW profiles
We use spherical NFW haloes to model the weak lensing shear measured in the A901/2 field. We test two different models using the method described in section 2.3. The ‘one halo’ model centres a single NFW halo on the brightest cluster galaxy (BCG33 3 In this analysis we define a BCG to be the brightest cluster galaxy within an arcminute of the peak of the cluster’s galaxy distribution.) in each cluster at . The ‘two halo’ model places a halo at the A901a BCG and the location of the infalling X-ray group A901, a halo at the A902 BCG and at the background cluster CB1 BCG at , and two halos in the SW group, SWa and SWb. The positions of the two SW halos are motivated by the dark matter reconstruction presented in section 4.2. Table 1 lists the resulting constraints on the NFW ‘virial’ mass of each halo, the NFW ‘virial’ radius and the corresponding angular projection of this radius on the sky . We find results that are fully consistent with the single and multiple simple isothermal sphere halo analysis of Taylor et al. (2004). For comparison with the model-free mass estimates in section 4.2 we also calculate the NFW halo mass enclosed by an aperture of 1 arcmin using Equation 7.
Figure 2 compares the measured tangential reduced shear distortion around each cluster with the prediction from our ‘one halo’ (dashed) and ‘two halo’ (solid) model, assuming all lensed source galaxies are at a single redshift . The rotated shear is found to be consistent with zero on all scales as expected. Note that the model parameters are constrained using the method of Schneider & Rix (1997) as described in section 2.3, not as a fit to the azimuthally averaged shear presented in this Figure. We find that both models fit this data equally well but, in the cases of A901a and the SW group, NFW haloes are in general a poor fit to the data (the reduced of the fit is given in the final column of Table 1). From this we conclude that for these unvirialised systems, the spherical NFW model provides a poor fit. Note that using the Bullock et al. (2001) relationship between virial mass and concentration results in even poorer fits to the data. Figure 2 is also instructive to see the impact of the individual halos on each other. The effect of A901a on the profile of A901b (and vice versa) can be seen from the increasing signal on large scales in the upper panels of Figure 2. The decrease in signal on small scales in the SW group data favours the ‘two halo’ model over the ‘one halo’ model.
Comparing the A902 ‘one halo’ and ‘two halo’ models in the lower left panel of Figure 2 shows that the addition of the background cluster CB1 has only a weak effect on the profile of A902. We find that the virial mass of A902 decreases by 11% when the CB1 halo is included in the analysis (see Table 1). As CB1 and A902 are separated by 1.4 arcmin, the mass enclosed by a 1 arcmin aperture is even less effected and decreases by 6% when the CB1 halo is included in the analysis. We therefore conclude from this NFW analysis that in the model-free mass estimates that follow, the contribution from CB1 to the A902 mass cannot be more than a effect which is within our B-mode systmatic errors in the analysis that follows.
 |
 |
 |
 |
4.2 Dark Matter maps
Figure 3 shows the STAGES dark matter reconstruction of the A901/2 supercluster. The upper left panel shows the maximum likelihood reconstruction that clearly reveals the four main supercluster structures; A901a, A901b, A902, and the SW group. The contours on this signal-to-noise dark matter map correspond to -4,-2 (dashed), 2, 4, and 6 detection regions (solid). Assuming constant noise across the image, the scale bar shows the measured convergence . This is a very good assumption except for the edges of the map where the noise increases rapidly.
The dark matter map can be compared to the B-mode or ‘systematics map’ in the lower left panel of Figure 3. This is created by rotating the galaxies by (Crittenden et al., 2002) and reconstructing the map. As weak lensing produces curl-free or E-mode distortions, a significant detection of a curl or B-mode signal indicates that ellipticity correlations exist from residual systematics. Comparing the B-mode map with the contours from the dark matter map therefore allows one to assess the reliability of each detected structure. For the maps shown in Figure 3, a detection has , although the true significance of any peak in the distribution has to be determined by comparison to the statistics of a random Gaussian field (Van Waerbeke, 2000). For a field this size, with the same number of galaxies, ellipticity distribution and smoothing scale, smoothed Gaussian noise would produce random E and B-mode peaks, and random E and B-mode peaks, which we discuss further in section 4.4. All but one of the three most significant B-mode peaks can be linked to regions where the simple semi-time-dependent PSF modeling used in this analysis fails, as discussed in section 3.1.
For comparison with previous analyses, the upper right panel of Figure 3 shows a Kaiser & Squires (1993, KS93) reconstruction. The main difference seen between our preferred maximum likelihood reconstruction (upper left panel) and the KS93 reconstruction (upper right panel) is the strength and significance of the peaks. In the cluster cores, where , the reduced shear is more than 15% larger than the true shear . Hence the KS93 reconstruction where the reduced shear is assumed to be equal to the true shear , results in an overestimation of in these regions. When the maps are smoothed, these strong overestimated peaks are smeared out, and in the case of the neighbouring A901a and A901b and a large smoothing scale, this smearing could lead to false filamentary features that we start to see between A901a and A901b in the KS93 reconstruction. It is this effect, in addition to the possible presence of residual PSF systematics, that we conclude are responsible for the filamentary extension between A901a and A901b seen in the COMBO-17 dark matter reconstruction of Gray et al. (2002).
The lower right panel of Figure 3 compares our STAGES HST dark matter map (contours), with the COMBO-17 ESO 2.2m Wide-Field Imager dark matter map of Gray et al. (2002). This comparison shows excellent agreement in the locations of the dark matter peaks. The ground-based map is shown on the same scale as the other maps, but smoothed with a 1 arcmin Gaussian, compared to the 0.75 arcmin Gaussian used in the STAGES. Increasing the resolution of the ground-based map by narrowing the smoothing scale increases the noise in the map, thereby further lowering the significance of the detected peaks. In the ground-based analysis of Gray et al. (2002) 21 galaxies per square arcmin were used for the dark matter reconstruction with a root-mean-square variation of the measured ellipticity of . This can be compared to the 65 galaxies per square arcmin used in this analysis with . The increased number density of objects in this analysis results from the high HST image resolution. The reduction in results from both the higher average signal-to-noise imaging of the source galaxy sample and the higher average galaxy-to-PSF size ratio that can be achieved with space-based imaging. For a area of sky, the random intrinsic ellipticity noise on the measured shear is for the ground-based analysis and for this space-based analysis. As the weak lensing signal that is typically detected around clusters is and of the order of the ground-based noise, this comparison clearly demonstrates the need for space-based observations for better than arcminute resolution ‘imaging’ of the dark matter.
4.3 A comparison of mass and light
The distribution of dark matter in A901/2 is found to be very well traced by the distribution of galaxies associated with the supercluster, as shown by Figure 4. This Figure shows the total -band luminosity of cluster galaxies, smoothed on the same scale as the dark matter map (shown with contours). Cluster galaxies are identified from the ground-based multi-colour COMBO-17 data using the selection criteria from Wolf et al. (2005); their photometric redshift must lie in the range and their absolute -band magnitude , which corresponds to an apparent -band magnitude . These criteria were chosen to keep field contamination low and cluster completeness high, with a sample that is 68% complete at this luminosity limit. Wolf et al. (2005) estimate the level of field galaxy contamination to be 3% for the red-sequence galaxies, and 15% for the blue-cloud galaxies, (see Wolf et al., 2005, for more details).
Immediately in Figure 4 we can see that the most massive regions are also the most luminous. We also start to see cluster substructures repeated in both the dark matter and light maps. A comparison of mass and stellar mass in the cluster is nearly identical to Figure 4, implying that the stellar mass is also a good tracer of the underlying dark matter distribution. Figure 5 shows an arcmin close-up of the four main structures of the A901/2 supercluster. This Figure compares the distribution of dark matter (shown contoured) to the luminosity weighted distribution of old red sequence galaxies defined in Wolf et al. (2005). The locations of the BCGs are shown with filled diamonds. For A901a and A901b, the maximal peak in the dark matter distribution is practically co-incident with the location of the BCG, (within 0.25 arcmin). For A902 we find two peaks in the dark matter distribution matching the two BCGs. The dark matter peaks are slightly offset from the BCGs (0.5 and 1 arcmin) due to the presence of CB1, the background cluster at a redshift of whose BCG location is shown in the A902 lower left panel of Figure 5 with a star. The cluster CB1 fills arcmin aperture around the BCG. The NFW ‘two halo’ A902 and CB1 model detailed in section 4.1 predicts a shift in the observed A902 dark matter peak by arcmin which is consistent with what we find in the dark matter map.

 |
 |
 |
 |
For the SW group, there is again good agreement with the position of the peak in the mass distribution and the BCG, although for this group there are two local maxima in the dark matter distribution. Interestingly there are two distinct groups in the galaxy population of the SW group. There is an old red galaxy population that surrounds the BCG, as shown in the lower right panel of Figure 5. In addition there is a dusty red galaxy population (described by Wolf et al., 2005, but not shown in the Figure) that exists to the east of the BCG and co-incides with the most massive eastern dark matter peak (denoted SWb in Table 1). A more detailed analysis of the interesting relationship between the dark matter environment and the different galaxy populations will be presented in a future paper. The lower right panel of Figure 5 also shows one case of a significant density of old red galaxies without a peak in the dark matter distribution. Towards the edge of the STAGES imaging, the noise in our dark matter map grows rapidly, and at the location of this galaxy group the noise is twice the noise level at the SW group. As this group is likely to be less massive than the SW group, which is detected at , we are not surprised that this group is undetected in our dark matter map.
The A901a upper left panel of Figure 5 shows a significant extension of the dark matter distribution, in the direction of the in-falling X-ray group A901 found by Gray et al. (2008) (shown with a filled triangle). The peak along the extension, with (shown with a cross), is co-incident with the brightest galaxy in the the X-ray group.
Comparing the local maxima in the A901b and A902 distribution with the light maps we find that the substructure in the dark matter maps are often associated with substructures in the galaxy distribution. The only striking discrepancy is a luminous peak to the north west of A902, seen in Figure 4. This luminous peak results from a single, very luminous dusty red galaxy that is brighter than the BCG and is likely to be infalling on A902 (Wolf et al., 2005).
 |
 |
 |
 |
In Table 2 we list mass and mass-to-light ratios for the main structures shown in Figure 5. As discussed in section 4.1, these structures are far from the spherically symmetric NFW models that are often used to constrain models. We therefore use a model-free mass estimate given by Equation 4, defining the enclosed region using the and contours shown in Figure 5. For comparison with the ground-based analysis of Gray et al. (2002) and the NFW analysis of section 4.1 we also list the mass enclosed by a 1 arcmin circular aperture (denoted ‘ap’) centered on each clusters BCG. To estimate the contribution of systematic error to our mass estimate we follow the conservative prescription that is often used in the analysis of weak lensing by large-scale structure (Benjamin et al., 2007, see for example), calculating errors by adding the random error (listed as the first mass error in Table 2) in quadrature with the B-mode signal, shown in the lower left panel of Figure 3 and listed as the second mass error in Table 2. The systematic error dominates the random error in this analysis.
| Region | |||
|---|---|---|---|
| sig, area | |||
| A901a | |||
| , 16.6 | |||
| , 7.4 | |||
| ap, 3.1 | |||
| A901b | |||
| , 20.4 | |||
| , 6.2 | |||
| ap, 3.1 | |||
| A902 | |||
| , 12.0 | |||
| , 2.8 | |||
| ap, 3.1 | |||
| SWgroup | |||
| , 11.3 | |||
| , 4.8 | |||
| ap, 3.1 |
We find A901a and A901b to be the most massive systems in the supercluster with masses and mass-to-light ratios for the full extended region. A902 and the SW group have similar masses, roughly half the mass of the A901 pair at . We find A901b to be the most extended structure in the system, and the SW group is the most compact.
The mass-to-stellar mass ratios of each structure are given in the final column of Table 2. These mass ratios were calculated with a Hubble parameter , assuming a Kroupa et al. (1993) initial mass function (Borch et al., 2006). The results are equivalent to within 10% of the same result derived using a Chabrier (2003) or a Kroupa (2001) initial mass function. We find mass-to-stellar mass ratios that are similar to the ratios found for massive elliptical galaxies at this redshift (Hoekstra et al., 2005; Mandelbaum et al., 2006; Heymans et al., 2006), although a direct comparison is hard to draw as the results from the massive elliptical galaxies measure NFW virial mass to stellar mass ratios instead of the model free mass ratio estimates that we present here.
Figure 6 shows the variation of the mass-to-stellar mass ratio across each of the main structures in A901/2 on a log scale, compared to the mass distribution (shown contoured). Note that negative regions in the mass reconstruction have been set to zero in this Figure. Moving out from the central BCG (shown with diamonds), we find that the mass-to-stellar mass ratio initially increases, as the stellar mass decreases more rapidly than the halo mass. Continuing out further, the mass-to-stellar mass ratio then rapidly decreases as the dark matter mass tends to zero. This Figure shows some regions of very high mass-to-stellar mass ratio regions (), but the reader should note the significance of the mass detected in these regions (shown contoured) which is less than in all cases.
Comparing our convergence mass reconstruction results to our NFW shear analysis, we find very good agreement between the mass measured within 1 arcmin of each clusters BCG which provides an important verification of our dark matter reconstruction method. Indeed we find this good agreement between the two methods continues out to a radius of 4 arcmin, after which contribution from to the map from neighbouring clusters complicates the comparison. The difference that is seen between the NFW virial masses quoted in Table 1 and the masses quoted in Table 2 is only a result of the different physical scales probed in both Tables, which can be seen by comparing the observed NFW virial scale with the region area quoted in the first column of Table 2.
In comparing our results to the previous ground-based lensing analysis of the A901/2 supercluster we must first consider the assumption made by Gray et al. (2002) that and hence , where is the measured reduced shear given above Equation 2. For the main structures in A901/2 this would result in an overestimate of cluster mass by . Taking this overestimate into account, our mass estimates are consistent with Gray et al. (2002) as can be seen from the space/ground mass map comparison in the lower right panel of Figure 3. The mass-to-light ratio measurements for A901b and A902 disagree however at the level. The difference arises from improvements in the selection of the cluster galaxies from the COMBO-17 data, in comparison to the previous two-band optical cluster selection of Gray et al. (2002). This improvement removes the striking difference between the cluster mass-to-light ratio measurements found by Gray et al. (2002). Our results show a mass-to-light ratio within an aperture of 1 arcmin of to be a good description for all the main structures in the supercluster. We find a similar result for the mass-to-stellar mass ratio where for all the main structures in the supercluster.
4.4 Supercluster substructure
In this section we investigate the lower significance peaks in the dark matter distribution that are not associated with the cores of the supercluster structures discussed above. Table 3 lists the number of local maxima and minima in the dark matter reconstruction for different significance levels and compares them to what we find in our B-mode reconstruction and what we would expect from a smoothed random Gaussian field using Equation (41) from Van Waerbeke (2000). The high significance peaks are all associated with the cores of the four main supercluster structures. However we can see that we have a significant number of peaks that cannot be explained by random noise alone. There are a comparable number of peaks in the B-mode map, but comparing the location of E and B-mode peaks allows one to assess the reliability of the lower significance E-mode detections.
In order to distinguish between noise peaks and true peaks in the mass distribution, it is useful to add morphological information about the profile of the peaks. The mean profile and dispersion of a noise peak is given by Equation (47) of Van Waerbeke (2000). Comparing the measured profile around each detected peak with the mean noise profile allows for the calculation of the probability that a peak with a given significance and shape is a noise fluctuation, (using Equation (45) of Van Waerbeke (2000)). In Table 3 we list the number of peaks that have a less than 33% probability of being a random noise fluctuation. The result is consistent with the difference between the total number of detected peaks and the expected number of random noise peaks.
| -5 | -4 | -2 | 2 | 4 | 5 | 7 | |
| Noise | |||||||
| Signal | 0 | 1 | 36 | 29 | 7 | 3 | 1 |
| Bmode | 0 | 0 | 16 | 21 | 0 | 0 | 0 |
| Signal (p) | 0 | 1 | 19 | 25 | 7 | 3 | 1 |
| Bmode (p) | 0 | 0 | 10 | 14 | 0 | 0 | 0 |
| Signal (b) | 0 | 1 | 19 | 23 | 7 | 3 | 1 |
To define a low-significance substructure sample we use high confidence selection criteria where the peak must have less than 33% probability of being a random noise fluctuation, and the B-mode at the location of the peak must be less than half the amplitude of the E-mode. The last row of Table 3 lists the number of peaks that meet these criteria for different significance levels, leaving 16 ‘substructure’ peaks with . Note that the 7 peaks with are all associated with the central regions of the four main structures in the supercluster, discussed in section 4, as shown by the marked crosses in Figure 5 that are enclosed by the contour.
Assuming all 16 substructure peaks in the dark matter map are associated with the supercluster, we can calculate a mass for these halos using Equation 4. We find an average mass of for the group, and for the group. Table 4 lists the number of peaks that are associated with cluster galaxies where . We find that over half of the peaks are associated with galaxies in the cluster, and provide average mass-to-light ratios for these peaks in Table 4. The mass-to-light ratio of our ‘luminous’ substructures are of the same order of magnitude as the mass-to-light ratios of the main supercluster structures listed in Table 2.
It is likely that many of the peaks that are not associated with cluster light are actually at a different redshift, as the dark matter map shows the projected surface mass density along the line of sight. We have found one particularly interesting peak in the dark matter distribution to the south west of A901a, that is not co-incident with any cluster light. This peak has a 0.1% chance of being a noise fluctuation and is not co-incident with any significant B-modes. Our hypothesis is that this peak is due to a mass concentration at a higher redshift than the cluster, supported by the presence of a small group of 5 galaxies found within a 0.8 arcmin aperture, centred on the dark matter peak, which have photometric redshifts . Intriguingly, out of the four less significant dark matter peaks that are not associated with cluster light and are unlikely to be caused by noise or systematics, we find two peaks that are also co-incident with small galaxy groups of 3-4 galaxies at the same redshift . As this is same redshift of the CB1 cluster found in Taylor et al. (2004), we are potentially seeing extended large-scale structure at higher redshift which is supported by the findings of an optical cluster search of COMBO-17 data in this field (Falter et al., 2008). This will be investigated further in a forthcoming three-dimensional analysis.
| () | () | |||
|---|---|---|---|---|
| 14 | 10 | |||
| 2 | 1 |
5 Discussion and Conclusion
From a weak lensing analysis of deep Hubble Space Telescope data, we have reconstructed a high-resolution map of the dark matter distribution in the Abell 901/902 supercluster. We find that the maximal peaks in the dark matter distribution are very well matched to the locations of the brightest cluster galaxies in the most massive structures in the supercluster. These structures are A901a, A901b, A902 and the South West group, all of which are detected in our dark matter map at high significance.
Owing to the high number density of resolved objects in the HST data, we have been able to produce a map with sub-arcminute resolution. This has allowed us to resolve the morphology of the dark matter structures, finding profiles that are far from the spherically symmetric NFW models that are typically used to model such systems. We find local maxima in the dark matter distribution around the main structures, that are also seen in the distribution of galaxies. Furthermore we see a significant extension in the dark matter distribution around A901a, in the direction of an in-falling X-ray group called A901 (Gray et al., 2008).
We have presented mass, mass-to-light and mass-to-stellar mass ratio estimates for each of the main structures, finding A901a and A901b to be the most massive clusters in the system with . Contrary to the analysis of Gray et al. (2002) we find no evidence for the variation of the mass-to-light ratio or the mass-to-stellar mass ratio between the different clusters measured in a 1 arcmin aperture ( kpc) centred on each cluster. We have shown the variation of the mass-to-stellar mass ratio across the clusters, finding an initial rise in as a function of distance from the clusters central BCG, followed by a steep decrease.
We have investigated the less significant substructures in the dark matter map that are detected at . Comparing the profile of these peaks with what is expected from a random noise peak we have selected a sample of substructures where the likelihood of those peaks being noise or a result of an imperfect PSF correction is low. We find that over half of these peaks are associated with galaxies in the cluster, yielding mass-to-light ratios that are comparable to the mass-to-light ratios found in the main structures in the supercluster. The remaining peaks in the distribution are likely to be associated with galaxy groups at higher redshift (Falter et al., 2008), supported by the discovery of several co-incident groups of galaxies at .
One interesting result of Gray et al. (2002) was a tentative detection of a filamentary extension between A901a and A901b. We do not recover this signal in this analysis however and conclude that this feature was a result of residual PSF systematics and the KS93 mass reconstruction method used in the Gray et al. (2002) ground-based analysis. A similar non-detection and conclusion was drawn by Gavazzi et al. (2004) on a re-analysis of the tentative lensing detection of filamentary structure in the MS0302+17 supercluster by Kaiser et al. (1998). These two null results do not mean, however, that filamentary extensions of dark matter do not exist between clusters. Instead, as shown by Dolag et al. (2006), we are finding that intra-cluster filaments are very difficult to detect through weak lensing. From numerical simulations, Dolag et al. (2006) determine an expected filamentary shear signal from a supercluster filament of , which is a factor of three smaller than the noise on 1 arcmin scales in this HST analysis. To detect a signal of this magnitude would require significantly deeper space-based observations. An alternative, that we are currently investigating, is the detection of weak gravitational flexion, a third order weak lensing effect that will be very effective at probing the sub-structures that were resolved in this weak shear analysis (Bacon et al., 2006, see for example), and is also a potential way to recover more information about intra-cluster filaments.
The dark matter map presented in this paper will form the basis of future studies of galaxy morphology and galaxy type in an over-dense dark matter environment. Comparing the results of this analysis with the previous ground-based analysis clearly demonstrates the importance of space-based observations for future high resolution weak lensing dark matter ’observations’ of dense environments.
6 Acknowledgments
We thank the referee for their useful and detailed comments. CH thanks Jasper Wall, Tom Kitching, Tim Schrabback and Martina Kleinheinrich for useful discussions. CH acknowledges the support of a European Commission Programme framework Marie Cure Outgoing International Fellowship under contract MOIF-CT-2006-21891, and a CITA National fellowship. CYP is grateful for support provided through STScI and NRC-HIA Fellowship programs. MEG was supported by an Anne McLaren Research Fellowship, LVW by NSERC, CIfAR and CFI, EFB and KJ by the DFG’s Emmy Noether Programme, AB by the DLR (50 OR 0404), MB and EvK by the Austrian Science Foundation FWF under grant P18416, SFS by the Spanish MEC grants AYA2005-09413-C02-02 and the PAI of the Junta de Andalucía as research group FQM322, CW by a PPARC Advanced Fellowship, SJ by NASA under LTSA Grant NAG5-13063 and NSF under AST-0607748 and DHM by NASA under LTSA Grant NAG5-13102. Support for STAGES was provided by NASA through GO-10395 from STScI operated by AURA under NAS5-26555.
References
- Aragón-Salamanca et al. (2008) Aragón-Salamanca et al., 2008, In preperation
- Bacon et al. (2006) Bacon D., Goldberg D., Rowe B., Taylor A., 2006, MNRAS, 365, 414
- Balogh et al. (2000) Balogh M. L., Navarro J. F., Morris S. L., 2000, ApJ, 540, 113
- Balogh et al. (2004) Balogh et al. M., 2004, MNRAS, 348, 1355
- Bartelmann (1996) Bartelmann M., 1996, A&A, 313, 697
- Bartelmann & Schneider (2001) Bartelmann M., Schneider P., 2001, Physics Reports, 340, 291
- Baugh & Efstathiou (1993) Baugh C. M., Efstathiou G., 1993, MNRAS, 265, 145
- Bekki (1999) Bekki K., 1999, ApJL, 510, L15
- Bell et al. (2007) Bell E. F., Zheng X. Z., Papovich C., Borch A., Wolf C., Meisenheimer K., 2007, ApJ, 663, 834
- Benjamin et al. (2007) Benjamin J., Heymans C., Semboloni E., van Waerbeke L., Hoekstra H., Erben T., Gladders M. D., Hetterscheidt M., Mellier Y., Yee H. K. C., 2007, MNRAS, 381, 702
- Bertin & Arnouts (1996) Bertin E., Arnouts S., 1996, A&AS, 117, 393
- Blanton et al. (2006) Blanton M. R., Eisenstein D., Hogg D., Zehavi I., 2006, ApJ, 645, 977
- Blanton et al. (2005) Blanton M. R., Eisenstein D., Hogg D. W. andSchlegel D. J., Brinkmann J., 2005, ApJ, 629, 143
- Bond & Efstathiou (1987) Bond J. R., Efstathiou G., 1987, MNRAS, 226, 655
- Borch et al. (2006) Borch A., Meisenheimer K., Bell E., Rix H. W., Wolf C., Dye S., Kleinheinrich M., Kovacs Z., Wisotzki L., 2006, A&A, 453, 869
- Bullock et al. (2001) Bullock J. S., Kolatt T. S., Sigad Y., Somerville R. S., Kravtsov A. V., Klypin A. A., Primack J. R., Dekel A., 2001, MNRAS, 321, 559
- Caldwell et al. (2008) Caldwell J. A. R., McIntosh D. H., Rix H.-W., Barden M., Beckwith S. V. W., Bell E. F., Borch A., Heymans C., Häußler B., Jahnke K., Jogee S., Meisenheimer K., Peng C. Y., Sanchez S. F., Somerville R. S., Wisotzki L., Wolf C., 2008, ApJS, 174, 136
- Chabrier (2003) Chabrier G., 2003, Publ. Astron. Soc. Pacific, 115, 763
- Clowe et al. (2006) Clowe D., Bradač M., Gonzalez A. H., Markevitch M., Randall S. W., Jones C., Zaritsky D., 2006, ApJL, 648, L109
- Clowe et al. (1998) Clowe D., Luppino G. A., Kaiser N., Henry J. P., Gioia I. M., 1998, ApJL, 497, L61+
- Crittenden et al. (2002) Crittenden R., Natarajan R., Pen U., Theuns T., 2002, ApJ, 568, 20
- Dietrich et al. (2005) Dietrich J. P., Schneider P., Clowe D., Romano-Díaz E., Kerp J., 2005, A&A, 440, 453
- Dolag et al. (2004) Dolag K., Bartelmann M., Perrotta F., Baccigalupi C., Moscardini L., Meneghetti M., Tormen G., 2004, A&A, 416, 853
- Dolag et al. (2006) Dolag K., Meneghetti M., Moscardini L., Rasia E., Bonaldi A., 2006, MNRAS, 370, 656
- Dressler (1980) Dressler A., 1980, ApJ, 236, 351
- Eke et al. (2001) Eke V. R., Navarro J. F., Steinmetz M., 2001, ApJ, 554, 114
- Falter et al. (2008) Falter S., Roeser H., Wolf C., Hippelein H., 2008, In preperation
- Gavazzi et al. (2004) Gavazzi R., Mellier Y., Fort B., Cuillandre J.-C., Dantel-Fort M., 2004, A&A, 422, 407
- Gilmour et al. (2007) Gilmour R., Gray M. E., Almaini O., Best P., Wolf C., Meisenheimer K., Papovich C., Bell E., 2007, MNRAS, 380, 1467
- Gorenstein et al. (1988) Gorenstein M. V., Shapiro I. I., Falco E. E., 1988, ApJ, 327, 693
- Gray et al. (2008) Gray M., Gilmour R., collaborators, 2008, In preperation
- Gray et al. (2002) Gray M., Taylor A., Meisenheimer K., Dye S., Wolf C., Thommes E., 2002, ApJ, 568, 141
- Gray et al. (2004) Gray M. E., Wolf C., Meisenheimer K., Taylor A., Dye S., Borch A., Kleinheinrich M., 2004, MNRAS, 347, L73
- Gray et al. (2008) Gray et al. M., 2008, In preperation
- Gunn & Gott (1972) Gunn J. E., Gott J. R. I., 1972, ApJ, 176, 1
- Heymans et al. (2006) Heymans C., Bell E. F., Rix H.-W., Barden M., Borch A., Caldwell J. A. R., McIntosh D. H., Meisenheimer K., Peng C. Y., Wolf C., Beckwith S. V. W., , Häußler B., Jahnke K., Jogee S., , Sanchez S. F., Somerville R. S., Wisotzki L., 2006, MNRAS, 371L, 60
- Heymans et al. (2005) Heymans C., Brown M. L., Barden M., Caldwell J. A. R., Jahnke K., Rix H.-W., Taylor A. N., Beckwith S. V. W., Bell E. F., Borch A., Häußler B., Jogee S., McIntosh D. H., Meisenheimer K., Peng C. Y., Sanchez S. F., Somerville R. S., Wisotzki L., Wolf C., 2005, MNRAS, 160
- Heymans et al. (2006) Heymans C., Van Waerbeke L., Bacon D., Berge J., Bernstein G., Bertin E., Bridle S., Brown M. L., Clowe D., Dahle H., Erben T., Gray M., Hetterscheidt M., Hoekstra H., Hudelot P., Jarvis M., Kuijken K., Margoniner V., Massey R., Mellier Y., Nakajima R., Refregier A., Rhodes J., Schrabback T., Wittman D., 2006, MNRAS, 368, 1323
- Hoekstra (2007) Hoekstra H., 2007, MNRAS, 379, 317
- Hoekstra et al. (2005) Hoekstra H., Hsieh B. C., Yee H. K. C., Lin H., Gladders M. D., 2005, ApJ, 635, 73
- Kaiser & Squires (1993) Kaiser N., Squires G., 1993, ApJ, 404, 441
- Kaiser et al. (1995) Kaiser N., Squires G., Broadhurst T., 1995, ApJ, 449, 460
- Kaiser et al. (1998) Kaiser N., Wilson G., Luppino G., Kofman L., Gioia I., Metzger M., Dahle H., 1998, ArXiv Astrophysics e-prints astro-ph 9809268
- Kleinheinrich et al. (2006) Kleinheinrich M., Schneider P., Rix H. W., Erben T., Wolf C., Schirmer M., Meisenheimer K., Borch A., Dye S., Kovacs Z., Wisotzki L., 2006, A&A, 445, 441
- Kroupa (2001) Kroupa P., 2001, MNRAS, 322, 231
- Kroupa et al. (1993) Kroupa P., Tout C. A., Gilmore G., 1993, MNRAS, 262, 545
- Lane et al. (2007) Lane K. P., Gray M. E., Aragón-Salamanca A., Wolf C., Meisenheimer K., 2007, MNRAS, 378, 716
- Larson et al. (1980) Larson R. B., Tinsley B. M., Caldwell C. N., 1980, ApJ, 237, 692
- Luppino & Kaiser (1997) Luppino G. A., Kaiser N., 1997, ApJ, 475, 20
- Mahdavi et al. (2007) Mahdavi A., Hoekstra H., Babul A., Balam D. D., Capak P. L., 2007, ApJ, 668, 806
- Mandelbaum et al. (2006) Mandelbaum R., Seljak U., Kauffmann G., Hirata C. M., Brinkmann J., 2006, MNRAS, 368, 715
- Massey et al. (2007) Massey R., Heymans C., Bergé J., Bernstein G., Bridle S., Clowe D., Dahle H., Ellis R., Erben T., Hetterscheidt M., High F. W., Hirata C., Hoekstra H., Hudelot P., Jarvis M., Johnston D., Kuijken K., Margoniner V., Mandelbaum R., Mellier Y., Nakajima R., Paulin-Henriksson S., Peeples M., Roat C., Refregier A., Rhodes J., Schrabback T., Schirmer M., Seljak U., Semboloni E., Van Waerbeke L., 2007, MNRAS, 376, 13
- Moore et al. (1996) Moore B., Katz N., Lake G., Dressler A., Oemler A., 1996, Nature, 379, 613
- Moore et al. (1998) Moore B., Lake G., Katz N., 1998, ApJ, 495, 139
- Navarro et al. (1997) Navarro J. F., Frenk C. S., White S. D. M., 1997, ApJ, 490, 493
- Rhodes et al. (2007) Rhodes J. D., Massey R., Albert J., Collins N., Ellis R. S., Heymans C., Gardner J. P., Kneib J.-P., Koekemoer A., Leauthaud A., Mellier Y., Refregier A., Taylor J. E., Van Waerbeke L., 2007, ApJS, 172, 203
- Rix et al. (2004) Rix H.-W., Barden M., Beckwith S. V. W., Bell E. F., Borch A., Caldwell J. A. R., Häußler B., Jahnke K., Jogee S., McIntosh D. H., Meisenheimer K., Peng C. Y., Sanchez S. F., Somerville R. S., Wisotzki L., Wolf C., 2004, ApJS, 152, 163
- Schneider & Rix (1997) Schneider P., Rix H., 1997, ApJ, 474, 25
- Schrabback et al. (2007) Schrabback T., Erben T., Simon P., Miralles J.-M., Schneider P., Heymans C., Eifler T., Fosbury R. A. E., Freudling W., Hetterscheidt M., Hildebrandt H., Pirzkal N., 2007, A&A, 468
- Taylor et al. (2004) Taylor A. N., Bacon D. J., Gray M. E., Wolf C., Meisenheimer K., Dye S., Borch A., Kleinheinrich M., Kovacs Z., Wisotzki L., 2004, MNRAS, 353, 1176
- Van Waerbeke (2000) Van Waerbeke L., 2000, MNRAS, 313, 524
- Wolf et al. (2005) Wolf C., Gray M. E., Meisenheimer K., 2005, A&A, 443, 435
- Wolf et al. (2004) Wolf C., Meisenheimer K., Kleinheinrich M., Borch A., Dye S., Gray M., Wisotzki L., Bell E., Rix H.-W., Hasinger A. C. G., Szokoly G., 2004, A&A, 421, 913
- Wolf et al. (2003) Wolf C., Meisenheimer K., Rix H.-W., Borch A., Dye S., Kleinheinrich M., 2003, A&A, 401, 73
- Wright & Brainerd (2000) Wright C. O., Brainerd T. G., 2000, ApJ, 534, 34