Deviations from the Flux-Recurrence Time Relationship in GS 1826–238:
Potential Transient Spectral Changes
Abstract
The low-mass X-ray binary GS 1826238 is presently unique for its consistently regular bursting behavior. In previous Rossi X-Ray Timing Explorer (RXTE) measurements between 1997 November and 2002 July, this source exhibited (nearly) limit-cycle bursts with recurrence times that decreased proportionately as the persistent flux increased. Here we report additional measurements of the burst recurrence time by RXTE, Chandra, and XMM-Newton, as well as observations of optical bursts. On a few occasions we measured burst recurrence times which deviated significantly from the earlier flux-recurrence time relationship, and most of these bursts occurred earlier than would be predicted based on the X-ray flux level. The epochs with early bursts were also accompanied by unusual broadband timing signatures, with the entire power spectrum shifting to higher frequencies. Concurrent XMM-Newton observations during one of these occasions, in 2003 April, indicate that an additional soft component may be present in the spectrum containing enough flux (30% of the total) to account for the burst recurrence time discrepancy. A self-consistent interpretation for the increase in soft flux and accompanying timing changes during 2003 April is that accretion disk extends down to smaller radial distances from the source than during the other observing epochs. The RXTE observations since 2003 April show that the spectral and timing properties have nearly returned to the previously established level.
Subject headings
X-rays: binaries—X-rays: bursts—X-rays: individual (Ginga 1826–238 (catalog ))I. Introduction
Type I X-ray bursts result from unstable thermonuclear ignition of accreted material on the surfaces of weakly magnetic ( G) neutron stars (for a recent review, see Strohmayer & Bildsten 2006). Freshly accreted hydrogen and helium on the neutron star surface is hydrostatically compressed by new material at a rate g cm-2 s-1. In systems exhibiting bursts, the temperature and pressure at the base of the accreted layer slowly increase until the nuclear energy generation rate of the -reaction becomes more sensitive to temperature perturbations than the radiative cooling. At this point the resulting thermonuclear instability leads to runaway burning of some or all of the matter that has been deposited since the previous burst. Typically, hours to days are required to accrete enough material to trigger the instability.
There are close to 100 type I bursters that are known in the Galaxy11 1 For an updated list of Galactic type I X-ray bursters, see http://www.sron.nl/jeanz/bursterlist.html., and the vast majority are “atoll” type low-mass X-ray binaries (LMXBs) with luminosities above about erg s-1 (Hasinger & van der Klis 1989). Although the basic physics of type I X-ray bursts is understood, detailed comparisons between observations and theoretical models have had mixed success (e.g., Woosley et al. 2004). The most successful comparison has been with the “clocked burster” GS 1826238 (also known as Ginga 1826–238), whose bursts are consistently quasi-periodic (Ubertini et al. 1999; Cocchi et al. 2001; Cornelisse et al. 2003). Studies of the bursts from GS 1826–238 began during the BeppoSAX mission, with the most detailed study of burst recurrence times and energetics coming from Galloway et al. 2004, who analyzed 24 bursts from the Rossi X-Ray Timing Explorer () detected between 1997 November and 2002 July. They found that the recurrence time decreased from hr to hr while the persistent (between burst) flux level increased by 66%, so that the recurrence time decreased almost precisely as . Assuming implies that the accumulated mass required for the instability to occur is approximately the same even as the accretion rate changes. The long burst durations (100 s) and the low value of (40) – the ratio of the integrated bolometric persistent flux between bursts to the total bolometric burst fluence – both suggest that hydrogen constitutes a large portion of the fuel for these bursts (Bildsten 2000). Further support for the H-rich fuel scenario comes from comparisons of the observed light curves with those predicted by time-dependent models, which also imply solar H and CNO composition in the material accreted by GS 1826238 (Heger et al. 2008).
Additional observations have been made as part of a monitoring campaign from 2003 through 2007. These data reveal that the previously monotonic relation between burst recurrence time and persistent X-ray flux no longer fully describes the source behavior. Here we present an analysis of the full data set with the objective of more fully characterizing the complex burst behavior. We have also analyzed observations from the Chandra X-ray Observatory in 2002 July, and XMM-Newton in 2003 April, both of which occurred simultaneously with , in order to also study the low-energy spectrum. In addition, we used optical observations made with the UCT-CCD fast photometer at the South African Astronomical Observatory (SAAO) in 1998 June to determine the bursting behavior during gaps in the observations. In § 2 we describe these observations and the details of our data analysis. We present our spectral and timing results in § 3. Finally, we discuss the implications of the results in § 4.
II. Observations and Analysis
II.1. RXTE
In this paper, we utilized all observations of GS 1826238, which has been observed at least once per year since 1997, except during 2001. Overall, there are more than 600 ks of good exposure time. We analyzed data from the Proportional Counter Array (PCA; Jahoda et al. 2006) and the High Energy X-Ray Timing Experiment (HEXTE; Rothschild et al. 1998) instruments. The PCA has five identical co-aligned Proportional Counter Units (PCUs) sensitive to 2–60 keV photons. The HEXTE comprises two clusters, each containing four scintillation detectors sensitive to 15–250 keV photons. Both instruments have large effective areas (6000 and 1400 cm2, respectively) and microsecond timing resolution.
II.1.1 Recurrence Time Measurements
Measurements of the burst recurrence times were made using PCA event mode data with 1 s bins, including all photon energies. The times of the bursts were defined to be when the flux exceeds 25% of the peak flux of each of the bursts. Sometimes bursts took place when the satellite was not taking any data (e.g., during passages through the South Atlantic Anomaly), and recurrence times were inferred if bursts occurred near enough together to unambiguously know the number of intervening bursts. This method is acceptable because bursts from GS 1826238 have never been observed to occur at irregular intervals. If the time between two observed bursts is , the recurrence time is estimated as , where bursts are inferred in data gaps. Following Galloway et al. (2004), we adopted a fractional error of 2% on the individual recurrence time measurements, and when bursts are inferred the error is scaled by because we assume burst intervals in total. Although RXTE observations took place during 1999 and 2005, the duration and spacing of these measurements did not allow for an unambiguous recurrence time measurement. Table 1 shows the observation dates containing recurrence time measurements, the number of bursts that were observed, and the average burst recurrence time during each epoch. The observations taking place simultaneously (or nearly so) with RXTE are discussed below.
| Date | Recurr. Time | ||
|---|---|---|---|
| (U.T.) | ObservatoryaaDuring three periods, simultaneous observations took place with RXTE. | BurstsbbAll bursts observed by RXTE were also observed with the other observatory. | (hr) |
| 1997 Nov 5–6 | RXTE | 2 | 5.88ccOnly one burst interval was measured during this epoch. |
| 1998 Jun 7–12 | RXTE | 3 | 5.67 0.04 |
| 1998 Jun 23–25 | SAAO/RXTE | 6/1 | 5.13 0.19 |
| 2000 Jun 30–03ddThis observation ended in July. | RXTE | 8 | 4.04 0.06 |
| 2000 Sep 24–27 | RXTE | 7 | 4.11 0.06 |
| 2002 Jul 29–30 | Chandra/RXTE | 6/4 | 3.54 0.03 |
| 2003 Apr 6–9 | XMM/RXTE | 16/7 | 3.18 0.14 |
| 2004 Jul 19–21 | RXTE | 7 | 3.47 0.02 |
| 2006 Aug 9–12 | RXTE | 11 | 3.36 0.07 |
| 2007 Mar 8–10 | RXTE | 9 | 3.53 0.02 |
Note. — Observations allowing unambiguous recurrence time measurements. Additional RXTE observations are utilized in our study of the power spectra (see § II.1.3).
II.1.2 Energy Spectra Analysis
The evolving spectrum during the bursts was modeled using an absorbed blackbody, subtracting the pre-burst persistent emission as background. This approach is relatively standard for X-ray burst analysis, and we refer the reader to Galloway et al. 2004 for further details. In addition to the burst spectra, we studied the persistent emission by extracting color-color diagrams and photon energy spectra. In each case we excluded data from 500 s before to 1500 s after a burst, the latter chosen to minimize the residual blackbody flux seen during the decays of the bursts (Thompson et al. 2005). Colors were created by extracting light curves for each PCA channel and observation, reading in the channel energy boundaries from the observation’s response matrix, and interpolating the counts spectrum to a standard grid. The soft and hard colors are defined as the counts ratio (3.5–6) keV/(2–3.5) keV and (9.7–16) keV/(6–9.7) keV, respectively, and were obtained by integrating over the interpolated grid. To correct for the long-term drift of the gain of each PCA channel, the colors were normalized to the colors of the Crab calculated with the closest observation available to each GS 1826238 observation.
We extracted energy spectra from the persistent emission between X-ray bursts using the standard software for data reduction (FTOOLS v.6.2). For the PCA, we used the “Standard 2” data, ignoring the first three channels and photon energies greater than 30 keV. HEXTE data below 25 keV were ignored, as were data above 100 keV due to poor statistics. The HEXTE channels were rebinned so that there were a minimum of 1000 counts per bin. To each observation (minus the times surrounding the bursts), we fit an absorbed double Comptonization model using XSPEC v.11.3. This model was found by Thompson et al. 2005 to fit the broadband spectra of GS 1826238 better than a single Comptonization model or empirical models like a cut-off power-law. For each measured burst recurrence time, the persistent flux was obtained from the best-fit model22 2 Some of the fluxes had to be corrected for a 0251 offset pointing in R.A., which decreased the efficiency of the PCA and HEXTE by a factor of 1.3. during the time since the previous burst. Although the spectral model only applies to photons from 3–100 keV, we extrapolated the model from 0.1–3 keV and 100–200 keV to estimate the bolometric flux.
II.1.3 Timing Analysis
To relate the burst behavior to the broadband (persistent) timing properties, we also analyzed the rapid variability in the X-ray emission by producing a series of power density spectra (PSDs). For each RXTE observation, including six observations that did not allow for a recurrence time measurement, we used 128 s segments of PCA event mode data with s bins (corresponding to a Nyquist frequency of 2048 Hz), and normalized after Leahy et al. 1983. As with the energy spectra and colors, we excluded data 500 s before to 1500 s after each burst. Separate groups of power spectra close in time were merged if no systematic differences in PSDs were observed. In this manner we obtained 18 power spectra. On average, each PSD contained 36 ks of accumulated data (with the smallest being 8 ks and the largest being 83 ks). The contribution due to Poissonian statistics was estimated from the 1500–2048 Hz frequency band and removed (this also implicitly accounts for any decrease in power due to the PCA deadtime), and the spectra were converted to fractional rms squared.
Qualitatively, each PSD can be characterized as having roughly equal power per decade in frequency, which extends between a low and high frequency break. To quantitatively describe each power spectrum, we fit a combination of 4–6 Lorentzians following, e.g., Belloni et al. 2002, which overcomes the limitation of treating different power spectral components with intrinsically different models. Two to three of the Lorentzians are zero-centered and fit the broadband noise, giving a broad peak in the power times frequency () representation between at low frequencies and and at high frequencies (Belloni et al. 2002). There is also an additional component peaked at to cover the “hump” typically seen near 2–3 Hz (but much higher during 2003 April, as shown below) in GS 1826238. Additional narrow Lorentzians that are interpreted as quasi-periodic oscillations (QPOs; where the coherence factor ) were added if necessary to achieve acceptable fits. Due to limited statistics at high frequencies, only the lower frequency Lorentzian components ( Hz) were useful for comparison. The frequencies are characterized using , the frequency at which the component contributes most of its variance per logarithmic frequency interval, which is equal to , where is the centroid frequency and is the half-width at half-maximum of the Lorentzian. Errors on the fit parameters were determined using corresponding to the 90% confidence interval.
II.2. Chandra
The RXTE observations on 2002 July 29–30 occurred simultaneously with Chandra (Thompson et al. 2005, also analyzed by), providing valuable low-energy coverage. A 68 ks observation was made with the Advanced CCD Imaging Spectrometer (ACIS; Garmire et al. 2003), which is sensitive to photons from 0.3–10 keV. High-resolution spectra were obtained by having the High Energy Transmission Grating (HETG; Canizares et al. 2005) placed in the optical path. The HETG spectrometer is composed of the Medium-Energy Grating (MEG) and the High-Energy Grating (HEG). First-order MEG/HEG spectra were extracted with the Chandra Interactive Analysis of Observations (CIAO) v.3.4 software. Responses matrices were generated using calibration v.3.4.0. Spectra were rebinned with at least 1000 counts per spectral channel, giving statistically significant data for photon energies greater than 1 keV.
II.3. XMM-Newton
The RXTE observations during 2003 April 6–9 occurred simultaneously with an XMM-Newton (Aschenbach 2002) observation (Kong et al. 2007, also analyzed by), lasting for 200 ks. Timing mode data was acquired from both the European Photon Imaging Camera (EPIC) and the Reflection Grating Spectrometer (RGS), although we only made use of data from the EPIC pn detector. The Optical Monitor was turned off for this observation. Data analysis was performed with the XMM-Newton Science Analysis System (SAS) v.7.1.0. Photon energy spectra were extracted for energies between 0.5 and 6 keV, and were rebinned with at least 1000 counts per spectral channel. Rather than using the “canned” response matrices, we generated one specific to our observation.
II.4. Optical
During 1998 June, a set of three 7 ks observations were made at 1 day intervals, resulting in the detection of just one burst. At the same time, however, observations of a small ( arcsec2) region surrounding the optical counterpart of GS 1826238 were made using the UCT-CCD fast photometer (O’Donoghue 1995), at the Cassegrain focus of the 1.9 m telescope at SAAO. On June 23 and 24, the observations lasted for 8 hours in an uninterrupted series of 5 s exposures; on June 25, the observation was 9 hours long using 2 s exposures. In each case, the coverage included (unambiguous) consecutive optical bursts from GS 1826238. We performed data reduction using the Image Reduction and Analysis Facility (IRAF), including photometry with the implementation of DAOPHOT II (Stetson 1987). Point spread function (PSF) fitting was employed in order to obtain the best possible photometry, since there was moderate crowding of the counterpart and variable seeing. The details of this procedure are given by Homer et al. 1998.
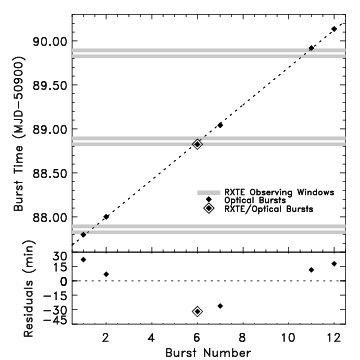
Figure 1 shows the arrival times of the bursts seen in the optical and by RXTE. The bursts detected in the optical, coincident with (and immediately following) the burst detected by RXTE allowed an unambiguous measurement of the persistent flux and recurrence time during these observations. In addition, for the subsequent analysis, we associate the other two recurrence time measurements made possible by the pairs of bursts observed in the optical both before and after the burst detected by RXTE, with the X-ray flux measured during that observation.
III. Results

Within any individual observation, GS 1826238 exhibited quasi-periodic bursting behavior, with the average persistent flux in between bursts varying by at most a few percent. Figure 2 shows the variation of the burst recurrence time, burst fluence, and as a function of the (absorbed) persistent X-ray flux using RXTE measurements. Except for the data from 2003 April, it is evident that the recurrence time of the bursts has a rough dependence (Galloway et al. 2004), as has been observed previously, implying that typically, a similar amount of accreted fuel is required to trigger each burst. The typical scatter on the recurrence times within each epoch is just 1%. However, the 2003 April measurements are significant outliers, with recurrence times that are shorter than expected based on the persistent flux. During this epoch, the recurrence time was about 3.2 hr even though the persistent flux was 10% lower than in 2000 June/September, when the recurrence time was about 4.1 hr. Other measurements also deviate from the trend, but to a lesser extent. For example, in 1998 June the recurrence time was typically near 5.65 hr, but about twelve days later optical burst intervals were 4.9 and 5.2 hr even though the persistent X-ray flux (from observations) had not substantially changed. Therefore, the occasional discrepancy between the burst recurrence time and the expected value (given the persistent flux level and their previously observed relationship) seems to be a general property of GS 1826238, and not something that (for example) only occurs near the highest persistent flux levels. More recent RXTE data from 2004, 2006, and 2007, have shown that the persistent flux versus recurrence time relationship has at other times obeyed the previously observed monotonic behavior.

Figure 3 shows the fractional difference between the estimated bolometric flux and the flux derived from the empirical relationship between flux and burst recurrence time (hereafter; referred to as the “recurrence time flux”), as a function of burst recurrence time. Note that this figure can be equivalently considered as the residuals of the -axis in Fig. 2, top panel. Assuming the empirical curve describes the actual flux-recurrence time relationship, Fig. 3 suggests that the 2003 April X-ray flux measured by RXTE is underestimated by 30–40%.
The discrepant measurements suggest either that the proportionality between the persistent 0.1–200 keV flux (derived from extrapolating the model fit in the 3–100 keV range) and accretion rate was different than during other observations, or that the heating of the accreted layer (or some other factor) changes to alter the ignition depth at the same accretion rate. In order to discriminate between these two possibilities, we made a more detailed study of the burst characteristics, and of the persistent spectral and timing behavior of the source.
III.1. The Energy Spectrum-Accretion Rate Relationship
It is conventionally assumed that the accretion rate in LMXBs is proportional to the X-ray flux, and since we measure the flux in an instrumentally-determined passband, there is always the possibility that spectral variations outside our passband will cause the proportionality to change between observation epochs. Here we explore this possibility in detail, both from the spectral shape (via the X-ray colors) within the RXTE passband (which is common to all the measurements), and in a broader band possible thanks to several occasions of contemporaneous Chandra and XMM-Newton observations.
III.1.1 X-ray Colors
Figure 4 shows the average RXTE/PCA colors within 0.2 days of each burst. The individual 128 s colors (not shown here) show some scatter in the color-color diagram but all remain in the “island” state that typically characterizes bursting atoll LMXBs. Evidently, the colors from 1997, 2002, 2004, 2006, and 2007 are similar. The colors from 1998 and 2000 are comparable, although the soft color from 2000 and the hard color from 1998 are slightly smaller than the colors from the other periods. On the other hand, the colors from the 2003 April are both significantly smaller, with fractional changes in the soft and hard colors of about 4% and 3%, respectively.

III.1.2 Broadband Spectra
To test the extrapolation of our spectral model fits to energies below the PCA and HEXTE passband, we also fitted the simultaneous 2002 July Chandra/RXTE and 2003 April XMM-Newton/RXTE broadband spectra (§ II.2 & § II.3). In both cases, two Comptonization components (comptt in XSPEC; Titarchuk 1994) were found necessary in order to accurately model the data (Thompson et al. 2005). Each spectrum contains a component with 0.1–0.2 keV seed photons, and a component with 0.8–0.9 keV seed photons. One of these components is characterized by a 6 keV electron plasma, and the other by a hotter electron plasma (20 keV or greater), to fit the hard tail. We could not unambiguously associate the high or low seed photon temperatures with either the high or low plasma temperatures, however, due to the model degeneracy that is introduced by the use of two Comptonization components. Table 2 lists the best-fit parameter values for each spectrum and for the model coupling to and to , plus fits to the 2003 April spectrum including an additional soft thermal component (see below).
| 2002 July | 2003 April | |||
|---|---|---|---|---|
| Parameter | 2CTTaaXSPEC model: tbabs*(comptt1 + comptt2). Each comptt component assumes cylindrical geometry. | 2CTTaaXSPEC model: tbabs*(comptt1 + comptt2). Each comptt component assumes cylindrical geometry. | 2CTTDBBbbXSPEC model: tbabs*(comptt1 + comptt2 + diskbb). The temperature of the disk blackbody at the inner disk radius was tied to the cooler seed photon temperature (indicated by “[ ]”). | 2CTTBBccXSPEC model: tbabs*(comptt1 + comptt2 + bbody). The blackbody temperature was tied to the cooler seed photon temperature (indicated by “[ ]”). |
| () | 3.33 0.01 | 2.4 0.1 | 3.73 0.01 | 3.19 0.01 |
| 1. (keV) | 0.21 0.01 | 0.16 0.01 | [0.19 0.01] | [0.15 0.01] |
| 1. (keV) | 6.46 0.03 | 5.9 0.4 | 5.9 0.3 | 6.0 0.3 |
| 1. | 4.72 0.01 | 4.2 0.1 | 4.4 0.1 | 4.3 0.1 |
| 2. (keV) | 0.85 | 0.94 0.02 | 0.75 0.04 | 0.84 0.05 |
| 2. (keV) | 17.4 | 19.5 | 19.3 | |
| 2. | 1.65 | 2.9 | 2.9 0.2 | 2.8 0.2 |
| (d.o.f.) | 0.89 (1498) | 1.22 (1152) | 1.09 (1151) | 1.02 (1151) |
Note. — Errors correspond to the 90% confidence interval for a single parameter. The 2002 July Chandra/RXTE spectrum had statistically significant data from 1–100 keV, and the 2003 April XMM-Newton/RXTE spectrum had statistically significant data from 0.5–100 keV. A multiplicative constant was included in the models to account for differences in the absolute flux normalizations between the instruments.
The model spectra for both epochs are presented in Figure 5, which shows that the major model-independent differences are that the 2002 July spectrum peaks (in ) at 1.3 keV, while the 2003 April spectrum peaks at 3.1 keV. RXTE observations without simultaneous low-energy coverage are, for the most part, insensitive to such changes in the soft flux, although the smaller soft colors (Fig. 4) during 2003 April are suggestive of this difference. The model fitting the broadband 2003 April spectrum implies a 6% increase in the flux relative to the fit with only RXTE data, illustrating how a wider passband can reveal additional flux not apparent in the model extrapolated from the 3–100 keV band. Still, the discrepancy between the persistent flux and the “recurrence time flux” is 30–40% (Fig. 3).

Relevant to the calculation of accurate bolometric fluxes for GS 1826238 (see § II.1.2) is the question of additional soft spectral components. To test for the presence of such components, we separately tried adding a multicolor disk blackbody (diskbb in XSPEC; Mitsuda et al. 1984) and a blackbody to our original spectral model, with the temperature of the soft component tied to the seed photon temperature of the cooler Comptonization spectral component. We interpret the model with a multicolor disk blackbody as an approximation to the accretion disk spectrum, or partial covering of the accretion disk due to the disappearance of the Comptonizing medium over a limited volume, and the model with a blackbody as partial covering of the neutron star surface, or an extended optically thick boundary layer. In this picture, the soft photons acting as seed photons therefore emerge without being Comptonized.

For the 2002 July spectrum, we found that the additional component in each case (disk blackbody or blackbody) did not improve the fit to the data, yet allowed for a 4–5% increase in the unabsorbed bolometric flux relative to the fit without the additional component. On the other hand, the fit to the 2003 April spectrum significantly improved in each case, with -test probabilities of essentially zero that the improvement to the fit occurred by chance. The unfolded spectra and residuals for the double Comptonization plus multicolor disk blackbody model is shown in Figure 6 (top & bottom panels). The residuals for the double Comptonization model derived using RXTE data alone, and using both XMM-Newton and RXTE data are also shown (middle panels). We stress, however, that the spectral fits for the models including a soft component should be considered illustrative. Accurately fitting a soft spectral component together with Comptonization components is problematic for larger seed photon temperatures because the comptt model assumes a Wien input spectrum rather than a thermal spectrum. This approximation, while leading to negligible changes to the spectrum at high energies, leads to an underestimation of the low-energy flux.33 3 Nevertheless, the Comptonization model is more appropriate than empirical models such as a cutoff power law which, for , diverges at low energies. Compounding the issue is the interplay between the soft spectral component and the absorbing column density (see Fig. 6, inset); although the single-parameter uncertainty in the absorbing column density is very small (0.2%), the two-parameter confidence contour between the absorbing column density and disk blackbody normalization () suggests a much larger uncertainty. Because reliable interpretation of the fits is not possible, we do not include the soft component normalization values in Table 2. Nevertheless, with the additional disk blackbody component the unabsorbed bolometric flux of the 2003 April spectrum is 3.7 erg cm-2 s-1, which is 50% larger than the values obtained with only RXTE. With an additional blackbody, the unabsorbed flux is 3.3 erg cm-2 s-1, or 30% larger than the values obtained with RXTE alone. Although the flux-recurrence time relation (Fig. 2) used the absorbed fluxes, a direct comparison can be made by noting that the unabsorbed fluxes for the other observing epochs are consistently 5% larger (because a constant absorbing column density was used when extrapolating the 3–100 keV models to the wider 0.1–200 keV passband). The large fraction of soft flux contained in these components can clearly be seen in Figure 7. Therefore, despite the limited ability to acquire physical understanding of a soft thermal component in the 2003 April spectrum, it is a distinct possibility that the presence of one can account for the apparent disparity between measured persistent flux and the flux level that is expected given the burst recurrence time (Fig. 2).

III.2. Rapid Variability
Each of the 18 average power spectra show very similar characteristic frequencies and rms amplitudes for the Lorentzian components representing the band-limited noise. The one major exception is the power spectrum from 2003 April, in which the characteristic frequencies are significantly higher. The 1998 June optical/ data show frequencies higher by a factor of 2. A single low frequency QPO is present in seven of the PSDs, and in all but two cases this QPO appears to be associated with . Five of the PSDs have two low frequency QPOs, and in each case the higher (lower) frequency QPO also appears to be associated with (). Similar low frequency QPOs have been observed in black holes and other neutron stars (e.g., Olive et al. 1998, Nowak 2000, Jonker et al. 2000), and even in previous observations of GS 1826238 (Barret et al. 2000).

Three of the power spectra are displayed in Figure 8. The top panel shows the power spectrum from 1998 June (optical), the middle panel from 2003 April, and the bottom panel from 2006 August. The latter is more indicative of the timing characteristics seen during the other RXTE observation epochs. Figure 9 shows the correlation between the two Lorentzian components that are present and well-constrained in all of the power spectra: and . The dotted line shows the best-fit linear trend. Similar correlations between the Lorentzian characteristic frequencies has been seen in many other sources (e.g., Psaltis et al. 1999, Wijnands & van der Klis 1999, Belloni et al. 2002, van Straaten et al. 2002), whether it be between the horizontal branch oscillation frequency and the lower frequency kHz QPO in Z-sources, or between the lower and upper frequency kHz QPOs in atolls, etc. Given that these correlated timing features are rather common in neutron stars and black holes, the present correlation does not come as a surprise.

III.3. Early Ignition
Although the X-ray spectral shape and timing characteristics are both atypical during 2003 April (and, to a lesser extent, 1998 June), it is also possible that some variation in the burst ignition properties contributes to the unexpectedly short burst recurrence times measured during those observations. Bildsten 2000 pointed out that because the instability leading to bursts is a local phenomenon, the time for instability to develop depends on the accretion rate per unit area rather than the global accretion rate. A faster ignition time in 2003 April could thus be explained by accretion over a more limited area of the surface of the neutron star relative to the other observing epochs. Even if the instability begins sooner, we expect the burst will consume all of the fuel that has been accreted since the previous burst because, although the instability leading to the burst is a local phenomenon, the subsequent spreading burning front encompasses the entire stellar surface (Spitkovsky et al. 2002; Bhattacharyya & Strohmayer 2007). In this case, we would expect the burst fluences to be reduced approximately to the ratio of the recurrence times, i.e., 3/4, assuming no change in the fuel composition at ignition, and a similar accretion rate in 2003 April as for the observations at similar persistent flux levels. Instead, the fluences for the 2003 April are roughly similar to the bursts at higher or lower accretion rates (Fig. 2, middle panel).
One way the burst fluences in 2003 April could still match the measured values for the other bursts despite 25% less fuel is a change in the composition of the fuel. The nuclear energy generation rate during bursts is , where is the mean hydrogen mass fraction in the layer, and we assume 35% energy loss due to neutrinos during the -process burning (e.g., Fujimoto et al. 1987). A H-fraction that is 35% greater at ignition for the 2003 April bursts could thus compensate for the smaller accreted mass. Naturally, the mean H-fraction will be higher for bursts with shorter recurrence times, since less time has passed for steady H-burning to reduce the accreted composition. The time to burn all the accreted hydrogen is hr (e.g., Cumming & Bildsten 2000), where is the CNO mass fraction, and the accreted composition. Assuming the accreted hydrogen begins burning immediately upon being accreted, the mean H-fraction in the fuel layer at ignition is then (for ): . For and this gives a H-fraction that is only 6% larger for the 2003 April bursts. Therefore, changes to the composition of the accreted material cannot explain how the fluences of the bursts in 2003 April are in agreement with the other observing epochs.
| Parameter | 2003 April | 2000 June/Sept | 2002 JulyaaExcluding 2003 April. |
|---|---|---|---|
| 39.7 0.6 | 38.8 1.2 | 40 4 | |
| 18.0 0.9 | 17 2 | 19 2 | |
| 47.3 1.1 | 43.5 0.8 | 45 9 | |
| 24.5 0.6 | 26.5 0.7 | 25.5 1.2 |
Note. — The units of , , and are seconds, and the units of are erg cm-2 s-1.
Significant changes to the shape of the burst light curves may indicate unusual or unexpected nuclear burning regimes. In order to characterize the burst profiles, we fitted a composite exponential curve to each burst, and we refer the reader to Galloway et al. 2006 for the details of the fitting procedure. We compared the 2003 April burst decay parameters to those from the period of the most similar persistent flux (2000 June/September), and to the periods with the most similar burst recurrence times (all observations after 2002 July, except 2003 April). This exercise revealed that the shapes of the burst profiles in 2003 April are qualitatively similar to the other epochs (Galloway et al. 2004; Heger et al. 2008). The parameter values are presented in Table 3. The only real indication of a significant difference between the light curves is in the second decay constant (), which is somewhat longer for 2003 April than in 2000 June/September. However, these parameters do systematically depend on the recurrence time due to the changing hydrogen fraction (see Fig. 4 from Heger et al. 2008). A more appropriate comparison might be with the bursts at the closest recurrence time, i.e., the bursts with a recurrence time of 3.5 hr (2002 July and later, excluding 2003 April). Although this is a more inhomogeneous sample compared to 2003 April and 2000 June/September, for 2003 April is consistent with the others, though slightly higher (but not significantly) in the mean. There is a slightly longer second decay constant and lower peak flux for the 2003 April bursts compared to the bursts at the next nearest flux determined by RXTE, but, similar to the comparison of , it is consistent with the bursts at the nearest recurrence time.
IV. Discussion
During 2003 April, the recurrence times of thermonuclear bursts from GS 1826238 were unexpectedly short given the persistent flux measured by RXTE and the previously-determined monotonic relation between these two parameters. At the same time, the spectrum from a simultaneous XMM-Newton observation (§ III.1.2) suggests that an additional soft thermal component may be present at this time, which could increase the unabsorbed bolometric flux by up to 50%. A significant piece of evidence supporting a redistribution of the accretion energy within the X-ray bands is the accompanying shift of the variability to faster timescales (Fig. 9), because correlations between higher power spectral frequencies and softer energy spectra are observed almost ubiquitously in black hole candidates and in many neutron stars. A direct relationship between QPO frequency and power-law index has been seen in many black hole candidates (Vignarca et al. 2003; Kalemci et al. 2004; Kalemci et al. 2005; Kalemci et al. 2006; Shaposhnikov & Titarchuk 2006, e.g.,), and in at least five neutron stars (e.g., Titarchuk & Shaposhnikov 2005). Moreover, episodes of rare soft thermal components (interpreted as the accretion disk) lasting for several months in the black hole candidate GRS 1758–258 seem to be triggered by a decrease in the hard emission (Pottschmidt et al. 2006). Perhaps the most relevant example is from Ford et al. 1997, however, who showed that there is a direct correlation between the flux of the blackbody component and the QPO frequency in the burster 4U 0614+091. Although high frequency QPOs are not observed in the GS 1826238 power spectra, the correlations between the frequencies of QPOs and broadband noise components in other sources make it tempting to speculate that the higher PSD frequencies in 2003 April are indeed coupled with a soft spectral component, the presence of which is presumably related to changes in the accretion geometry.
The correlations between faster variability and soft spectral components can be understood in the context of truncated disk models for accretion in X-ray binaries, which explain the low/hard to high/soft spectral transitions seen in both black hole and neutron star systems (for a recent review, see Done et al. 2008). For neutron star binaries at low (0.04–0.08 in GS 1826238, assuming kpc), such models consist of a thin accretion disk that is truncated at some radius far from the surface, probably due to evaporation of the accretion disk (Meyer et al. 2000; Mayer & Pringle 2007), and an optically thin44 4 Note that the spectral parameters in Table 2 do not support an optically thin interpretation. We defer a detailed analysis of the spectrum using more sophisticated models such as eqpair for a subsequent paper. but geometrically thick hot inner flow that smoothly transitions to the boundary layer. Seed photons from the surface of the star and from the inner edge of the disk cool the inner flow. At higher accretion rates, the inner radius of the disk moves inwards, which reduces the volume of the region occupied by the hot inner flow. Assuming that most of the variability comes from this region, then a smaller volume would naturally account for the faster variability. In addition, the smaller disk radius will lead to a more prominent soft spectral component.
One could argue that the soft photon flux should be present all the time, and perhaps just not detectable in the other observations due to poorer low-energy coverage. According to truncated disk models, however, at low accretion rates the accretion disk is expected to be far from the surface of the neutron star (e.g., Esin et al. 1997). If we assume that the power spectral break frequency is associated with the inner disk radius and the orbital frequencies are Keplerian (), we expect the inner disk radius in 2002 July, for example, to be 3 times larger than in 2003 April, and the integrated disk flux to be 3 times smaller (Frank et al. 1992, p.73). This is roughly consistent with the ratio of the absorbed soft fluxes shown in Fig. 5.
Given that the 2003 April power spectral frequencies are the highest, and at the same time the burst recurrence time suggests the accretion rate is the highest, it is worth considering that an alternative indicator for the mass accretion rate may be the timing data rather than the X-ray flux. For example, it has been proposed that is positively correlated with the mass accretion rate (e.g., van der Klis 1994). If this were the case, however, we would expect a monotonic relationship between and burst recurrence time (which we also assume to trace mass accretion rate). Such a relationship does not exist. To see this, one must only consider the data from 1998 June (optical); the break frequency is the second highest value even though the inferred accretion rate is the third lowest (only 1997 November and 1998 June have longer burst recurrence times, Fig. 2). On the other hand, the two observing epochs showing the largest disparity between the recurrence time flux and the observed flux (Fig. 3), i.e., 1998 June (optical) and 2003 April, also exhibit the highest break frequencies. Therefore, it may be the case that is a better tracer of the soft thermal flux and not the bolometric flux, although the absence of low-energy spectral coverage in the majority of GS 1826238 observing epochs precludes a detailed comparison.
An alternative explanation is that the bursts are igniting earlier, perhaps because the area over which the accretion occurs has decreased; however, any plausible mechanism to ignite the bursts earlier would also give rise to bursts that were significantly less energetic than others at comparable X-ray fluxes, whereas we find bursts in 2003 April with fluences comparable to those in other epochs. Thus, we conclude that the X-ray flux measured by RXTE in 2003 April underestimates the bolometric flux to a much greater degree than in other epochs, likely due to the presence of enhanced X-ray emission below 2 keV. This implies that although the X-ray flux measured by RXTE in 2003 April was similar to what was observed in 2000 June/September, the accretion rate (and “true” bolometric flux) in 2003 April must have been at its highest level because the recurrence time was the smallest. This idea is consistent with truncated disk models, which explain the emergence of the soft spectral component by a reduction of the inner disk radius at high accretion rates. In this scenario, the previous and subsequent RXTE observations of GS 1826238 fortuitously maintained a fairly strict correspondence between X-ray flux in the RXTE passband and accretion rate due to a relatively constant spectral shape. Our results indicate that the spectral shape in GS 1826238 starts to undergo a significant transformation when the bolometric flux is above about erg cm-2 s-1, or when the luminosity is above erg s-1 .
There are other factors that could play a role during the periods of discrepant bursting behavior. One possibility is that the photon emission from GS 1826238 may be anisotropic. Such emission is expected any time the scattering optical depth is much lower over a limited range of solid angles than in other directions (King et al. 2001), and includes any source with an accretion disk. Recent work by Heger et al. (2008) suggests that emission anisotropy does indeed influence the observational characteristics of GS 1826238. In order for the burst timing and energetics from RXTE observations between 1997 November to 2002 July to match theoretical ignition models, they found that . Different anisotropy factors for the burst and persistent emission are expected because the radiation can be attributed to geometrically distinct regions (Fujimoto 1988). If we assume that the burst emission is isotropic, the results of Heger et al. (2008) indicate that the persistent luminosity may be underestimated by a factor of 1.55 in all observing epochs. To determine if anisotropic emission affected the 2003 April data to a higher degree than the other time periods, however, would require the results to be extended to include this epoch.
References
- Aschenbach (2002) Aschenbach, B. 2002, Proc. SPIE, 4496, 8
- Barret et al. (2000) Barret, D., Olive, J. F., Boirin, L., Done, C., Skinner, G. K., & Grindlay, J. E. 2000, ApJ, 533, 329
- Belloni et al. (2002) Belloni, T., Psaltis, D., & van der Klis, M. 2002, ApJ, 572, 392
- Bhattacharyya & Strohmayer (2007) Bhattacharyya, S., & Strohmayer, T. E. 2007, ApJ, 666, L85
- Bildsten (2000) Bildsten, L., 2000, in AIP Conf. Proc. 522, Cosmic Explosions, ed. S. S. Holt & W. W. Zhang (Melville: AIP), 35
- Canizares et al. (2005) Canizares, C. R., et al. 2005, PASP, 117, 1144
- Cocchi et al. (2001) Cocchi, M., et al., 2001, in Adv. Space Res., 28, 275 (Elsevier)
- Cornelisse et al. (2003) Cornelisse, R., et al. 2003, A&A, 405, 1033
- Cumming & Bildsten (2000) Cumming, A., & Bildsten, L. 2000, ApJ, 544, 453
- Done et al. (2007) Done, C., Gierliński, M., & Kubota, A. 2007, A&A Rev., 15, 1
- Esin et al. (1997) Esin, A. A., McClintock, J. E., & Narayan, R. 1997, ApJ, 489, 865
- Frank et al. (1992) Frank, J., King, A., & Raine, D. ed. 1992, Accretion Power in Astrophysics (2nd ed.; Cambridge: Cambridge Univ. Press)
- Ford et al. (1997) Ford, E. C., et al. 1997, ApJ, 486, L47
- Fujimoto et al. (1987) Fujimoto, M. Y, Hanawa, T., Iben, I., & Richardson, M. B. 1987, ApJ, 315, 198
- Fujimoto (1988) Fujimoto, M. Y. 1988, ApJ, 324, 995
- Galloway et al. (2004) Galloway, D. K., Cumming, A., Kuulkers, E., Bildsten, L., Chakrabarty, D., & Rothschild, R. E. 2004, ApJ, 601, 466
- Galloway et al. (2006) Galloway, D. K., Muno, M. P., Hartman, J. A., Savov, P, Psaltis, D., & Chakrabarty, D. 2006, ApJS, submitted
- Garmire et al. (2003) Garmire, G. P., Bautz, M. W., Ford, P. G., Nousek, J. A., & Ricker, G. R., Jr. 2003, Proc. SPIE, 4851, 28
- Hasinger & van der Klis (1989) Hasinger, G., & van der Klis, M. 1989, A&A, 225, 79
- Heger et al. (2007) Heger, A., Cumming, A., Galloway, D. K., & Woosley, S. E. 2008, ApJL, accepted
- Homer et al. (1998) Homer, L., Charles, P. A., & O’Donoghue, D., 1998, MNRAS, 298, 497
- (22) Jahoda, K., et al. 2006, ApJS, 163, 401
- Jonker et al. (2000) Jonker, P. G., et al. 2000, ApJ, 531, 453
- Kalemci et al. (2004) Kalemci, E., Tomsick, J. A., Rothschild, R. E., Pottschmidt, K., & Kaaret, P. 2004, ApJ, 603, 231
- Kalemci et al. (2005) Kalemci, E., et al. 2005, ApJ, 622, 508
- Kalemci et al. (2006) Kalemci, E., Tomsick, J. A., Rothschild, R. E., Pottschmidt, K., Corbel, S., & Kaaret, P. 2006, ApJ, 639, 340
- King et al. (2001) King, A. R., Davies, M. B., Ward, M. J., Fabbiano, G., & Elvis, M. 2001, ApJ, 552, L109
- Kong et al. (2007) Kong, A. .K. H., et al. 2007, ApJL, 670, L17
- Leahy et al. (1983) Leahy, D. A., et al. 1983, ApJ 266, 160
- Meyer et al. (2000) Meyer, F., Liu, B. F., Meyer-Hofmeister, E. 2000, A&A, 361, 175
- Mayer & Pringle (2007) Mayer, M., & Pringle, J. E. 2007, MNRAS, 376, 435
- Mitsuda et al. (1984) Mitsuda, K., et al. 1984, PASJ, 36, 741
- Nowak (2000) Nowak, M. .A. 2000, MNRAS, 318, 361
- Olive et al. (1998) Olive, J. F., Barret, D., Boirin, L., Grindlay, J. E., Swank, J. H., & Smale, A. P. 1998, A&A, 333,942
- O’Donoghue (1995) O’Donoghue, D. 1995, BaltA, 4, 519
- Pottschmidt et al. (2006) Pottschmidt, K., Chernyakova, M., Zdziarski, A. A., Lubiński, P., Smith, D. M., & Bezayiff, N. 2006, A&A, 452, 285
- Psaltis et al. (1999) Psaltis, D., Belloni, T., & van der Klis, M. 1999, ApJ, 520, 262
- Rothschild et al. (1998) Rothschild, R. E., et al. 1998, ApJ, 496, 538
- Shaposhnikov & Titarchuk (2006) Shaposhnikov, N., & Titarchuk, L. 2006, ApJ, 643, 1098
- Spitkovsky et al. (2002) Spitkovsky, A., Levin, Y., & Ushomirsky, G. 2002, ApJ, 566 1018
- (41) Stetson, P. B. 1987, PASP, 99, 191
- Strohmayer & Bildsten (2006) Strohmayer, T. E., & Bildsten, L. 2006, in Compact Stellar X-ray Sources , ed. W. H. G. Lewin, & M. van der Klis (Cambridge: Cambridge University Press), 113
- Titarchuk (1994) Titarchuk, L. 1994, ApJ, 434, 570
- Titarchuk & Shaposhnikov (2005) Titarchuk, L., & Shaposhnikov, N. 2005, ApJ, 626, 298
- Thompson et al. (2005) Thompson, T. W. J., Rothschild, R. E., Tomsick, J. A., & Marshall, H. L. 2005, ApJ, 634, 1261
- Ubertini et al. (1999) Ubertini, P., et al., 1999, ApJ, 514, L27
- van der Klis (1994) van der Klis, M. 1994, ApJS, 92, 511
- van Straaten et al. (2002) van Straaten, S., van der Klis, M., Di Salvo, T., & Belloni, T. 2002, ApJ, 568, 912
- Vignarca et al. (2003) Vignarca, F., Migliari, S., Belloni, T., Psaltis, D., & van der Klis, M. 2003, A&A, 39 729
- Wijnands & van der Klis (1999) Wijnands, R., & van der Klis, M. 1999, ApJ, 514, 939
- Woosley et al. (2004) Woosley, S. E., et al. 2004, ApJS, 151, 75
- Yaqoob et al. (2003) Yaqoob, T., George, I. M., Kallman, T., Padmanabhan, U., Weaver, K., & Turner, T. J. 2003, ApJ, 596, 85