Recent advances of NMR and NQR studies of YBa2Cu3O7-δ and YBa2Cu4O8
Abstract
Nuclear magnetic resonance (NMR) and nuclear quadrupole resonance (NQR) techniques have supplied us with unique information on local incoherent phenomenon as well as low frequency magnetic response of electronic systems. Some of recent advances in the studies of high- cuprate superconductors are based on site-selective measurements of the local electronic state and the local electron spin dynamics. High- superconductors YBa2Cu3O7-δ (the optimal = 93 K) and YBa2Cu4O8 ( = 82 K) with double-layer CuO2 planes have been studied by NMR and NQR techniques. From the intensive studies at the early stage, two-dimensional antiferromagnetic spin fluctuations and pseudo spin-gap in the magnetic excitation spectrum turned out to be key ingredients to characterize the novel electronic states, associated with the occurrence of superconductivity. Wipeout effect is a new key to characterize superconductor-insulator boundary in the lightly doped regime and impurity substitution effects. What happens near in-plane impurities and inside vortex cores in such novel electronic states? Nonmagnetic impurity Zn decreases of the -wave superconductivity because of the breakdown of Anderson theorem. From the careful NMR and NQR studies, it was concluded that the pseudo spin-gap in the normal state is robust for the substitution of nonmagnetic impurity Zn and magnetic impurity Ni. In the vicinity of a superconductor-insulator boundary induced by impurity, however, the pseudo spin-gap is suppressed. Collapse of low energy pseudo spin-gap due to the heavily substituted impurity Zn was also evidenced by neutron scattering measurements. For the impurity-substituted samples and in the vortex state of pure samples, the characteristic NMR and NQR spectra were observed. The local enhancement of magnetic correlation near the impurity Zn and inside the vortex core was observed from the frequency distribution of nuclear spin-lattice relation time . Scanning tunneling spectroscopy detects local density of states of electrons near Zn in the superconducting state. NMR and NQR experiments detect the local magnetism near Zn and inside the vortex cores.
I INTRODUCTION
Nuclear magnetic resonance (NMR) and nuclear quadrupole resonance (NQR) are powerful techniques to characterize local incoherent phenomenon in materials Slichter; Slichter2007, whereas neutron and X-ray scattering techniques are sensitive to coherent phenomenon Marshall. Microscopic studies using the NMR and NQR techniques have provided us with rich information on crystalline imperfection, dilute exchange spin networks, Friedel oscillation, Ruderman-Kittel-Kasuya-Yosida (RKKY) oscillation, and Kondo screening effect in materials Narath; Jac; Alloul; Gruner. Some of recent advances in the NMR and NQR studies of high- cuprate superconductors are based on site-selective measurements of the local electronic state and the local electron spin dynamics.


YBa2Cu3Oy (6.47) (Y123) system is a widely known high- superconductor. Y123 has two inequivalent crystallographic Cu sites; bilayer plane-site Cu(2) and single chain-site Cu(1). Figure 1 shows the crystal structures of the Y123 family. The maximum superconducting transition temperature is 93 K at the optimal oxygen concentration of = 6.926.96. For oxygen deficiency of 6.46.6, the 60 K phase is known to show a typical underdoped electronic state with pseudo gap and pseudo spin-gap. Figure 2 is a typical phase diagram of the Y123 Rossat.
Non-stoichiometry in compounds gives rise to inhomogeneous broadening in NMR and NQR spectra, which often prevents us from extracting intrinsic electronic properties. YBa2Cu4O8 (Y124) with bilayer CuO2 planes and double CuO chains has = 82 K. It is a stoichiometric and naturally underdoped compound. The oxygen concentration is hard to be removed. Because of chemical stability and of lack of oxygen disorder effects, since the first observations of Cu NQR Mali; Zimmermann, NMR and NQR studies have been intensively carried out for Y124 as well as the Y123 family to reveal intrinsic electronic properties PS; Berthier; Rigamonti.
The aim of this article is to present some of the recent advances of NMR and NQR studies of high- superconductors Y123 and Y124. The article is organized to show (II) the present understanding of magnetic phase diagram with respect to doped hole concentration, (III) impurity-substitution effects, (IV) impurity-induced NMR and NQR relaxation, and (V) vortex core state in the superconducting mixed state. Recent scanning tunneling microscopy (STM) and spectroscopy (STS) studies of high- superconductors have supplied us with vital information of local density of states of electronBalatsky; Fischer. Local microscopic magnetism near impurity and vortex core, which we are concerned about, is the matter that NMR and NQR can clarify actually.
II MAGNETIC PHASE DIAGRAM
II.1 TWO DIMENSIONAL RENORMALIZED CLASSICAL REGIME
The parent undoped compound YBa2Cu3O6 is a Mott insulator and bilayer-coupled Heisenberg antiferromagnet with a Néel temperature = 415 K. The plane-site Cu(2)2+ carries an unpaired moment = 1/2. The chain-site Cu(1)1+ has a closed shell. The paramagnetic state is in two dimensional renormalized classical regime, where the antiferromagnetic correlation length diverges exponentially with cooling toward = 0 K AA; CNN; MT as
| (1) |
where is a spin stiffness constant proportional to an in-plane exchange coupling constant . The value of is estimated to be about 150 meV RM. Because of a spin = 1/2 system, there is no single-ion anisotropy due to electrostatic crystalline potential. The spin wave dispersion in the Néel state is nearly gapless RM, which leads to high Cu nuclear spin-lattice relaxation rate at low temperatures below Tsuda. Thus, the higher than room temperature can be considered to result from the strong in-plane with XY anisotropy Hanzawa and three dimensional interactions of as CNN.

The renormalized classical behavior in Cu nuclear spin-lattice relaxation was first observed by Imai et al. Imai for La2CuO4. The measurement of high temperature spin dynamics is a highlight in the successful NMR spin-echo experiments. Subsequently, such a renormalized classical behavior in NMR relaxation was observed by Pozzi et al. for Y1236 Pozzi, Ca0.85Sr0.15CuO2 ( = 539 K) Pozzi2, by Fujiyama et al. for PrBa2Cu4O8 ( = 230 K) Fujiyama and by Thurber et al. for three-leg ladder Sr2Cu3O5 ImaiL.
II.2 SUPERCONDUCTOR-INSULATOR BOUNDARY

As the hole concentration increases, is reduced and finally the superconductivity emerges. According to a field theory applied to a non-linear sigma model CNN; ChubSach; Sandvik and to a modified spin wave theory Yosida in the insulating regime, a spin frustration effect destroys the coherency of an antiferromagnetic network and finally a paramagnetic state or disordered gapped state should emerge through a two dimensional quantum critical point (QCP). According to the SCR (self-consistent renormalized) theory for a two dimensional spin fluctuation model in the itinerant regime, the static staggered magnetisation in a weakly antiferromagnetic state is reduced and finally a nearly antiferromagnetic state emerges through an itinerant two dimensional QCP MTU.
Figure 3 (b) shows the nuclear spin-lattice relaxation rate calculated by SCR (self-consistent renormalization) theory from weakly antiferromagnetic to nearly antiferromagnet in two dimension reproduced from MTU. Although the development of the spin dynamics with hole doping from Y1236 to Y1248 in Fig. 3 (a) is similar to that via the QCP in Fig. 3 (b), the actual cuprates change from insulator to superconductors through a Mott transition. What happens at the boundary from insulating side to superconducting side?
Wipeout effect on NMR is a key to characterize the physics at the boundary of the Y123 family as well as La2-xSrxCuO4 Imai1; Imai2; JB. Sudden disappearance of Cu NMR and NQR signals is observed near the superconductor-to-insulator boundary of Y1-xCaxBa2Cu3Oy. Figure 4 shows a magnetic phase diagram of Y1-xCaxBa2Cu3Oy Singer. In general, the wipeout is recognized as an ill-defined physical quantity. Nevertheless, it well characterizes what happens near the phase boundary. An abrupt wipeout effect is different from conventional slowing down phenomenon, where the nuclear spin relaxation should become fast. The wipeout effect without any slowing down effect on the observable NMR/NQR signals leads us to conclude that the electron spin fluctuation spectrum should consist of two components in frequency space. One is a main spectrum, which may be called a fast mode. The other is the induced low frequency spectrum, similar to a central mode in structural phase transition, which may be called a slow mode. In Fig. 4, the existence of the slow mode is evidenced by ligand 89 Y NMR relaxation measurements Singer. Because of a weak 89Y nuclear-electron coupling constant AOM, the fast nuclear relaxation component being unobservable by Cu nuclear spin-echo is observed by 89 Y NMR.

The spin fluctuation spectrum with two energy scales reminds us of a phenomenological itinerant-localized dual model Miyake; Narikiyo. The actual slow mode is inhomogeneous in space and in frequency. In most cases, Mott transition is first order transition. Thus, such a slow mode may be associated with the character of first order transition.
Holes are doped into the plane-site oxygens IFT. In the superconducting regime, the doped holes do not have independent spin degree of freedom, which is indicated by a single scaling relation of 17O(2, 3) with 63Cu(2) Knight shifts Takigawa. The leading spin component of conduction band is single AOM; Takigawa; Imai3. The doped holes do not carry isolated free moments but are considered to form Zhang-Rice bound singlets of 3 ZR. The Zhang-Rice singlets are localized in the semi-conducting regime at low temperatures. The phenomenological slow mode may be associated with the localized Zhang-Rice singlets, which cause the wipeout effect on NMR/NQR.
Can we observe NMR/NQR signals associated with the Zhange-Rice singlets in any cases? One may find a few examples of high frequency Cu NQR signals in some doped cuprates. For the hole-doped ladder and linear chain oxides of Sr14Cu24O41 TakigawaL and Ca0.85CuO2 Yokoyama, Cu NMR/NQR signals near the Zhang-Rice singlets are observed in the chain sites. In spite of the singlets, the nuclear spin-lattice relaxation time is relatively short. For Li-substituted La2CuO4 Rykov and NaCuO2 Luders, non-mganetic Cu3+ NQR signals are observed to be in low spin electronic states. The observed magnetism of Cu2+δ of 3 is different from Cu3+ so far. One should proceed further site-selected NMR studies to observe the local electronic state of Zhang-Rice singlets in doped oxides.
II.3 NORMAL-STATE PSEUDO SPIN-GAP
Normal-state pseudo gap and pseudo spin-gap are characteristic anomalies of the underdoped superconductors. The existence of normal state gap is inferred from the above- decrease of nuclear spin-lattice relaxation rate divided by temperature 1/ ImaiPSG; AOM; Takigawa; YasuokaPSG; Warren; Horvatic. 1/ is the square of hyperfine coupling constant times the wave vector averaged low frequency dynamical spin susceptibility (wave vector and frequency ) Moriya0. Inelastic neutron scattering confirms the low frequency suppression of for underdoped Y123 RM. The effect of the pseudo spin-gap is also recognized in transport properties Uchida.


Figure 6 shows the typical hole doping dependence of pseudo spin-gap temperature for Y(Ba1-xLax)2Cu3Oy, which is defined by the maximum temperature of Cu 1/ Matsumura; Auler. The effect of the opening of pseudo spin-gap is not a phase transition but a crossover phenomena. The decreases as the hole concentration per Cu increases and then coincides with at slightly overdoped concentration. Although the existence of overdoped regime of Y123y is known for single crystals, it was unclear for polycrystalline samples. Yamamoto et al. found the method of a solid state reaction and heat treatment to synthesize the overdoped polycrystalline Y1237 with = 88 K Yamamoto.
One should note that the above- behavior of 1/ is of Curie-Weiss type but not Korringa law Singer; WilliamsOV. Although the non-Korringa behavior in the overdoped regime is not widely recognized, the Curie-Weiss type 1/ is also confirmed for overdoped La1.80S0.20CuO4 Itoh020, La1.77S0.23CuO4 Itoh023, and HgBa2CuO4+δ ItohOV. The high temperature electronic state in the overdoped regime is not conventional Landau-Fermi liquid. There is no phase boundary in the high temperature electronic state at the optimally doped-to-overdoped regimes.
Since the pseudo spin-gap effect was not obvious in single layer La2-xSr2CuO4, it had been suspected that such a gap is not essential for high . Does the pseudo spin-gap result from a spin singlet paring in the adjacent CuO2 layers as a property peculiar to double layer compounds MM or from an inherent property in a single CuO2 plane? It had been a long term problem. Distinct conclusion was obtained from single layer HgBa2CuO4+δ ItohHg1201; BobroffHg1201. The pseudo spin-gap is an inherent nature of the high- superconductors, irrespectively of the number of CuO2 planes per unit cell. The doping dependence of of the single layer HgBa2CuO4+δ is different from that of the double layer HgBa2CaCu2O6+δ ItohHg1212. The as a function of the hole concentration depends on the number of CuO2 planes per unit cell and on the shape of underlying electronic Fermi surface.
Two theoretical explanations have been proposed. In the two dimensional - model with spinon-holon decomposition technique, the pseudo spin-gap temperature is regarded as the onset temperature of singlet RVB (resonating valence bond) formation of spinons Kotliar; Suzumura; TKF. The real is given by Bose-Einstein condensation temperature , leading to the underdoped regime. In the existing calculations, is given by a second order phase transition temperature. Figure 7 (a) shows a numerical calculation of as a function of doped hole concentration TKF. The doping dependence of depends on the contour of a basal Fermi surface. For each high- family with different Fermi surface, shows a different doping dependence.
In the two dimensional superconducting fluctuation theory, the pseudo spin-gap temperature is regarded as the onset of enhancement of -wave superconducting fluctuations and a mean-field . The actual is reduced by the strong superconducting fluctuations so that the underdoped regime appears. Thus, the mean-field is a crossover temperature. Figure 7 (b) shows the mean-field and the suppressed Yanase
III IMPURITY-SUBSTITUTION EFFECT
III.1 PAIR BREAKING AND SUPERUNITARY
Magnetic and nonmagnetic impurity substitution effects have been studied for the high- superconductors, where the impurity is substituted for the plane-site Cu(2). The impurity Zn (spinless = 0) induces Curie magnetism, a local staggered spin susceptibility in the normal state, an in-gap antiferromagetic dynamical spin susceptibility, and a virtual bound electronic state around Zn in the superconducting state.
In strong coupling superconductors, the actual super conducting transition temperature is determined by competition between pairing effect and depairing effect OhashiShiba. In the phonon-mediated superconductors, the depairing effect due to thermal phonon competes the paring effect due to virtual phonon. For -wave superconductors, non-magneitc impurities do not suppress superconductivity because of Anderson’s theorem, unless they induce Anderson localization effect. For -wave superconductors, non-magneitc impurities suppress superconductivity. This is a natural consequence of breakdown of Anderson’s theorem Millis; Balian. The superconducting state of the high- superconductors is characterized by -wave pairing Scalapino.
The criterion of scattering strength of impurities is given by the value of ,
where is the density of states of electrons at the Fermi level, a nonmagnetic potential depth , and an exchange coupling constant of a magnetic impurity with conduction electrons. A weak scatterer can be treated by lowest order Born approximation as 1. A strong scatter can be treated by unitarity limit as 1.
In an -wave superconductor, weak magnetic scatterers suppress superconductivity:
| (5) |
where is in-plane impurity concentration. This is the Abrikosov-Gorkov’s formula. In a -wave superconductor, weak magnetic scatterers suppress superconductivity by
| (6) |
In the lowest order Born approximation, the -wave superconductor is twice robust than the -wave superconductor for the destructive magnetic impurities Maekawa; Openov.
For the magnetic impurity effect in -wave superconductors, one can neglect nonmagnetic potential scattering with each magnetic impurity, because of Anderson’s theorem. However, the potential scattering also affects -wave superconductivity as well as the magnetic impurity scattering. Thus one has to take into account both effects Maekawa; Salkola; Kilian.
Taking into account the impurity scatterings of classical spins () within a -matrix approximation, Ohashi derived the theoretical expression of (1) in a -wave superconductor ItohNi,
| (7) |
For , eq.(7) gives in the case of nonmagnetic impurity Zn Borkowski; Fehrenbacher; Arberg; Kitaoka, whereas gives in the case of magnetic impurity without nonmagnetic potential scattering. In the limit of and , eq.(7) leads to the expression of in the lowest order Born approximation Maekawa. In addition, or corresponds to the unitarity limit Hotta:
| (8) |
If cancellation of in the unitarity limit occurs for Ni, one obtains
| (9) |
which is two times smaller than that due to pure nonmagnetic scattering.

In Fig. 8, impurity substitution effects on are plotted against the concentration for various high- superconductors with impurity M=Ni or Zn. The solid (open) symbols are the Ni(Zn) doping dependence of . The data are adopted from AdachiNi; AdachiZn for optimally doped YBa2(Cu1-zMz)3O7 (upward triangles), Itoh; Miyatake; Watanabe for naturally underdoped YBa2(Cu1-zMz)4O8 (circles), and Xiao for La1.85Sr0.15Cu1-zMzO4 (downward triangles). The degree of suppression of by Zn and Ni impurities depends on the hole doping level in Y123y Liang. For less concentration of oxygen, becomes larger.
The decrease of by Ni substitution for the optimally doped Y1237 is most slow among these compounds. Using a reduced oxygen partial pressure technique, Adachi et al. succeeded in controlling of YBa2Cu3-xNixO7-δ with optimal oxygen concentration AdachiNi. They synthesized two series of YBa2Cu3-xNixO7-δ samples with the different ’s per Ni concentration. We call the samples with denoted by black upward triangles “as-synthesized” ones, because they were synthesized in flowing oxygen gas without quenching treatment, and the other samples with lower denoted by red upward triangles “quenched” ones, because they were the as-synthesized samples once again fired and quenched in a reduced oxygen atmosphere at 800 ∘C. In Fig. 8, Ni substitution dependence of is plotted for “as-synthesized” or “quenched” Y123 AdachiNi. The decrease of by Ni is larger in “quenched” Y123 than in “as-synthesized” one. Ni prefers the higher coordination of oxygen atoms. The plane-site Cu(2) is located in the pyramid with five oxygen ions, whereas the chain-site Cu(1) is coordinated with two, three, or four nearest neighbor oxygen ions. The two series of samples with different suggest that the distribution of Ni-substituted sites over Cu(1) and Cu(2) sites is changed through synthesis under the reduced oxygen atmosphere.
From the Cu(1) and Cu(2) NQR measurements, it turned out that the heat treatment in reduced oxygen atmosphere results in a redistribution of the Ni ions in YBa2Cu3-xNixO7-δ ItohNi. The plane-site 63Cu(2) nuclear spin-lattice relaxation for the quenched sample was faster than that for the as-synthesized sample, in contrast to the 63Cu(1) relaxation that was faster for the as-synthesized sample. This indicates that the density of plane-site Ni(2) is higher in the quenched samples, contrary to the chain-site Ni(1) density which is lower in the quenched samples. The Ni substitution for the chain Cu(1) site is a reason why the suppression of by Ni impurity is so slow in the optimally doped Y1237. In passing, Co impurity is also substituted both for Cu(1) and Cu(2) sites in the 1237, which was verified by Cu(1) and Cu(2) NQR by Kohori et al. Kohori prior to the Ni study ItohNi.
Monthoux and Pines had an insight into the impurity substitution effect on the host spin fluctuation spectrum, which yields the pairing interaction of high , as well as the life time of superconducting quasi-particles of Y123 Monthoux. They pointed out that the observed suppression of per Zn is too strong to be ascribed only to a simple potential scattering effect on quasi-particle lifetime:
| (10) |
According to the Cu NMR results for Y123 at the time Ishida, Zn impurity induces a large residual Knight shift and Korringa-like behavior in the superconducting state and non-exponential nuclear spin-lattice relaxation in the normal sate, while Ni does not alter the normal and the superconducting properties. Taken together with these NMR results for Y123, the impurity effect was classified into
The substitution of Zn impurity induces the changes in the host spin fluctuation spectrum, while Ni does not change it but induces the depairing effect on the quasi-particle life time. They proposed the strong suppresssion of due to a magnetic vacancy correlation function with a vacancy operator of an effective radius of :
| (14) |
The magnetic correlation is suppressed over a distance of . However, this correlation function is not compatible with all the subsequent NMR and neutron scattering results.
The fact of suppression of superconductivity by nonmagnetic impurities has been known from early stages. By the Cu NMR techniques, Ishida et al. found that Zn impurity in Y123 increases the residual Knight shift in the superconducting state Ishida. Although they did not observe the Zn-neighbhor Cu NMR signals, they found that the observed Cu NMR signals are shifted by Zn impurities. From the residual Cu Knight shifts, they inferred a quasi-partcile energy band formation of Zn-induced virtual bound states. Strong scattering impurity potential in the unitarity limit must induce a virtual bound state in the -wave superconducting state Poilblanc; BalatskyZn; Onishi; SalkolaSTM; BulutZn; Ohashi; Ohashi1; Ohashi2. Individual virtual bound states around Zn and Ni impurities are actually observed by STS technique Pan; Hudson. It remained to be solved whether the Zn strengthens Yamagata; AlloulBob or weakens Ishida local magnetic correlation around Zn in the optimally doped and overdoped systems and how the magnetic correlation near and away from Zn is changed or unchanged below and above . Zn-neighbor NMR and NQR measurements were highly desired.
As for the optimally doped Y1237, a part of Ni impurities is substituted for the chain-site and the amount of Ni substitution for the chain site can be controlled to some extent AdachiNi; ItohNi. The Cu NQR studies of the Ni-redistributed Y1237 as well as Ni-substituted Y1248 revealed that Ni also induces nonexponential NMR relaxation and suppresses ItohNi; Itoh1. Further, the detailed analysis of nonexponential relaxation revealed that no-exponential relaxation due to Zn indicates the change of the host spin fluctuation spectrum but that due to Ni does not necessarily indicates the change of the spin fluctuation spectrum Itoh; ItohNi; Itoh1; Itoh2; Itoh3; Itoh4; Itoh5; ItohZn.
III.2 SITE-SELECTIVE 89Y NMR NEAR Zn IMPURITY
The local magnetic correlation is not suppressed near Zn impurity. Mahajan et al. succeeded in observing the 89Y NMR signals near Zn impurities in Zn-substituted YBa2Cu3Oy Mahajan. It is an outstanding site-selective observation in the NMR studies of impurity-substituted high- superconductors. Figure 9 shows 89Y NMR spectrum (inset figure) for YBa2(Cu0.98Zn0.02)3O6.6 and the site-selected near and away from Zn, reproduced from Mahajan; MahajanEPJ. The Zn impurity induces Curie type magnetism near the impurity site and enhances the nuclear spin-lattice relaxation rate.

III.3 INELASTIC NEUTRON SCATTERING FOR Zn-SUBSTITUTED Y123
Inelastic neutron scattering experiments allow us to see the dynamical spin susceptibility as functions of wave vector and frequency . Kakurai et al. observed a large change of the dynamical spin susceptibility of Zn-substituted YBa2Cu3O6.35 Kakurai. Not only low energy but also high energy spectrum is changed by Zn substituion. Subsequent neutron scattering studies revealed for slightly-underdoped and optimally doped samples that not a simple shift of the spectrum weight but the development of an in-gap state is induced by Zn substitution Sidis.

The large change at low frequency was confirmed by a complete wipeout effect of Cu NQR signals by Kobayashi et al. for underdoped Y123 Kobayashi. A partial wipeout effect by Zn impurities has already been observed by Yamagata et al. for optimally doped Y1237 Yamagata. One should note that the relation between the in-gap state and the wipeout effect on Cu NQR for Zn-substitution is parallel to that for superconductor-insulator boundary.
IV ZERO FIELD Cu NQR STUDIES OF IMPURITY-INDUCED EFFECTS
IV.1 IMPURITY-INDUCED NUCLEAR SPIN-LATTICE RELAXATION
In contrast to 89Y NMR, Zn-induced effect on Cu NMR and NQR spectra are not apparently separable near and away from Zn impurity Ishida; Walstedt; JulienZn. Then, there had been a pessimistic view that no one can extract separable information of local magnetism from Cu NMR and NQR experiments. However, it turned out that the application of an impurity-induced nuclear spin-lattice relaxation theory McHenry; McHenry1 enables us to see such local information near the impurities from Cu NQR Itoh; ItohNi; Itoh1; Itoh2; Itoh3; Itoh4; Itoh5; ItohZn. Also, the finding of Zn-induced Cu NQR signals promotes the Cu NQR studies of the local antiferromagnetic correlation near the impurities WilliamsCu; ItohZn.
Let us briefly explain the impurity-induced nuclear spin-lattice relaxation theory McHenry; McHenry1. This theory has been applied for dilute Heisenberg insulators and dilute alloys. Assuming only the random distribution of impurities, a stretched exponential recovery curve is derived for any magnetic insulators and itinerant systems, because it is concerned with the kinetics of nuclear moments.
Figure 11 is a top view of a CuO2 plane with magnetic impurities. Solid red circles are the Cu nuclear sites. The relaxation process of a nuclear moment at a -site consists of two parts:
where the summation is taken over a distribution of impurities in a configuration. If one can observe the recovery curve (, ) of one nuclear spin at a th site in Fig. 11, it must be a single exponential function

| (15) | |||||
where 1/ is a nuclear spin-lattice relaxation rate occurring by a nuclear-impurity coupling. Here, is a distance between a nuclear and an impurity-induced moment, is a coupling constant between the nuclear spin and the impurity-induced moment, is the impurity-induced spin-spin correlation function Kilian; Ohashi; Ohashi1. is a nuclear resonance frequency. For an isolated local moment on the impurity site, we have a longitudinal direct dipole coupling , and a two-dimensional RKKY interaction McHenry; McHenry1. For an impurity-induced moment with a local , we have and e-r/ξ ( is a correlation length, and is a constant) Itoh1. Instead of including all the direct and indirect nuclear-electron interactions, we assume a minimal model with a single interaction and 1/.
The observed nuclear magnetization consists of nuclear spins with various configuration of randomly distributed impurities. The ensemble average is taken over all possible impurity configuration. Using a probability distribution, we obtain the nuclear magnetization
| (16) | |||||
where is the impurity concentration and the observed nuclear spins are assumed to lie on a space dimension. The nuclei within a radius (wipeout radius) of of the impurity are unobservable in conventional resonance frequency and time scale, so that they are excluded from the integration. In Fig. 11, blue large circles indicate the wipeout regions of a radius .
Taken into account a finite wipeout radius , the recovery curve of eq.(16) is expressed by
| (17) | |||||
where is wipeout number and is . After integrating eq.(16) in the limit of 0, the recovery curve is
| (18) | |||||
where an impurity-induced nuclear spin-lattice relaxation rate
| (19) |
where (=/) is 1/2 and is the decay rate of an impurity spin autocorrelation function. Thus, we obtain a theoretical recovery curve expressed by a product function of exponential function times stretched exponential function, eq.(17) and eq.(18).

In eq.(18), , and are the fit parameters. The original recovery curve expressed by is a function of a lot of time constants of , , , , . For 1, the product is approximated by , and then the spatial integral leads to the stretched exponential function with the single time constant . Thus, only two time constants, and , are obtained. is the Cu nuclear spin-lattice relaxation time due to the host Cu electron spin fluctuation via a hyperfine coupling. is the impurity-induced nuclear spin-lattice relaxation time. The distribution of is taken into consideration through but is not known a priori. Thus, we must assume the above-mentioned minimal form.
These theoretical curves are reproduced by more sophisticated manner SA. In passing, one may find a mathematically same expression for diffusion-limitted relaxation Blumberg; Lowe. It should be noted that the diffusion-limitted relaxation is based on the nuclear spin-spin relaxation in a long time and the impurity-induced non-exponenital function in a short time . Thus, the application of the form of eq.(16) itself is justified for any cases.
Figure 12 shows the nonexponential 63Cu(2) nuclear spin-lattice relaxation curves of Ni- and Zn-substituted Y1248 at = 4.2 K and the least squares fits using eq. (17) (solid curves) Itoh. In eq.(17), , , , and are the fit parameters. Both Ni and Zn impurities induce nonexponential recovery curves. A difference in Ni and Zn impurity effects is the wipeout number and the size of the wipeout radius . The wipeout radius around Zn is one order larger than that around Ni Itoh; Itoh2.
IV.2 SHRINK OF WIPEOUT REGION AROUN Zn
Figure 13 shows the Zu substitution dependence of the wipeout number and the estimated wipeout radius for Y1237 and Y1248 at = 4.2 K Itoh4. The wipeout region around Zn shrinks as Zn concentration is increased.

This is associated with the Zn-induced change of host antiferromagnetic spin fluctuations.
The size of the local magnetic state induced around Zn decreases as Zn concentration is increased, because the host antiferromagnetic correlation length decreases with Zn (see below). On the other hand, the superconducting virtual bound state (Andreev bound state) is induced around Zn and its size increases as Zn concentration is increased, because the upper critical field decreases with Zn and the superconducting coherence length increases with Zn Tomimoto. A virtual bound state around Zn is actually observed by STS technique Pan. The core radius is estimated to be .
In the theory based on SO(5) symmetry, if is equal to , the coexistence of superconductivity and antiferromagnetic long range ordering could be realized Zhang; Kohno. In an underdoped regime, Zn recovers the coherency of magnetic correlation over the destructive effect of magnetic dilution Hucker. Then, the effect of Zn on the size of the magnetic bound state may not be monotonic. Such recovery of the Néel ordering was also observed for La2-xSrxCuO4 with Ni Machi.
IV.3 Zn VS Ni


Although we believe that eq.(17) with a finite reproduces the actual recovery curve for impurity-substituted samples better than eq.(18) with a fixed = 0 Itoh2, there is a shortcoming of overestimation of above Itoh. Thus, we adopt the next best policy and apply eq.(18) to obtain host and guest spin dynamics.
Figure 14 shows (1/)host and 1/ using eq. (18) for Ni- and Zn-substituted optimally doped Y1237 ItohNi; ItohZn; Itoh5. Figure 15 shows (1/)host and 1/ using eq. (18) for Ni- and Zn-substituted underdoped Y1248 Itoh1; Itoh; Itoh3; ItohZn. Both Ni and Zn induce nonexponential nuclear spin-lattice relaxation for the underdoped and the optimally doped samples. But, for low impurity concentration, the host spin fluctuation is robust for Ni substitution but fragile for Zn substitution. The pseudo spin-gap behavior of 1/ is robust both for Ni and Zn substitution. For high impurity concentration, the strong wipeout effects on Cu NQR signals and the suppression of pseudo spin-gap are observed for both Ni- and Zn-substituted underdoped Y1248 Itoh3. This is consistent with the neutron scattering measurement for Zn-substituted oxygen deficient Y123 by Kakurai et al Kakurai.
IV.4 Cu(2) NQR NEAR Zn
Zn impurities induce low frequency satellite signals in the plane-site Cu(2) NQR spectra for Zn-substituted Y1248 WilliamsCu; Itoh3; ItohZn and Y1237 Yamagata; ItohZn. From the relative intensity of Cu NQR spectra, the satellite signals are assigned to Zn-neighbor Cu NQR lines. The Cu nuclear spin-lattice relaxation time of the satellite signal is shorter than that of the main signal in the superconducting state of Y1237 and Y1248 and even above for Y1248 ItohZn. Although Y1248 is a stoichiometric, homogenous, underdoped electronic system, the Zn-induced inhomogeneous magnetic response in the CuO2 plane is more marked than that of the optimally doped Y1237.


Figure 16 shows the Zn impurity substitution effects on 63Cu(2) NQR spectra at = 100 K in the normal states of Y1237 (a) and Y1248 (b). Figure 17 shows the 63,65Cu(2) NQR spectra at = 100 K for Y1237 (a) and for Y1248 (b) from the top to the bottom as functions of Zn concentration. The main signal intensity of the 63Cu(2) NQR spectrum around 31.5 MHz for Y1237 and around 29.8 MHz for Y1248 rapidly decreases as Zn impurity concentration is increased. The lower frequency tail and the broad satellite signal increases as Zn impurity concentration is increased. The solid and the dotted curves are numerical simulations using three Gaussian functions (, , and ). By two Gaussian functions of and , we can approximate the main spectra. The shaded Gaussian is the satellite spectrum.
In Fig. 18, the relative intensity of the main spectrum (=+) (upward solid triangles), the satellite spectrum (=) (open circles), and the total intensity(=++) are plotted as functions of the plane-site Zn(2) concentrations for Y1237 (a) and Y1248 (b). All the , and the total intensity are normalized by . In the upper panels, all Zn impurities are assumed to be substituted for the plane-site Cu(2); = 3/2 for Y1237 and = 2 for Y1248. In the lower panels, the Zn impurities are assumed to be equally substituted both for the chain-site Cu(1) and plane-site Cu(2); = for Y1237 and Y1248.
The dashed curves are numerical calculations of Cu NQR intensity with various Zn configurations, using the binomial distribution function
| (20) |
where is the number of the th nearest neighbor (nn) Cu sites. (1-) is the probability that a plane site is occupied by a Cu ion but not a Zn ion, that is, the total Cu NQR intensity with Zn substitution. With respect to Zn configuration, the probability of finding Cu atoms can be seen in the decomposition of
| (21) | |||||
The total number of probability of finding Cu decreases as Zn concentration is increased, that is (1-). Keeping the lowest order terms of ( 1), we obtain
| (22) | |||||
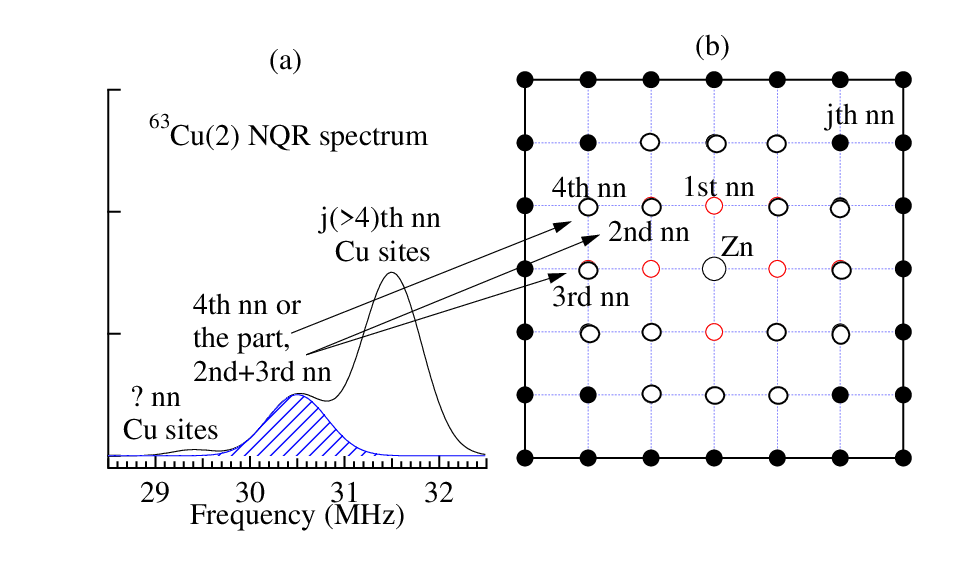
Figure 19 illustrates a 63Cu(2) NQR spectrum (a) and the CuO2 plane with a Zn impurity (b) for Zn-substituted Y1237. The shaded area in (a) is the Zn-induced Cu NQR signal. In (b), Zn locates at the center, open circles are the th nn Cu sites near Zn, and solid circles are Cu sites away from Zn. These are guides for the below calculations of NQR signal intensity.
The calculated curves on the Cu NQR intensity are in what follows. In Figs. 18, the decreasing functions as increasing are
These are the probability of finding the Cu atoms with all Cu atoms in their 1st nn positions (1), in their 12 neighboring (up-to 3rd nn) positions (2), and in their 20 neighboring (up-to 4th nn) positions (3). In other words, the diminished Cu NQR signals come from the Cu atoms with at least one Zn atom in their 1st nn positions (the 1st nn wipeout effect) (1), in their up-to 3rd nn positions (wipeout effect up to the 3rd nn sites) (2), and in their up-to 4th nn positions (wipeout effect up to the 4th nn sites) (3).
In Fig. 18, the increasing functions as increasing are
These are the probability of finding the Cu atoms with one Zn atom in their 4th nn positions or in the 2nd and 3rd nn positions (4), and in their (=1, 2, 3)th nn positions (5).
In the upper panel of Fig. 18, the Zn-doping dependence of the main intensity for Y1237 (0.017) and Y1248 (0.022) is close to that of the case (3) within the experimental accuracy, where the Cu sites located up to the 3rd nn from Zn are unobservable (wipeout). The Zn doping dependence of the total intensity for Y1237 (0.017) and Y1248 (0.022) is close to that of the case (2), where the Cu sites located up to the 4th nn from Zn are unobservable (wipeout). For Y1237, the satellite signal is close to either of the Cu site at the 4th nn from Zn or the Cu sites at the 2nd and 3rd nn from Zn [the case (4)]. For 0.017, the former assignment is consistent with those to the total and the main signals, whereas for =0.033, the latter is consistent with those to the total and the main ones. For Y1248, the satellite signal is close to the Cu site at the 1st, 2nd, or 3rd nn from Zn [the case (5)]. However, this is inconsistent with the wipeout effect on the total intensity up to the 3rd nn. Thus, the satellite resonance of Y1248 may arise from the fraction of the Cu site at the 4th nn from Zn.
The different assignment of the satellite signal from the above ItohZn is reported in WilliamsCu, where the satellite is assigned to the 1st nn Cu site near Zn. The point that the satellite comes from Zn-neighbhor some Cu sites is consistent with each other. The wipeout effect on the Cu NQR main signals and the growth of the Zn-induced Cu satellite signals indicate that the satellite but not the main signal involves the Zn-neighbor Cu nuclei. However, another site assignment is proposed from theoretical calculation using cluster model, where the higher frequency side of the main Cu NQR signal involves the 1st nn Cu sites and the satellite signal is assigned to the 2nd nn Cu site to Zn Meier. No wipeout effect is supposed. The actual Cu NQR spectrum does not consist of sharp split lines but rather broad bands. That is a reason which makes it difficult to assign the signals.
IV.5 Cu(2) NUCLEAR SPIN-LATTICE RELAXATION TIME NEAR Zn
The substitution of Zn impurity for Cu site broadens the Cu NQR spectrum and induces the low frequency satellite signals. Nuclear spin-lattice relaxation results from spin fluctuations through local nuclear sites in a real space Moriya0. We are concerned about frequency distribution of Cu nuclear spin-lattice relaxation time and the temperature dependence. The detailed measurements of frequency dependence of Cu nuclear spin-lattice relaxation curves revealed that the spin fluctuations depend on the distance from Zn impurity.
Figure 20 shows and of the satellite and main signals as functions of temperature for Zn-substituted Y1248, respectively ItohZn; Itoh3. The relaxation rates were estimated by using eq.(18). The main signals have both components of and , whereas the satellite signals have a single component of . For Y1237, the satellite signals have both components ItohZn. The difference in between Y1237 and Y1248 is associated with the degree of underlying magnetic correlation and the size of the pseudo spin-gap.

In the superconducting state, increases as temperature is decreased. The difference in the temperature dependence of between the main and the satellite signals is marked even above . The main above about 100 K decreases with Zn substitution. For low Zn concentration, the pseudo spin-gap temperature is invariant, while for high Zn concentration, rapidly decreases ItohZn; Itoh3. The collapse of pseudo spin-gap suggests the occurrence of a quantum phase transition. In the underdoped regime, Zn impurity induces superconductor-insulator crossover or transition.
The Cu(2) nuclear spin-lattice relaxation time probes the in-plane antiferromagnetic dynamical spin susceptibility at an NMR/NQR frequency Shastry; MMP; MTU; Bulut and reflects homogeneity of the CuO2 plane. Relation between the Cu NQR relaxation results ItohZn; Itoh3 and the 89Y NMR results Mahajan is not straightforward.
of the satellite signal is enhanced more than that of the main signal. This is an evidence for the Zn-induced virtual bound state Balatsky; Onishi; Salkola via the locally enhanced magnetic correlation Ohashi; Ohashi1; BulutZn; Poilblanc. The difference in of the satellite from the main indicates that Zn-induced “staggered moments” persist both above and below Ohashi; Ohashi1; Ohashi2; BulutZn, where spatially extended potential scattering by Zn plays a key role Balatsky1; Xiang, and that the pseudo spin-gap effect is suppressed near Zn YanaseZn.
V NMR STUDIES OF VORTEX CORES
V.1 REDFIELD PATTERN
Not only the impurity-induced magnetism but also magnetism inside vortex cores in the mixed states of high- superconductors have attracted great interests Zhang. Localized Caroli and delocalized quasi-particle sates Volovik are induced inside the vortex cores in conventional and unconventional superconductors, respectively. Vortex core magnetism and vortex core charge have been explored from microscopic viewpoints Kishine; Ogata; HIM. By the STS techniques, scanning conductance spectra were measured around vortex cores and revealed the anomalous local density of states around the cores, indicating the existence of internal electric and magnetic structures Fischer; Nishida.

An NMR spectrum is known to show a characteristic pattern in the mixed states of type-II superconductors, that is Redfield pattern Red. This results from magnetic field distribution of quantized magnetic flux produced by local supercurrent against an external magnetic field. Quantized magnetic flux forms a triangular lattice or a square lattice. Each quantized magnetic flux has a vortex core. The magnetic flux spreads over a distance of a penetration depth , while the vortex core spreads over a distance of the superconducting coherence length ) Sonier.
At the early stage, there had been a pessimistic view that NMR technique cannot detect the Redfield pattern for high- superconductors, because of the long penetration depth . However, the problem is not whether is long or short. In general, the width of Redfield pattern is at most the lower critical field of in a dilute vortex lattice Brandt; Brandt1; Brandt2; Rigamonti. Since on spin rotation measurements indicate Sonier, the Redfield pattern can be expected for higher compounds. The problem is whether the linewidth of NMR spectrum in a normal state is sharp enough to detect additional broadening in the vortex state ZPNQR. We have a criterion of
| (30) |
where is nuclear gyromagnetic ratio.
Figure 21 illustrates internal magnetic field distribution due to quantized magnetic flux (a), Redfield pattern of NMR spectrum (b), and distribution of Knight shift due to -wave local density of states (c) ItohTL.
An external magnetic field is squeezed at the vortex core Brandt; Brandt1; Brandt2. The squeezed magnetic flux density at the core produces a higher magnetic field than an applied magnetic field, so that the shift at the nuclear site inside the core is larger than the shift in a normal state.
Local density of states of electrons recovers at the vortex cores of -wave superconductors TIM. Then, not only the distribution of an applied magnetic field but also the distribution of Knight shift due to anisotropic local density of states contributes the NNR pattern ItohTL.
Using a vortex core shift (V) 0 due to the enhanced field and a negative shift (C)0 due to the diamagnetic field, we obtain the resonance frequency inside and outside the vortex cores,
| (31) |
and
| (32) |
One should take into consideration the combined effect of magnetic flux squeezing and of the finite positive spin shift at the vortex core ItohTL.
The Redfield pattern was actually observed in type-II superconductors, e.g. vanadium Red, LiTi2O4 MItoh, and MgB2 MgB2A; MgB2B. In the high- cuprate superconductors, the Redfield patterns were also observed, e.g. by 17O NMR of optimally doped Y1237 and underdoped Y1248 Curro; Reyes; Bachman; Mitro; Kaku and 209Tl NMR of overdoped Tl2Ba2CuO6+δ (Tl2201) ( = 85 K) Mehring; Kumagai; ItohTL. The frequency distribution of in the Redfield pattern was observed for the first time by Curro et al for Y1237 Curro. This is the beginning of site-selective NMR studies of vortex core magnetism.
In passing, the evidence of static antiferromagnetic vortex cores at = 20 K and at = 2 T was reported for Tl2201 Kumagai. But, the irreversible magnetization line was identified at = 20 K and at = 2 T, and the slowing down effect of vortex melting or solidification was observed in 209Tl NMR ItohTL. From magnetic field dependence of , a direct process of overdamped motion of pancake vortices was reported to play a key role pancake. Whether the static antiferromagnetic ordering takes place inside vortex cores, one needs further studies.
As to the plane-site Cu(2) NMR, the ideal condition of eq.(30) is not satisfied for Y1237 TakigawaVL. However, in the attempts to detect the spatial distribution of antiferromagnetic spin correlation, we obtain a few results of Cu NMR studies of the vortex cores.
V.2 ZEEMAN-PERTURBED Cu NQR
Let us present Zeeman-perturbed Cu NQR studies of vortex cores for optimally doped Y1237 at a low magnetic field of = 96 mT ZPNQR. The plane-site Cu(2) NQR spectrum is known to be one of the sharpest among the reported NQR spectra of other cuprate superconductors. The Cu(2) nuclei are coupled with nearly uniaxial electric field gradients ShimizuEQQ; PenningtonEQQ. At high magnetic fields, various vortex pinning effects are observed from measurements of hysteresis curves of magnetization Erba. At low magnetic fields near , however, a large diamagnetic response is observed in any case. The vortex lattice at a low magnetic field is in a quasi-long range ordering state Koba. In the Cu NMR experiment for Y1237, the low magnetic field yields only a negligibly small Cu Knight shift TakigawaKs but is expected to cause a large diamagnetic shift.

Figure 22 shows a zero-field 63Cu NQR power spectrum at 100 K () and the Zeeman-split NQR spectra at 100 K and 10 K (). The magnetic field of = 96 mT was applied along the axis, the maximum principle axis of electric field gradients. An intervortex distance at 96 mT is about 1800 , longer than the penetration depth (0 K) = 1100-1300 Sonier. is estimated to be about 110 mT at 0 K Hc1.
Magnetic field splits the 63Cu NQR spectrum with a peak frequency into two lines with lower and higher frequency peaks ( and ) DasHahn; TakigawaLFNMR. By definition of (1+) ( = 11.285 MHz/T and the -axis Knight shift ), the transition frequencies of (=3/21/2) and (=3/21/2) are given by
One should note that involves both the Knight shift and the superconducting diamagnetic shift. From and , one can estimate the quadrupole frequency () at a magnetic field and the local magnetic field [(1+)] by
The Cu NQR spectrum at 100 K is broadened by the distribution of electric field gradients. The split 63Cu NQR lines is broadened at 10 K larger than 100 K. The local field due to the Knight shift TakigawaKs is negligible at the magnetic field of = 96 mT. Thus, the additional broadening at 10 K must be due to the superconducting diamagnetic shift and the distribution of the electric field gradient in a mixed state.

From the estimated 31.54 31.58 MHz and (0) = 31.54 MHz at 10 K, we obtain the upper limit of the field-induced quadrupole frequency
| (39) |
The low magnetic field of 96 mT does not enhance the vortex charge, compared with that of 9.4 T VCKuma. There is no robust evidence of vortex charging effect on NQR frequency beyond the experimental accuracy.
Figure 23(a) shows the frequency dependences of the 63Cu nuclear spin-lattice relaxation rate divided by temperature 1/ at = 10 and 5 K in the Zeeman-perturbed 63Cu(2) NQR spectrum of (right axis). Above , 1/ shows no appreciable frequency dependence, whereas below , it shows a strong dependence. This is an evidence for the site-selective measurement of in the Zeeman-split NQR spectrum and for the less effect of nuclear spin diffuison.
The frequency dependence of 1/ is similar to those of the plane-site 17O(2, 3) and the apical 17O(4) at high magnetic fields of = 9-37 T Curro; Mitro. The plane-site Cu directly probes the in-plane antiferromagnetic correlation. The frequency dependence of 1/ is primarily explained by Doppler shift in quasiparticle excitation spectrum around the vortex cores TIM; Morr. The supercurrent around a vortex core induces Doppler shift in the local quasiparticle energy spectrum deGennes. Thus, the frequency dependence of 1/, similar to that of the high field 1/, indicates the importance of the Doppler shift in quasiparticle energy spectrum and the absence of the static antiferromagnetic vortex cores at 96 mT.
Figure 23(b) shows 1/ as a function of temperature across the split NQR spectrum of and at zero field NQR. The signals at 30.4-30.6 MHz and at 29.5 MHz in the split NQR spectrum come from the nuclei close to the saddle points and close to the vortex cores, respectively. The dashed line indicates 1/ of -wave pairing. The temperature dependence of 1/ at each site can be understood primarily by the spatial dependence of the local density of states with the Dopple shift TIM. The minimum of 1/ at 10 K for nuclei at 29.5 MHz is not understood simply by the local density of states.
Two theoretical explanations have been proposed. One is the competition mechanism in the scattering of quasi-particle and antiferromagnetic spin fluctuations Morr. The other is the mismatch effect of angular dependent local density of states around a vortex core and the geometry of magnetic flux lattice Knapp
In the presence of a supercurrent, the local antiferromagnetic spin fluctuations have two fold contributions to 1/: one is a scattering of a Bogoliubov particle at a spin-fermion vertex, and the other is simultaneous creation or annihilation of two Bogoliubov particles Morr. Competition of two processes yields minimum behavior 1/ as functions of temperature and frequency.
The periodicity of vortex lattice, i.e. triangular or square lattice, depends on the magnitude of an external magnetic field . Mismatching between the magnetic flux shape and the local density of states of the quasi-particles yields the characteristic dependence of temperature and frequency Knapp.
VI CHEMICAL PRESSURE, PHYSICAL PRESSURE, AND SITE DISORDER
It has been believed that the site disorder out of CuO2 planes does not cause serious damage to the electronic states of the CuO2 planes. However, the reason why chemical pressure effect on and the electronic states by element substitution is not the same as the physical pressure one has been often ascribed to the disorder effect. The relation among site disorder, chemical pressure and physical pressure effects has been poorly underdtood.
Y(Ba1-xSx)2Cu4O8 with 0.40 can be synthesized Wada1. For Y1248, one can expect two effects of Sr substitution for Ba sites without change of oxygen content; one is chemical pressure and the other is crystalline potential disorder. The size of Sr2+ ion is smaller than that of Ba2+ by about 10 , so that the substituted Sr ions make local strains and decrease the volume. The lattice constants actually shrink with Sr substitution Wada1, similarly to physical pressure effect Yamada. Thus, the Sr substitution introduces crystalline potential disorder and chemical pressure to the lattice.
The effect of hydrostatic physical pressure on the spin dynamics is similar to the carrier doping effect Machi1; Machi2; Machi3: The physical pressure effects on and on the pseudo spin-gap temperature agree with the carrier doping effects for Y1248, increases Kaldis; Scholtz but decreases Machi3, as well as with doping Ca Miyatake1; Machi1.
For Y1248, the Sr substitution for Ba site scarcely increases Wada1, although the unit cell volume shrinks. Thus, one can suspect randomness effect on the actual as well as nonmagnetic impurity Zn substitution effect.

Figure 24 shows 63,65Cu NQR spectra of the plane-site Cu(2) (a) and the chain-site Cu(1) (b) for = 0.00 and 0.40 at = 4.2 K ItohYSr. For comparison, the red shaded 63,65Cu NQR spectra for a pure Y1248 under hydrostatic physical pressure of = 2.0 and 3.0 GPa are also presented Machi2. By Sr substitution for Ba site, the Cu(2) NQR spectra are shifted to higher frequencies, whereas the Cu(1) NQR spectra are shifted to lower frequencies. Since the directions of these shifts are in parallel to those under the physical pressure Zimmermann1; Machi2. However, one should note that the degree of shifts of the Cu(2) NQR spectra is different from that of Cu(1) between the Sr-substitution and the physical pressure effects Zimmermann1; Machi2. This difference indicates that local compression due to the internal pressure of Sr is different from that due to the physical pressure.
Both the line widths of Cu(1) and Cu(2) spectra are broadened by Sr substitution and then the disorder of the crystalline potential due to Sr in BaO layer. For such a broadened spectrum, one would expect an inhomogeneous local density of electron states and an inhomogeneous electron spin dynamics. However, no impurity effect on nuclear spin-lattice relaxation was observed ItohYSr. Both Cu(1) and Cu(2) nuclear spin-lattice relaxation curves were single exponential functions. Also, no Curie term in uniform spin susceptibility was observed ItohYSr. Theses results are sharply in contrast to the effects of in-plane impurity substitution. It remains to be a mystery why the chemical pressure of Sr substitution does not increase .
VII CONCLUSION
Local electronic states near the in-plane impurities and inside the vortex cores have been studied by Cu NQR and NMR techniques for high- superconductors Y123y and Y1248. The characteristic NQR and NMR spectra and the frequency distribution of Cu nuclear spin-lattice relaxation time provide us with rich information of magnetic correlation near Zn impurity and inside the vortex cores.
Acknowledgements.
I would like to thank Y. Ohashi, M. Ogata and Y. Yanase for their stimulating discussions of theoretical treatments, and T. Machi, N. Watanabe, S. Adachi, C. Michioka, and K. Yoshimura for their collaboration for a long time.References
- (1) Slichter C. P. Principles of Magnetic Resonance 3rd; Springer Series in Solid-Sate Sciences 1; Springer-Verlag: Tokyo, 1990.
- (2) Slichter C. P. Journal of Superconductivity and Novel Magnetism 2006, 19, 159-166.
- (3) Marshall W.; Lowde R. D. Rep. Prog. Phys. 1968, Vol. 31, 705-775.
- (4) Narath A. in Magnetism; Rado G. T.; Suhl H.; Ed.; Academic Press: New York, 1973; Vol. 5, pp 149-183.
- (5) Butler M.; Jaccarino V.; Kaplan N.; Guggenheim H. J. Phys. Rev. 1970, B1, 3058-3083.
- (6) Alloul H. Physica 1977, B86-88, 449-454.
- (7) Grüner G.; Minier M. Adv. in Phys. 1977, 26, 231-284.
- (8) Rossat-Mignod J.; Regnault L. P.; Bourgers P.; Vettier C.; Burlet P.; Henry J. Y. Physica Scripta 1992, Vol. T45, 74-80.
- (9) Mali M.; Brinkmann D.; Pauli L.; Roos J.; Zimmermann H.; Hulliger J. Phys. Lett. 1987, A124, 112-116.
- (10) Zimmermann H.; Mali M.; Brinkmann D.; Karpinski J.; Kaldis E.; Rusiecki S. Physica 1989, C159, 681-688.
- (11) Pennington C. H.; Slichter C. P. in Physical Properties of High Temperature Superconductors; Ginsberg, D. M.; Ed.; World Scientific Publishing Co.: New Jersey, 1998; Vol. 2, pp 269-367.
- (12) Berthier C.; Julien M. H.; Horvatic M.; Berthier Y.; J. Phys. I France 1996, Vol. 6, 2205-2236.
- (13) Rigamonti A.; Borsa F.; Carretta P. Rep. Prog. Phys. 1998, 61, 1367-1439.
- (14) Balatsky A. V.; Vekhter I.; Zhu J. X. Rev. Mod. Phys. 2006, 78, 373-433.
- (15) Fischer Ø.; Kugler M.; Maggio-Aprile I.; Berthod C.; Renner C. Rev. Mod. Phys. 2007, 79, 353-419.
- (16) Auerbach A.; Arovas D. P.; Phys. Rev. 1988, B38, 316-332.
- (17) Chakravarty S.; Halperin B. I..; Nelson D. R. Phys. Rev. 1989, B39, 2344-2371.
- (18) Takahashi M. Phys. Rev. 1989, B40, 2494-2501.
- (19) Rossat-Mignod J.; Regnault L. P.; Vettier C.; Bourgers P.; Burlet P.; Bossy J.; Henry J. Y.; Lapertot G. Physica 1991, C185-189, 86-92.
- (20) Tsuda T.; Ohno T.; Yasuoka H. J. Phys. Soc. Jpn. 1992, 61, 2109-2113.
- (21) Hanzawa K. J. Phys. Soc. Jpn. 1994, 63, 264-270.
- (22) Imai T.; Slichter C. P.; Yoshimura K.; Kosuge K. Phys. Rev. Lett. 1993, 70, 1002-1005.
- (23) Pozzi R.; Mali M; Brinkmann D.; Erb A. Phys. Rev. 1999, B60, 9650-9661.
- (24) Pozzi R.; Mali M; Matsumura M.; Raffa F.; Roos J.; Brinkmann D. Phys. Rev. 1997, B56, 759-765.
- (25) Fujiyama S.; Takigawa M.; Suzuki T.; Yamada N.; Horii S.; Yamada Y. Phys. Rev. 2003, B 67, 060404-1-4.
- (26) Thurber K. R.; Imai T.; Saitoh T.; Azuma M.; Takano M.; Chou F. C. Phys. Rev. Lett. 2000, 84, 558-561.
- (27) Machi T.; Tomeno I.; Miyatake T.; Koshizuka N.; Tanaka S.; Imai T.; Yasuoka H. Physica 1991, C173, 32-36.
- (28) Chubukov A. V.; Sachdev S.; Ye J. Phys. Rev. 1994, B49, 11919- 11961.
- (29) Sandvik A. W.; Scalapino D. J. Phys. Rev. Lett. 1994, 72, 2777-2780.
- (30) Ohara K.; Yosida K.; J. Phys. Soc. Jpn. 1989, 58, 2521- 2530.
- (31) Moriya T.; Takahashi Y.; Ueda K. J. Phys. Soc. Jpn. 1990, 59, 2905-2915.
- (32) Hunt A. W.; Singer P. M.; Thurber K. R.; Imai T. Phy. Rev. Lett. 1999, 82, 4300-4303.
- (33) Hunt A. W.; Singer P. M.; Cederström A. F.; Imai T. Phy. Rev. 2001, B64, 134525-1-25.
- (34) Julien M.-H.; Borsa F.; Carretta P.; Horvatić M.; Berthier C.; Lin C. T. Phy. Rev. Lett. 1999, 83, 604 - 607.
- (35) Singer P. M.; Imai T. Phy. Rev. Lett. 2002, 88, 187601-1-4.
- (36) Alloul H.; Ohno T.; Mendels P. Phy. Rev. Lett. 1989, 63, 1700-1703.
- (37) Miyake K.; Narikiyo O. J. Phys. Soc. Jpn. 1994, 63, 3821-3837.
- (38) Narikiyo O.; Miyake K. J. Phys. Soc. Jpn. 1994, 63, 4169-4175.
- (39) Imada M.; Fujimori A.; Tokura Y. Rev. Mod. Phys. 1998, 70, 1039-1263.
- (40) Takigawa M.; Reyes A. P.; Hammel P. C.; Thompson J. D.; Heffner R. H.; Fisk Z.; Ott K. C. Phys. Rev. 1991, B43, 247-257.
- (41) Rice T. M.; Mila F.; Zhang F. C. Phil. Trans. R. Soc. Lond. 1991, A334, 459-471.
- (42) Imai T. J. Phys. Soc. Jpn. 1990, 59, 2508-2521.
- (43) Takigawa M.; Motoyama N.; Eisaki H.; Uchida S. Phys. Rev. 1998, B57, 1124-1140.
- (44) Yokoyama T.; Mitsui T.; Kato M.; Yoshimura K.; J. Phys. Chem. Solids 2002, 63, 1111-1114.
- (45) Rykov A. I..; Yasuoka H.; Ueda Y. Physica 1995, 247, 327-339.
- (46) Riesemeier H.; Gätrtner S.; Lütders K.; Schmalz M.; Schötllhorn R.; J. Phys. Chem. Solids 1994, 55, 613-615.
- (47) Imai T.; Yasuoka H.; Shimizu T.; Ueda Y.; Yoshimura K.; Kosuge K. Physica 1989, C162-164, 169-170.
- (48) Yasuoka H.; Imai T.; Shimizu T. in Strong Correlation and Superconductivity; Springer Series in Solid-Sate Sciences 89; Springer-Verlag: Berlin, 1989, pp 254-261.
- (49) Warren, Jr. W. W.; Walstedt R. E.; Brennert G. F.; Cava R. J.; Tycko R.; Bell R. F.; Dabbagh G.; Phys. Rev. Lett. 1989, 62, 1193-1196.
- (50) Horvatić M.; Ségransan P.; Berthier C.; Berthier Y.; Butaud P.; Henry J. Y.; Couach M.; Chaminade J. P. Phys. Rev. 1989, B 39 7332-7335.
- (51) Moriya T. Prog. Theor. Phys. 1956, 16, 23-43; 1956, 16, 641-657; 1962, 28, 371-400.
- (52) Ito T.; Takenaka K.; Uchida S. Phys. Rev. Lett. 1993, 70, 3995-3998.
- (53) Matsumura M.; Sakamoto Y.; Fushihara T.; Itoh Y.; Yamagata H. J. Phys. Soc. Jpn. 1995, 64, 721-724.
- (54) Auler T.; Horvatić M.; Gillet J. A.; Berthier C.; Berthier Y.; Ségransan P.; Henry J . Y. Phys. Rev. 1997, B56, 11294-11298.
- (55) Yamamoto A.; Hirose K.; Itoh Y.; Kakeshita T.; Tajima S. Physica 2005, C421, 1-9; 2005, C432, 315.
- (56) Williams G. V. M.; Krämer S.; Mehring M. Phys. Rev. 2001, B63, 104514-1-5.
- (57) Itoh Y.; Matsumura M.; Yamagata H.; Miyamoto H. J. Phys. Soc. Jpn. 1996, 65, 695-698.
- (58) Itoh Y.; Matsumura M.; Yamagata H. J. Phys. Soc. Jpn. 1998, 67, 3018-3020.
- (59) Itoh Y.; Machi T.; Adachi S.; Tokiwa-Yamamoto A.; Tanabe K.; Koshizuka N. in Advances in Superconductivity XI; Proceedings of the 11th International Symposium on Superconductivity (ISS ’98); Springer-Verlag: Tokyo, 1999, pp 61-64.
- (60) Millis A. J.; Monien H. Phys. Rev. Lett. 1993, 70, 2810-2813.
- (61) Itoh Y.; Machi T.; Fukuoka A.; Tanabe K.; Yasuoka H. J. Phys. Soc. Jpn. 1996, 65, 3751-3753.
- (62) Bobroff J.; Alloul H.; Mendels P.; Viallet V.; Marucco J.-F.; Colson D. Phys. Rev. Lett. 1997, 78, 3757-3760.
- (63) Itoh Y.; Tokiwa-Yamamoto A.; Machi T.; Tanabe K. J. Phys. Soc. Jpn. 1998, 67, 2212-2214.
- (64) Kotliar G. Phys. Rev. 1988, B37, 3664-3666.
- (65) Suzumura Y.; Hasegawa Y.; Fukuyama H. J. Phys. Soc. Jpn. 1988, 57, 2768-2778.
- (66) Tanamoto T.; Kohno H.; Fukuyama H. J. Phys. Soc. Jpn. 1992, 61, 1886-1890.
- (67) Yanase Y.; Yamada K. J. Phys. Soc. Jpn. 2001, 70, 1659-1680.
- (68) Ohashi Y.; Shiba H. J. Phys. Soc. Jpn. 1993, 62, 2783-2802.
- (69) Scalapino D. J. Rev. Mod. Phys. 1995, 250, 329-365.
- (70) Millis A. J.; Sachdev S.; Varma C. M. Phys. Rev. 1988, B37, 4975-4986.
- (71) Balian R.; Werthamer N. R. Phys. Rev. 1963, 131, 1553-1564.
- (72) Maekawa S.; Isawa Y.; Ebisawa H. Jpn. J. Appl. Phys. 1987, 26, L771-L773.
- (73) Openov L. A. Phys. Rev. 1998, B58, 9468-9478.
- (74) Salkola M. I.; Balatsky A. V.; Schrieffer J. R. Phys. Rev. 1997, B55, 12648-12661.
- (75) Kilian R.; Krivenko S.; Khaliullin G.; Fulde P. Phys. Rev. 1999, B59, 14432-14439.
- (76) Itoh Y.; Adachi S.; Machi T.; Ohashi Y.; Koshizuka N. Phys. Rev. 2002, B66, 134511-1-4.
- (77) Borkowski L. S.; Hirschfeld P. J. Phys. Rev. 1994, B49, 15404-15407.
- (78) Fehrenbacher R.; Norman M. R. Phys. Rev. 1994, B50, 3495-3498.
- (79) Arberg P.; Carbotte J. P. Phys. Rev. 1994, B50, 3250-3255.
- (80) Kitaoka Y.; Ishida K.; Asayama K. J. Phys. Soc. Jpn. 1994, 63, 2052-2056.
- (81) Hotta T. J. Phys. Soc. Jpn. 1993, 62, 274-280.
- (82) Adachi S.; Itoh Y.; Machi T.; Kandyel E.; Tajima S.; Koshizuka N. Phys. Rev. 2000, B61, 4314-4318.
- (83) Adachi S.; Kasai C.; Tajima S.; Tanabe K.; Fujihara S.; Kimura T. Physica 2001, C351, 323-328.
- (84) Itoh Y.; Machi T.; Watanabe N.; Koshizuka N. Physica 2001, C69, 357-360.
- (85) Miyatake T.; Yamaguchi K.; Takata T.; Koshizuka N.; Tanaka S. Phys. Rev. 1991, B44, 10139-10145.
- (86) Watanabe N.; Koshizuka N.; Seiji N.; Yamauchi H. Physica 1994, C234, 361-367.
- (87) Xiao G.; Cieplak M. Z.; Xiao J. Q.; Chien C. L. Phys. Rev. 1990, B42, 8752-8755.
- (88) Liang R.; Nakamura T.; Kawaji H.; Itoh M.; Nakamura T. Physica 170, C170, 307-314.
- (89) Kohori Y.; Shiba H; Oda Y; Kitaoka Y; Kohara T.; Asayama K. J. Phys. Soc. Jpn. 1988, 57, 2905-2907.
- (90) Monthoux P.; Pines D. Phys. Rev. 1994, B49, 4261-4278.
- (91) Ishida K.; Kitaoka Y.; Ogata N.; Kamino T.; Asayama K. Cooper J. R.; Athanassopoulou N. J. Phys. Soc. Jpn. 1993, 62, 2803-2818.
- (92) Poilblanc D.; Scalapino D. J.; Hanke W. Phys. Rev. Lett. 1994, 72, 884-887.
- (93) Balatsky A. V.; Salkola M. I.; Rosengren A. Phys. Rev. 1995, B51, 15547-15551.
- (94) Onishi Y.; Ohashi Y.; Shingaki Y.; Miyake K. J. Phys. Soc. Jpn. 1996, 65, 675-678.
- (95) Salkola M. I.; Balatsky A. V.; Scalapino D. J. Phys. Rev. Lett. 1996, 77, 1841-1844.
- (96) Bulut N. Physica 2001, C363, 260-284.
- (97) Ohashi Y. J. Phys. Soc. Jpn. 2000, 69, 2977-2992.
- (98) Ohashi Y. J. Phys. Soc. Jpn. 2001, 70, 2054-2060; 2002, 71, 670.
- (99) Ohashi Y. Phys. Rev. 2002, B66, 054522-1-8.
- (100) Pan S. H.; Hudson E. W.; Lang K. M.; Eisaki H.; Uchida S.; Davis J. C. Nature 2000, 403, 746-750.
- (101) Hudson E. W.; Lang K. M.; Madhavan V.; Pan S. H.; Eisaki H.; Uchida S.; Davis J. C. Nature 2001, 411, 920-924.
- (102) Yamagata H.; Inada K.; Matsumura M. Physica 1991, C185-189, 1101-1102.
- (103) Alloul H.; Bobroff J.; MacFarlane A.; Mendels P.; Rullier-Albenque F. J. Phys. Soc. Jpn. 2000, 69, Suppl. B. 114-121.
- (104) Itoh Y.; Machi T.; Watanabe N.; Koshizuka N. J. Phys. Soc. Jpn. 1999, 68, 2914-2917.
- (105) Itoh Y.; Machi T.; Watanabe N.; Koshizuka N. J. Phys. Soc. Jpn. 2001, 70, 644-647.
- (106) Itoh Y.; Machi T.; Watanabe N.; Adachi S.; Koshizuka N. J. Phys. Soc. Jpn. 2001, 70, 1881-1884.
- (107) Itoh Y.; Machi T.; Watanabe N.; Adachi S.; C. Kasai.; Koshizuka N. Physica 2002, C378-381, 203-207.
- (108) Itoh Y.; Machi T.; Kasai C.; Adachi S.; Koshizuka N.; Murakami M. Physica 2003, C392-396, 166-170.
- (109) Itoh Y.; Machi T.; Kasai C.; Adachi S.; Koshizuka N.; Murakami M. Phys. Rev. 2003, B67, 064516-1-8.
- (110) Mahajan A. V.; Alloul H.; Collin G.; Marucco J. F. Phys. Rev. Lett. 1994, 72, 3100-3103.
- (111) Mahajan A. V.; Alloul H.; Collin G.; Marucco J. F. Eur. Phys. J. 2000, B13, 457-475.
- (112) Bobroff J.; MacFarlane W. A.; Alloul H.; Mendels P.; Blanchard N.; Collin G.; Marucco J.-F. Phys. Rev. Lett. 1999, 83, 4381-4384.
- (113) MacFarlane W. A.; Bobroff J.; Alloul H.; Mendels P.; Blanchard N.; Collin G.; Marucco J.-F. Phys. Rev. Lett. 2000, 85, 1108-1111.
- (114) Bobroff J.; Alloul H.; MacFarlane W. A.; Mendels P.; Blanchard N.; Collin G.; Marucco J.-F. Phys. Rev. Lett. 2001, 86, 4116- 4119.
- (115) Ouazi S.; Bobroff J.; H. Alloul H.; MacFarlane W. A. Phys. Rev. 2004, B70, 104515-1-8.
- (116) Ouazi S.; Bobroff J.; H. Alloul H.; Tacon M. Le; Blanchard N.; Collin G.; Julien M. H.; Horvatić M.; Berthier C. Phys. Rev. Lett. 2006, 96, 127005-1-4.
- (117) Kakurai K.; Shamoto S.; Kiyokura T.; Sato M.; Tranquada J. M.; Shirane G. Phys. Rev. 1993, B48, 3485- 3490.
- (118) Sidis Y.; Bourges P.; Hennion B.; Regnault L. P.; Villeneuve R.; Collin G.; Marucco J.-F. Phys. Rev. 1996, B53, 6811- 6818.
- (119) Kobayashi Y.; Miyashita T.; Ambai M.; Fukamachi T.; Sato M. J. Phys. Soc. Jpn. 2001, 70, 1133-1136.
- (120) Walstedt R. E.; Bell R. F.; Schneemeyer L. F.; Waszczak J. V.; Warren Jr. W. W.; Dupree R.; Gencten A. Phys. Rev. 1993, B48, 10646-10649.
- (121) Julien M.-H.; Fehér T.; Horvatić M.; Berthier C.; Bakharev O. N.; Ségransan P.; Collin G.; Marucco J.-F. Phys. Rev. Lett. 2000, 84, 3422- 3425.
- (122) Williams G. V. M.; Krämer S. Phys. Rev. 2001, B64, 104506-1-10.
- (123) McHenry M. R.; Silbernagel B. G.; Wernick J. H. Phys. Rev. Lett. 1971, 27, 426-429.
- (124) McHenry M. R.; Silbernagel B. G.; Wernick J. H. Phys. Rev. 1972, B5, 2958-2972.
- (125) Sung C. C.; Arnold L. G. Phys. Rev. 1973, B7, 2095-2102.
- (126) Blumberg W. E. Phys. Rev. 1960, 119, 79-84.
- (127) Lowe I. J.; Tse D. Phys. Rev. 1968, 166, 279-291.
- (128) Tomimoto K.; Terasaki I.; Rykov A. I.; Mimura T.; Tajima S. Phys. Rev. 1999, B 60, 114-117.
- (129) Demler E.; Hanke W.; Zhang S. C. Rev. Mod. Phys. 2004, 76, 909-974.
- (130) Kohno H.; Fukuyama H.; Sigrist M. J. Phys. Soc. Jpn. 1999, 68, 1500-1503.
- (131) Hücker M.; Kataev V.; Pommer J.; Harrab J.; Hosni A.; Pflitsch C.; Gross R.; Büchner B. Phys. Rev. 1999, B59, R725-728.
- (132) Machi T.; Kato I.; Hareyama R.; Watanabe N.; Itoh Y.; Koshizuka N.; Arai S.; Murakami M. Physica 2003, C388-389, 233-234.
- (133) Bersier C.; Renold S.; Stoll E. P.; Meier P. F. Phys. Rev. 2005, 72, 2245141-1-8.
- (134) Shastry B. S. Phys. Rev. Lett. 1989, 63, 1288-1291.
- (135) Millis A. J.; Monien H.; Pines D. Phys. Rev. 1990, B42, 167-178.
- (136) Bulut N.; Hone D. W.; Scalapino D. J.; Bickers N. E. Phys. Rev. 1990, B41, 1797-1811.
- (137) Balatsky A. V.; Rosengren A.; Altshuler B. L. Phys. Rev. Lett. 1994, 73, 720-723.
- (138) Xiang T.; Wheatley J. M. Phys. Rev. 1995, B51, 11721-11727.
- (139) Yanase Y. J. Phys. Soc. Jpn. 2006, 75, 124715-1-11.
- (140) Caroli C.; de Gennes P. G.; Matricon J. Phys. Lett. 1964, 9, 307-309.
- (141) Volovik G. E. Sov. Phys. JETP Lett. 1993, 58, 469-473.
- (142) Kishine J.; Lee P. A.; Wen X. G. Phys. Rev. Lett. 2001, 86, 5365-5368.
- (143) Ogata M. Int. J. Mod. Phys. 1999, B13, 3560-3565.
- (144) Hayashi N.; Ichioka M.; Machida K. J. Phys. Soc. Jpn. 1998, 67, 3368-3371.
- (145) Matsuba K.; Yoshizawa S.; Mochizuki Y.; Mochiku T.; Hirata K.; Nishida N. J. Phys. Soc. Jpn. 2007, 76, 063704-1-4.
- (146) Redfield A. G. Phys. Rev. 1967, 162, 367-374.
- (147) Sonier J. E. ; Brewer J. H.; Kliefl R. F. Rev. Mod. Phys. 2000, 72, 769-811.
- (148) Brandt E. H. Phys. Rev. Lett. 1997, 78, 2208-2211.
- (149) Brandt E. H. Phys. Rev. 1988, B37, 2349-2352.
- (150) Brandt E. H.; Seeger A. Adv. Phy., 1986, 35, 189-236.
- (151) Itoh Y.; Michioka C.; Yoshimura K.; Ueda Y. J. Phys. Soc. Jpn. 2006, 75, 013711-1-4.
- (152) Itoh Y.; Michioka C.; Yoshimura K.; Hayashi A.; Ueda Y. J. Phys. Soc. Jpn. 2005, 74, 2404-2407.
- (153) Takigawa M.; Ichioka M.; Machida K. J. Phys. Soc. Jpn. 2000, 69, 3943-3954.
- (154) Itoh M.; Hasegawa Y.; Yasuoka H.; Ueda Y.; Kosuge K. Physica 1989, C157, 65-71.
- (155) Papavassiliou G.; Pissas M.; Fardis M.; Karayanni M.; Christides C. Phys. Rev. 2002, 65, 012510-1-4.
- (156) Chen B.; Sengupta P.; Halperin W. P.; Sigmund E. E.; Mitrovi V. F., Lee M. H.; Kang K. H.; Mean B. J.; Kim J. Y.; Cho B. K. New J. of Phys. 2006, 8, 274-1-10.
- (157) Curro N. J.; Milling C.; Haase J.; Slichter C. P. Phys. Rev. 2000, B62, 3473-3479.
- (158) Reyes A. P.; Tang X. P.; Bachman H. N.; Halperin W. P.; Martindale J. A.; Hammel P. C. Phys. Rev. 1997, B 55 (1997) 14737-14740.
- (159) Bachman H. N.; Reyes A. P.; Mitrovic V. F.; Halperin W. P.; Kleinhammes A.; Kuhns P.; Moulton W. G. Phys. Rev. Lett. 1998, 80, 1726-1729.
- (160) Mitrovi V. F.; Sigmund E. E.; Eschrig M.; Bachman H. M.; Halperin W. P.; Reyes A. P.; Kuhns P.; Moulton W. G. Nature (London) 2001, 413, 501-504.
- (161) Kakuyanagi K.; Kumagai K.; Matsuda Y. Phys. Rev. 2002, B65, 060503-1-4.
- (162) Mehring M.; Hentsch F.; Mattausch Hj.; Simon A. Solid State Commun. 1990, 75, 753-757.
- (163) Kakuyanagi K.; Kumagai K.; Matsuda Y.; Hasegawa M. Phys. Rev. Lett. 2003, 90, 197003-1-4.
- (164) Bulaevskii L. N.; Kolesnikov N. N.; Schegolev I. F.; Vyaselev O. M. Phys. Rev. Lett. 1993, 71, 1891-1894.
- (165) Takigawa M.; Hammel P. C.; Heffner R. H.; Fisk Z.; Thompson J. D.; Maley M. Physica, 1989, 162-164 175-176.
- (166) Shimizu T.; Yasuoka H.; Imai T.; Tsuda T.; Takabatake T.; Nakazawa Y.; Ishikawa M. J. Phys. Soc. Jpn. 1988, 57, 2494-2505.
- (167) Pennington C. H.; Durand D. J.; Zax D. B.; Slichter C. P.; Rice J. P.; Ginsberg D. M. Phys. Rev. 1988, B37, 7944-7947.
- (168) Erb A.; Manuel A.A.; Dhalle M.; Marti F.; Genoud J.-Y.; Revaz B.; Junod A.; Vasumathi D.; Ishibashi S.; Shukla A.; Walker E.; Fischer .; Flkiger R.; Pozzi R.; Mali M.; Brinkmann D. Solid State Commun. 1999, 112, 245-249.
- (169) Shibata K.; Nishizaki T.; Sasaki T.; Kobayashi N. Phys. Rev. 2002, B66, 214518-1-7 .
- (170) Takigawa M.; Hammel P. C.; Heffner R. H.; Fisk Z. Phys. Rev. 1989, B39, 7371-7374.
- (171) Liang R.; Dosanjh P.; Bonn D. A.; Hardy W. N.; Berlinsky A. J. Phys. Rev. 1994, B50, 4212-4215.
- (172) Das T. P.; Hahn E. L. in Solid State Phys. Supple. 1; Academic Press: New York and London, 1958.
- (173) Takigawa M.; Smith J. L.; Hults W. L. Phys. Rev. 1991, B44, 7764-7767.
- (174) Kumagai K.; Nozaki K.; Matsuda Y. Phys. Rev. 2001, B63, 144502-144505.
- (175) Morr D. K.; Wortis R. Phys. Rev. 2000, B61, R882-R885.
- (176) de Gennes P. G. Superconductivity of Metals and Alloys; W. A. Benjamin, Inc.: New York, 1966.
- (177) Knapp D.; Kallin C.; Berlinsky A. J.; Wortis R. Phys. Rev. 2002, B66, 144508-1-5.
- (178) Itoh Y.; Adachi S.; Machi T.; Koshizuka N. Phys. Rev., 2001, 61, 180511-1-4.
- (179) Wada T.; Sakurai T.; Suzuki N.; Koriyama S.; Yamauchi H.; Tanaka S. Phys. Rev. 1990, B41, 11 209-11213.
- (180) Yamada Y.; Jorgensen J. D.; Pei S.; Lightfoot P.; Kodama Y.; Matsumoto T.; Izumi F. Physica 1991, C173, 185-194.
- (181) Machi T.; Tomeno I.; Tai K.; Koshizuka N.; Yasuoka H. Physica 1994, C226, 227-234.
- (182) Machi T.; Kosuge M.; Koshizuka N.; Yasuoka H. in Advances in Superconductivity VII, Yamafuji K.; Morishita T.; Ed.; Springer-Verlag: Tokyo, 1994; pp 151-154.
- (183) Machi T.; Kosuge M.; Koshizuka N.; Yasuoka H. J. Magn. Magn. Mater. 1998, 177-181, 525-526.
- (184) Kaldis E.; Fischer P.; Hewat A. W.; Hewat E. A.; Karpinski J.; Rusiecki S. Physica 1989, C159, 668-680.
- (185) Scholtz J. J.; van Eenige E. N.; Wijngaarden R. J.; Griessen R. Phys. Rev. 1992, B 45, 3077-3082.
- (186) Miyatake T.; Gotoh S.; Koshizuka N.; Tanaka S. Nature (London) 1989, 341, 41-41.
- (187) Zimmermann H.; Mali M.; Mangelschots I.; Roos J.; Brinkmann D.; Karpinski J.; Rusiecki S.; Kaldis E. J. Less-Common Met. 1990, 164-165, 132-137.