Effect of excluded volume interactions on the interfacial properties of colloid-polymer mixtures
Abstract
We report a numerical study of equilibrium phase-diagrams and interfacial properties of bulk and confined colloid-polymer mixtures using grand canonical Monte Carlo simulations. Colloidal particles are treated as hard spheres, while the polymer chains are described as soft repulsive spheres. The polymer-polymer, colloid-polymer, and wall-polymer interactions are described by density-dependent potentials derived by Bolhuis and Louis [Macromolecules, 35 (2002), p.1860]. We compared our results with those of the Asakura-Oosawa-Vrij model, that treats the polymers as ideal particles. We find that the number of polymers needed to drive the demixing transition is larger for the interacting polymers, and that the gas-liquid interfacial tension is smaller. When the system is confined between two parallel hard plates, we find capillary condensation. Compared with the AOV model, we find that the excluded volume interactions between the polymers suppress capillary condensation. In order to induce capillary condensation, smaller undersaturations and smaller plate separations are needed in comparison with ideal polymers.
I Introduction
Mixtures of colloids and polymers Poon 2002; Tuinier et al. 2003; Brader et al. 2003 are simple model systems that have been studied extensively in the past years. Provided the size and the number of polymers are sufficiently high, such mixtures can phase-separate into a colloidal gas phase that is poor in colloids and rich in polymers, and a colloidal liquid phase that is rich in colloids and poor in polymers. While it is well established that the interactions between sterically stabilized colloidal particles are well described by the hard sphere potential, Pusey and van Megen 1986 the interactions between the polymers in the mixture can be in general very complicated. Nevertheless, if we consider the case of flexible polymer chains in a “good solvent” conditions, we can assume that the excluded volume interactions between the chains are small and that the chains cannot penetrate the colloidal particles. The mechanism behind the demixing transition is then easily explained. In Fig. 1(a), we illustrate the mixture of spherical colloids and polymer chains. Around each colloid there is a depletion region prohibited to the polymers due to the hard-core interactions. If two colloids approach each other, so that two depletion zones overlap there is an increase in free volume for the polymer chains, i.e. an increase in entropy. The increase in entropy can be described by an effective attractive interaction between the colloidal particles. A similar depletion mechanism occurs between a hard wall and the colloidal particles. If the polymers do not adsorb at the wall they are excluded from a region close to the wall. The overlap between the depletion zone at the wall and the depletion zone of one colloid induces an increase in free volume and, hence, in entropy.
One particular simple model for colloid-polymer mixtures is the Asakura-Oosawa-Vrij (AOV) model Asakura and Oosawa 1954; Asakura and Oosawa 1958; Vrij 1976 that describes the polymer chains as spherical particles with a radius equal to the radius of gyration of the polymer. Furthermore, polymer spheres can freely overlap, while they are excluded from a centre of mass distance from the colloidal particles. The AOV model has been studied extensively in the past years, and it was shown that it describes qualitatively the bulk Gast et al. 1983; Lekkerkerker et al. 1992; Meijer and Frenkel 1994; Dijkstra et al. 1999; de Hoog and Lekkerkerker 1999; Chen et al. 2000; Schmidt et al. 2000; Schmidt et al. 2002; Vink and Horbach 2004 and interfacial phase behavior Brader et al. 2001; Brader et al. 2002; Dijkstra and van Roij 2002; Wijting et al. 2003a; Aarts et al. 2003; Wijting et al. 2003b of mixtures of colloids and polymers. A similar level of agreement was found for the interfacial tension of the gas-liquid Vink and Horbach 2004; Aarts 2005; Fortini et al. 2005a and wall-fluid interfaces, Wessels et al. 2004a; Wessels et al. 2004b; Fortini et al. 2005a and for the phase behavior of confined systems. Schmidt et al. 2003a; Lee et al. 2003; Schmidt et al. 2004a; Aarts and Lekkerkerker 2004; Fortini et al. 2006; Vink et al. 2006a; Vink et al. 2006b; Virgiliis et al. 2007
The quantitative discrepancies between experimental results and the AOV model results can arise from a number of reasons, like non-ideal solvent conditions, Schmidt and Denton 2002 colloid-induced polymer compression, Denton and Schmidt 2002 effect of charges on the colloidal surface, Denton and Schmidt 2005; Fortini et al. 2005b or polymer excluded volume interactions. In this article, we will concentrate on the latter aspect. The simplest inclusion of polymer interactions was done by introducing a step function interaction between the polymers, i.e. an energy penalty for the overlaps of two polymers. The step potential was used to study the bulk phase diagram and interfacial tension Schmidt et al. 2003b; Wessels et al. 2004a; Vink and Schmidt 2005 as well as the stability of the floating liquid phase in sedimenting colloid-polymer mixtures Schmidt et al. 2004b with a geometry-based density functional theory (DFT). This approach gives results that are in better agreement with experiments when compared against the AOV model, but the height of the step potential must be introduced as an additional free parameter. Furthermore, we expect the polymer-colloid interaction to be modified as well when considering excluded volume interactions between polymers. Other theoretical approaches have been developed to study the effect of polymer interactions in colloid-polymer mixtures. Aarts et al. 2002 extended the free volume theory Lekkerkerker et al. 1992 to include polymer interactions, and studied the gas-liquid interfacial tension with the square gradient approximation approach. Brader and Evans 2000; Aarts et al. 2002; Moncho-Jorda et al. 2003; Aarts et al. 2004 A one-component perturbative DFT that includes excluded volume interactions that uses the approach of Ref. Louis et al. 2002 was developed by Moncho-Jorda et al. 2005 to study confined systems and the gas-liquid tension.
Another approach is to describe the polymers as soft spheres, Louis et al. 2000; Bolhuis et al. 2001; Bolhuis and Louis 2002 with effective interactions derived from inversion of the centre of mass (CM) correlation functions in lattice Self-Avoiding-Walk (SAW) polymer simulations. This approach generates soft density-dependent potentials for the polymer-polymer and colloid-polymer interactions, that give accurate simulation results for the bulk phase behavior, Bolhuis et al. 2002 that are in quantitative agreement with experimental results. In a similar approach, proposed by Jusufi et al. 2001, the effective potentials are derived from off-lattice molecular dynamics simulations of SAW polymer chains. These potentials were used in Monte Carlo simulations to study the bulk phase behavior Dzubiella et al. 2002; Rotenberg et al. 2004 and the gas-liquid interfacial tension Vink et al. 2005 of colloid-polymer mixtures, leading to results in quantitative agreement with experiments.
In this work, we study the effect of excluded volume interactions on the interfacial properties and phase behavior of confined colloid-polymer mixtures with Monte Carlo simulations. We simulate a binary mixture with the density-dependent potentials derived in Ref. Bolhuis and Louis 2002, and compare the simulation results with those for the AOV model.
II Model
The colloids are treated as hard spheres and the corresponding pair potential reads
| (1) |
where is the distance between two colloidal particles, with the position of the centre of mass of colloid , , Boltzmann’s constant, and the temperature. For the coarse-grained effective polymer-polymer, colloid-polymer, and wall-polymer potentials we use the expressions of Ref. Bolhuis and Louis 2002 obtained from microscopic simulations of SAW polymer chains consisting of 500 segments on a lattice and a radius of gyration =16.83 lattice units at zero concentration. We introduce the overlap concentration defined by the equation , and the polymer reservoir packing fraction , with the density in the reservoir of pure polymers in osmotic equilibrium with the two-component system of interest.
The effective density-dependent polymer-polymer interactions, Bolhuis and Louis 2002 read
| (2) |
where is the radius of gyration, is the distance between two polymers, with the position of the centre of mass of polymer . The density-dependent parameters are linear in the density , and . All coefficients, except , are given in Table 1. The coefficients are fixed by imposing the equality of the mean field equation of state
| (3) |
for the fitted potentials and the SAW simulations, where the function
| (4) |
is the component of the Fourier transform of the polymer-polymer pair potential. In practice, the condition is satisfied by imposing the equality between
| (5) |
derived from Eq. (2) and
| (6) | |||||
derived using the potentials obtained from the inversion of the radial distribution function determined from SAW simulations.
| k=1 | k=2 | k=3 | |
|---|---|---|---|
| 1.47409 | -0.23210 | 0.63897 | |
| -0.07689 | 0.03132 | 0.24193 | |
| 0.98137 | 0.42123 | - | |
| -0.05681 | -0.02628 | - |
The concentration-dependent colloid-polymer potential reads Bolhuis et al. 2002
| (7) | |||||
where is the distance between colloid and polymer . The density-dependent parameters are linear in density, i.e., , , and . The coefficients are given in Table 2 for size ratio q=1.05.
| k=1 | k=2 | |
|---|---|---|
| 5.5610 | 1.8477 | |
| -0.8042 | 1.4759 | |
| 0.7751 | 1.2720 | |
| -0.1151 | 0.1052 | |
| 0.4082 | 0.0 | |
| 0.1410 | 0.0 |
The interaction between colloidal particles and the hard wall is hard-sphere-like, that is the colloidal particles cannot penetrate the walls. The interaction between polymers and the hard wall Bolhuis and Louis 2002 reads
| (8) | |||||
where is the distance between the wall and the centre of mass of the polymer. The parameters have a quadratic density-dependence , with =0, 1, 2, 3. The coefficients are given in Table 3. In Fig. 2, we show the effective polymer-polymer, colloid-polymer, and wall-polymer interactions for as an example.
| k=0 | k=1 | k=2 | k=3 | |
|---|---|---|---|---|
| 62.7242 | -6.4093 | 2.5081 | -0.6904 | |
| 56.4595 | -3.8880 | 5.1562 | -1.5519 | |
| -29.9283 | 2.0442 | -2.1336 | 0.5973 |
A final note on the potentials described in this section is in order. Due to a small error in the calculation of the radius of gyration in Ref. Bolhuis and Louis 2002, all the equations and coefficients presented here were parameterized assuming a radius of gyration =16.495 lattice units, instead of the correct value of =16.83. The simulations we carried out for this work, as well as the simulations presented on Ref. Bolhuis et al. 2002, were done imposing a size ratio of (corresponding to the radius of gyration =16.495) in the calculations. All the results have been interpreted using the correct value for the size ratio (corresponding to the radius of gyration =16.83) . This correction only change the value of the polymer packing fractions and , while the colloid packing fraction is unaffected.
III Method
We carried out Monte Carlo simulations in the grand canonical ensemble, i.e. with fixed volume, temperature, and chemical potentials and of colloids and polymers, respectively. For each value of we determined the potentials given in the previous section, at the polymer reservoir packing fraction calculated by inversion of the equation of state
| (9) | |||||
This equation was derived by integrating the Gibbs-Duhem equation with the pressure given by Eq. (3) and Eq. (6).
To study phase coexistence, we sample the probability of observing colloids in a volume at fixed colloid fugacity and fixed polymer reservoir packing fraction , using the successive umbrella sampling Virnau and Müller 2004. We use the histogram reweighting technique to obtain the probability distribution for any once is known for a given :
| (10) |
At phase coexistence, the distribution function becomes bimodal with two separate peaks of equal area for the colloidal liquid and gas phases. We determine which satisfies the equal area rule
| (11) |
with the average number of colloids
| (12) |
using the histogram reweighting equation (10). The simulations are carried out in a rectangular box , and the sampling of the probability ratio is done, in each window, until the difference between two successive samplings of the probability ratio is smaller than . An example of the sampled probability distributions is given in Fig. 3.
We used single particle insertion/deletion of colloids and polymers. The typical acceptance probabilities for the insertion/deletion of colloids were between 4% to 1% (from low to high colloid density) for state points close to the critical points and from 0.1% to 0.01% at high . On the other hand, the acceptance probabilities for the insertion/deletion of polymers were always larger then 40%. The low insertion/deletion probabilities of colloidal particles have only an effect on the efficiency of the algorithm. As shown by the smooth probability distributions in Fig. 3 our simulations were long enough to get good data.
The liquid-gas interfacial tension is obtained from at coexistence Binder 1982
| (13) |
where and are the maxima of the gas and liquid peaks, respectively, and is the minimum between the two peaks.
IV Results
In Sec. II we explained the straightforward, but nontrivial procedure for generating the interaction potentials. It is therefore important to check the internal consistency of our calculations. Fig. 4 shows the predictions of the equation of state (9) plotted against simulations results of a grand canonical simulation of pure polymers interacting with the potential (2). In the range of chemical potentials that are relevant for the gas-liquid separation the simulation results are consistent with the equation of state.
IV.1 Bulk phase behavior and gas-liquid interfacial tension
In Fig. 5 we present the bulk phase diagram obtained from grand canonical Monte Carlo simulations using successive umbrella sampling and histogram reweighting. In particular, Fig. 5(a) shows the phase diagram in the polymer packing fraction , colloid packing fraction representation. These results are consistent with the findings of Ref. Bolhuis et al. 2002.
The free volume theory Lekkerkerker 1990 extended to include excluded volume polymer interactions, Aarts et al. 2002 overestimates the simulation results by almost a factor of two. This result may be explained by the renormalisation group theory expression used in Ref. Aarts et al. 2002 to evaluate the polymer interactions, that underestimates the correlation length of the polymers. Since the polymers are effectively smaller, a higher number of polymers is needed to drive the demixing transition. Also shown are the experimental results of de Hoog and Lekkerkerker 1999. The experimental polymer concentration is much larger than our simulation results. This discrepancy can be explained by considering the depletion force measurements of Wijting et al. 2004 in the same colloid-polymer system as was used in Ref. de Hoog and Lekkerkerker 1999. They found that the depletion forces are much smaller than expected, probably due to adsorption of the polymers on the colloidal surface. We stress that the potentials used in this work compare well with the experiments of Ramakrishnan et al. 2002 at a size ratio =0.67 Bolhuis et al. 2002.
Fig. 5(b) shows the phase diagram in the polymer reservoir packing fraction , colloids packing fraction representation. The discrepancy between our results and those of Ref. Bolhuis et al. 2002 are due to a slightly different equation of state used for the conversion of the chemical potential to the polymer packing fraction in the reservoir . In this work, we inverted Eq. (9), while in Ref. Bolhuis et al. 2002 the original SAW equation of state was used. The binodal has a critical point at lower , and the density difference between the gas and liquid phases increases for increasing . This phase diagram is equivalent to the temperature-density phase diagram of a simple fluid, with the polymer reservoir packing fraction playing the role of inverse temperature.
In Fig. 6, we present the simulation results of the dimensionless interfacial tension for the gas-liquid interface, as a function of the difference in packing fractions between the gas and the liquid phase. The interfacial tensions decreases in the case of excluded volume interactions with respect to the AOV model. The comparison between our results and the experiments of Aarts et al. 2003 is quantitatively better than the results of the AOV model, although de Hoog and Lekkerkerker 1999 show that it is difficult to obtain accurate interfacial tension measurements. In addition, we compare our results with the predictions of the extended free volume theory plus a square gradient approximation to evaluate the tension, Aarts et al. 2004 and the density functional theory (DFT) of Moncho-Jorda et al. 2005. The DFT uses effective one-component pair potentials between the colloids that includes the excluded volume interaction according to the approach of Louis et al. 2002. The predictions of the two theories are very close to each other and to our simulation results.
Fig. 7 shows the phase diagram of colloid-polymer mixtures confined between two hard walls with separation distance , 16, 8, 4, 2. In particular, Fig. 7(a) shows the phase diagram of colloid-polymer mixtures in the polymer packing fraction , colloid packing fraction representation. The binodals in Fig.7(a), hardly change under confinement. We stress that the comparison between the absolute densities inside capillaries of different sizes is complicated due to two factors. First, the density for confined systems is a ill-defined quantity because it depends on the definition of the volume. Our choice of volume depends on the wall separation. Therefore, the comparison between densities for different wall separations in not entirely consistent. Second, the adsorption of colloids and polymers is different for different wall separations. We find that the colloid adsorption is in general larger for larger wall separations, and consequently the polymer adsorption is smaller. Therefore, for larger wall separations we expect a larger colloid density and a smaller polymer density. The combination of these two effects renders the interpretation of the phase diagram in the and representation fairly complicated. Fig. 7(b) displays the phase diagram of colloid-polymer mixtures in the polymer reservoir packing fraction , colloid packing fraction representation. The critical points of the confined systems shift towards higher for decreasing wall separation. The interpretation of the binodals in the () representation is more straightforward because only suffers of the problems described above.
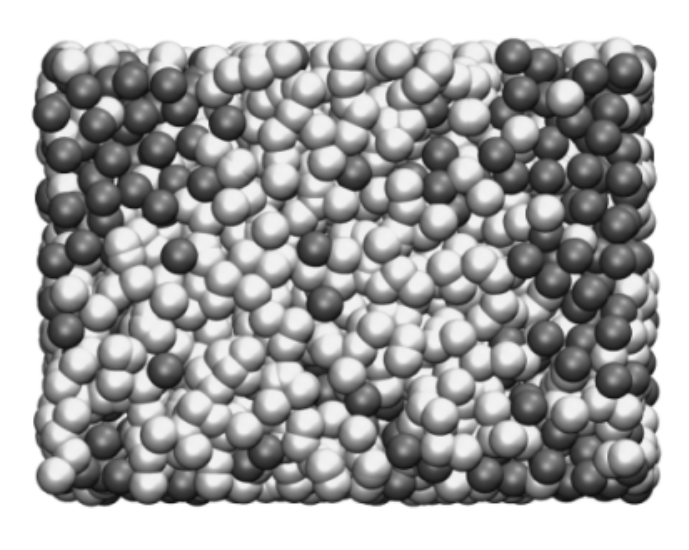
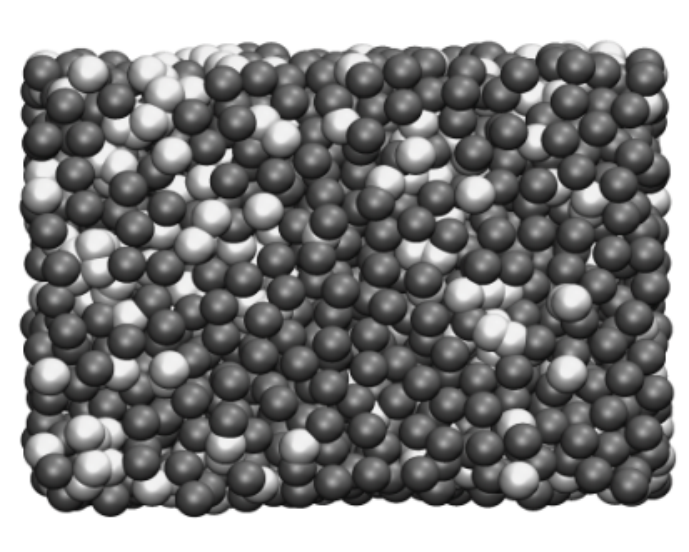

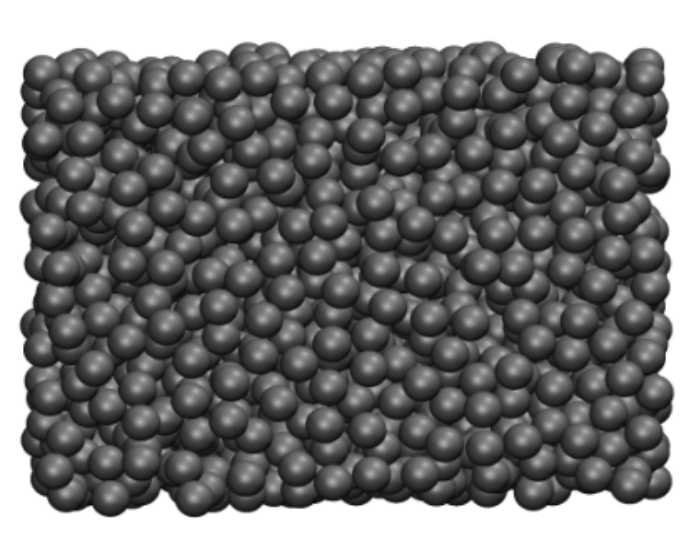
We can say that the huge shift in gas densities at coexistence for the confined systems with respect to the bulk binodal is due to the formation of liquid layers at the walls (See Fig. 8(a) and (c)). The adsorption of colloids at the walls is due to the depletion attraction, which was also observed in the AOV model. However, the thickness of the liquid layer was in that case much smaller than in the present case and the shift in gas density less pronounced. Schmidt et al. 2003a; Fortini et al. 2006
Fig. 9 displays the phase diagram in the polymer chemical potential , colloid chemical potential representation. These variables do not depend on the definition of the volume and are therefore independent of the wall separation distance. This is the ideal representation to compare the binodals for different wall separation distances. The binodals collapse to a single line because of the thermodynamic equilibrium conditions of the gas-liquid coexistence. Regions above the binodal are gas-like, while regions below the binodal are liquid-like. We find a shift of the binodals towards higher polymer chemical potential and smaller colloid chemical potential indicating the occurrence of capillary condensation. Our estimates for the critical points are reported in Tab. 4.
| 1.06(5) | 0.192(5) | 4.99(5) | 9.23(5) | |
| 16 | 1.08(5) | 0.243(5) | 5.10(5) | 9.45(5) |
| 8 | 1.09(5) | 0.235(5) | 5.16(5) | 9.50(5) |
| 4 | 1.17(5) | 0.219(5) | 5.72(5) | 10.25(5) |
| 2 | 1.27(5) | 0.199(5) | 6.43(5) | 10.64(5) |
Also shown in Fig. 9 are the predictions of the Kelvin equation Fortini et al. 2006
| (14) |
The predictions of the Kelvin equation are in good agreement with the simulation results for 16, and 8, but underestimates the shift for 4, and 2.
In order to compare the results with those for the AOV model we scale the binodals by the bulk critical point and , reported in Tab. 4. Fig. 10(a) and (b) show that the shift of the binodals and critical points is smaller for the model with interacting polymers than for the AOV model studied in Refs. Schmidt et al. 2003a; Fortini et al. 2006 for all state points considered. As shown in Fig. 5, the difference between the colloid packing fraction of the liquid and the gas at coexistence is smaller for the interacting polymers than for the AOV model for low , but larger for high . On the other hand, Fig. 10(a) and (b) show that the shift in chemical potential is always smaller for the interacting polymers than for the AOV model. Therefore, we deduce from Eq. (14) that the difference (liquid-wall and gas-wall interfacial tensions at coexistence) is smaller for the interacting polymers model.
Moncho-Jorda et al. 2005 have shown that at constant the excluded volume interactions increase the difference in wall tensions. This is not in contrast with our findings, because for capillary condensation we need to consider the difference in wall tension at bulk coexistence, that is at different for the AOV model and the interacting polymer model.
V Conclusions
We have investigated bulk and confined colloid-polymer mixtures, using Monte Carlo simulations. Colloids are treated as hard spheres, while polymers were described as soft repulsive spheres. Colloid-polymer, polymer-polymer, and wall-polymer density-dependent interactions were described by the coarse-grained potentials derived in Ref. Bolhuis and Louis 2002. We find a bulk phase behavior consistent with the findings of Bolhuis et al. 2002. Our results for the bulk phase behavior are also similar to those for the AOV model with interacting polymers Aarts et al. 2002, but here the binodal line lies at higher polymer packing fractions, i.e., the number of polymers needed for the demixing transition is larger. These results are in agreement with the findings of other authors Bolhuis et al. 2002; Moncho-Jorda et al. 2003; Aarts et al. 2004; Vink et al. 2005. The comparison of our phase diagram with experiments de Hoog and Lekkerkerker 1999 is found to be poor for the size ratio considered here. This is surprising, since the same interaction potentials provided good agreement with experiments Ramakrishnan et al. 2002 at a smaller size ratio Bolhuis et al. 2002. In fact, this discrepancy can be explained by considering the results of Wijting et al. 2004 on depletion potential measurements on the same colloid-polymer mixtures that was used in the phase behavior experiments. These measurements concluded that the depletion attraction was smaller than expected, probably due to polymer adsorption on the surface of the colloids.
On the other hand, better agreement is found for the gas-liquid interfacial tension when compared to the experiments of Aarts et al. 2003 for the same system. Our results show that the gas-liquid interfacial tension is smaller for the interacting polymers than for the AOV model. This is in agreement with the works of others on colloid-polymer mixtures with interacting polymers Aarts et al. 2004; Vink and Schmidt 2005; Vink et al. 2005; Moncho-Jorda et al. 2005. Both the square gradient approximation and the DFT provide a good description of the simulation results.
In addition, we studied the phase behavior of the mixture confined between two parallel hard walls with separation distance 16, 8, 4, and 2. We find that the hard walls induce capillary condensation, and that the theoretical predictions of the Kelvin equation are in reasonable agreement with the simulation results for 16 and 8, but underestimate the binodal shifts for 4 and 2. Compared to the AOV model the excluded volume interactions suppress the capillary condensation. This implies that the effect can only be observed at statepoints close to bulk coexistence and that smaller plate separations are needed to induce capillary condensation for fixed supersaturation compared with non-interacting polymers. In other words the Kelvin length is smaller for interacting polymers than for the AOV model. In addition, we observed the formation of rather thick wetting layers at the largest wall separation we studied. This effect seems to be enhanced by the presence of the excluded volume interactions. At large wall separations the wetting layers provide an effective confinement , with the thickness of the wetting layer, as was recognized by Derjaguin 1940, which increases effectively the Kelvin length Aarts and Lekkerkerker 2004 for the colloid-polymer mixtures with excluded volume interactions. The influence of excluded volume interactions on the wetting properties of colloid-polymer mixtures is currently under investigation.
Acknowledgements.
We thank Remco Tuinier for discussions and Arturo Moncho Jordá and Dirk G. A. L. Aarts for their interfacial tension data. This work is part of the research program of the Stichting voor Fundamenteel Onderzoek der Materie (FOM), that is financially supported by the Nederlandse Organisatie voor Wetenschappelijk Onderzoek (NWO). We thank the Dutch National Computer Facilities foundation for granting access to the LISA supercomputer. NWO-CW is acknowledge for the TOP-CW funding.References
- Poon (2002) W. C. K. Poon, J. Phys.: Condens. Matter 14, R859 (2002).
- Tuinier et al. (2003) R. Tuinier, J. Rieger, and C. G. de Kruif, Adv. Coll. Interf. Sci. 103, 1 (2003).
- Brader et al. (2003) J. M. Brader, R. Evans, and M. Schmidt, Mol. Phys. 101, 3349 (2003).
- Pusey and van Megen (1986) P. N. Pusey and W. van Megen, Nature (London) 320, 340 (1986).
- Asakura and Oosawa (1954) S. Asakura and F. Oosawa, J. Chem. Phys. 22, 1255 (1954).
- Asakura and Oosawa (1958) S. Asakura and F. Oosawa, J. Polym. Sci. 33, 183 (1958).
- Vrij (1976) A. Vrij, Pure Appl. Chem. 48, 471 (1976).
- Gast et al. (1983) A. P. Gast, C. K. Hall, and W. B. Russel, J. Colloid Interface Sci. 96, 251 (1983).
- Lekkerkerker et al. (1992) H. N. W. Lekkerkerker, W. C. K. Poon, P. N. Pusey, A. Stroobants, and P. Warren, Europhys. Lett. 20, 559 (1992).
- Meijer and Frenkel (1994) E. J. Meijer and D. Frenkel, J. Chem. Phys. 100, 6873 (1994).
- Dijkstra et al. (1999) M. Dijkstra, J. M. Brader, and R. Evans, J. Phys.: Condens. Matter 11, 10079 (1999).
- de Hoog and Lekkerkerker (1999) E. H. A. de Hoog and H. N. W. Lekkerkerker, J. Phys. Chem. B 103 (1999).
- Chen et al. (2000) B.-H. Chen, B. Payandeh, and M. Robert, Phys. Rev. E 62, 2369 (2000).
- Schmidt et al. (2000) M. Schmidt, H. Löwen, J. M. Brader, and R. Evans, Phys. Rev. Lett. 85, 1934 (2000).
- Schmidt et al. (2002) M. Schmidt, H. Löwen, J. M. Brader, and R. Evans, J. Phys.: Condens. Matter 14, 9353 (2002).
- Vink and Horbach (2004) R. L. C. Vink and J. Horbach, J. Chem. Phys. 121, 3253 (2004).
- Brader et al. (2001) J. M. Brader, M. Dijkstra, and R. Evans, Phys. Rev. E 63, 041405 (2001).
- Brader et al. (2002) J. M. Brader, R. Evans, M. Schmidt, and H. Löwen, J. Phys.: Condens. Matter 14, L1 (2002).
- Dijkstra and van Roij (2002) M. Dijkstra and R. van Roij, Phys. Rev. Lett. 89, 208303 (2002).
- Wijting et al. (2003a) W. K. Wijting, N. A. M. Besseling, and M. A. Cohen Stuart, J. Phys. Chem. B 107, 10565 (2003a).
- Aarts et al. (2003) D. G. A. L. Aarts, J. H. van der Wiel, and H. N. W. Lekkerkerker, J. Phys.: Condens. Matter 15, S245 (2003).
- Wijting et al. (2003b) W. K. Wijting, N. A. M. Besseling, and M. A. Cohen Stuart, Phys. Rev. Lett. 90, 196101 (2003b).
- Aarts (2005) D. G. A. L. Aarts, J. Phys. Chem. B 109, 7407 (2005).
- Fortini et al. (2005a) A. Fortini, M. Dijkstra, M. Schmidt, and P. P. F. Wessels, Phys. Rev. E 71, 051403 (2005a).
- Wessels et al. (2004a) P. P. F. Wessels, M. Schmidt, and H. Löwen, J. Phys.: Condens. Matter 16, S4169 (2004a).
- Wessels et al. (2004b) P. P. F. Wessels, M. Schmidt, and H. Löwen, J. Phys.: Condens. Matter 16, L1 (2004b).
- Schmidt et al. (2003a) M. Schmidt, A. Fortini, and M. Dijkstra, J. Phys.: Condens. Matter 15, 3411 (2003a).
- Lee et al. (2003) T.-C. Lee, J.-T. Lee, D. Pilaski, and M. Robert, Physica A 329, 411 (2003).
- Schmidt et al. (2004a) M. Schmidt, A. Fortini, and M. Dijkstra, J. Phys.: Condens. Matter 16, S4159 (2004a).
- Aarts and Lekkerkerker (2004) D. G. A. L. Aarts and H. N. W. Lekkerkerker, J. Phys.: Condens. Matter 16, S4231 (2004).
- Fortini et al. (2006) A. Fortini, M. Schmidt, and M. Dijkstra, Phys. Rev. E 73, 051502 (2006).
- Vink et al. (2006a) R. L. C. Vink, K. Binder, and J. Horbach, Phys. Rev. E 73, 056118 (2006a).
- Vink et al. (2006b) R. L. C. Vink, A. D. Virgiliis, J. Horbach, and K. Binder, Phys. Rev. E 74, 031601 (2006b).
- Virgiliis et al. (2007) A. D. Virgiliis, R. L. C. Vink, J. Horbachand, and K. Binder, Europhys. Lett. 77, 60002 (2007).
- Schmidt and Denton (2002) M. Schmidt and A. R. Denton, Phys. Rev. E 65, 061410 (2002).
- Denton and Schmidt (2002) A. R. Denton and M. Schmidt, J. Phys.: Condens. Matter 14, 12051 (2002).
- Denton and Schmidt (2005) A. R. Denton and M. Schmidt, J. Chem. Phys. 122, 244911 (2005).
- Fortini et al. (2005b) A. Fortini, M. Dijkstra, and R. Tuinier, J. Phys.: Condens. Matter 17, 7783 (2005b).
- Schmidt et al. (2003b) M. Schmidt, A. R. Denton, and J. M. Brader, J. Chem. Phys. 118, 1541 (2003b).
- Vink and Schmidt (2005) R. L. C. Vink and M. Schmidt, Phys. Rev. E 71, 051406 (2005).
- Schmidt et al. (2004b) M. Schmidt, M. Dijkstra, and J.-P. Hansen, Phys. Rev. Lett. 93, 088303 (2004b).
- Aarts et al. (2002) D. G. A. L. Aarts, R. Tuinier, and H. N. W. Lekkerkerker, J. Phys.: Condens. Matter 14, 7551 (2002).
- Brader and Evans (2000) J. M. Brader and R. Evans, Europhys. Lett. 49, 678 (2000).
- Moncho-Jorda et al. (2003) A. Moncho-Jorda, B. Rotenberg, and A. A. Louis, J. Chem. Phys. 119, 12667 (2003).
- Aarts et al. (2004) D. G. A. L. Aarts, R. P. A. Dullens, H. N. W. Lekkerkerker, D. Bonn, and R. van Roij, J. Chem. Phys. 120, 1973 (2004).
- Louis et al. (2002) A. A. Louis, P. G. Bolhuis, E. J. Meijer, and J.-P. Hansen, J. Chem. Phys. 117, 1893 (2002).
- Moncho-Jorda et al. (2005) A. Moncho-Jorda, J. Dzubiella, J.-P. Hansen, and A. A. Louis, J. Phys. Chem. B 109, 6640 (2005).
- Bolhuis and Louis (2002) P. G. Bolhuis and A. A. Louis, Macromolecules 35, 1860 (2002).
- Louis et al. (2000) A. A. Louis, P. G. Bolhuis, J. P. Hansen, and E. J. Meijer, Phys. Rev. Lett. 85, 2522 (2000).
- Bolhuis et al. (2001) P. G. Bolhuis, A. A. Louis, J. P. Hansen, and E. J. Meijer, J. Chem. Phys. 114, 4296 (2001).
- Bolhuis et al. (2002) P. Bolhuis, A. A. Louis, and J.-P. Hansen, Phys. Rev. Lett. 89, 128302 (2002).
- Jusufi et al. (2001) A. Jusufi, J. Dzubiella, C. N. Likos, C. von Ferber, and H. Löwen, J. Phys.: Condens. Matter 13, 6177 (2001).
- Dzubiella et al. (2002) J. Dzubiella, C. N. Likos, and H. Lowen, J. Chem. Phys. 116, 9518 (2002).
- Rotenberg et al. (2004) R. Rotenberg, J. Dzubiella, A. A. Louis, and J.-P. Hansen, Mol. Phys. 102, 1 (2004).
- Vink et al. (2005) R. L. C. Vink, A. Jusufi, J. Dzubiella, and C. N. Likos, Phys. Rev. E 72, 030401(R) (2005).
- Virnau and Müller (2004) P. Virnau and M. Müller, J. Chem. Phys. 120, 10925 (2004).
- Binder (1982) K. Binder, Phys. Rev. A 25, 1699 (1982).
- Lekkerkerker (1990) H. N. W. Lekkerkerker, Colloids and Surfaces 51, 419 (1990).
- Wijting et al. (2004) W. K. Wijting, W. Knoben, N. A. M. Besseling, F. A. M. Leermakers, and M. A. Cohen Stuart, Phys. Chem. Chem. Phys. 6, 4432 (2004).
- Ramakrishnan et al. (2002) S. Ramakrishnan, M. Fuchs, K. S. Schweizer, and C. F. Zukoski, J. Chem. Phys. 116, 2201 (2002).
- Derjaguin (1940) B. V. Derjaguin, Acta Phys. Chem. 12, 181 (1940).