The Monitor project: Rotation of low-mass stars in the open cluster NGC 2547
Abstract
We report on the results of an -band time-series photometric survey of NGC 2547 using the MPG/ESO 2.2m telescope with WFI, achieving better than photometric precision per data point over . Candidate cluster members were selected from a vs colour magnitude diagram over (covering masses from down to below the brown dwarf limit), finding candidates, of which we expect to be real cluster members, taking into account contamination from the field (which is most severe at the extremes of our mass range). Searching for periodic variations in these gave detections over the mass range . The rotation period distributions were found to show a clear mass-dependent morphology, qualitatively intermediate between the distributions obtained from similar surveys in NGC 2362 and NGC 2516, as would be expected from the age of this cluster. Models of the rotational evolution were investigated, finding that the evolution from NGC 2362 to NGC 2547 was qualitatively reproduced (given the uncertainty in the age of NGC 2547) by solid body and core-envelope decoupled models from our earlier NGC 2516 study without need for significant modification.
Keywords:
open clusters and associations: individual: NGC 2547 – techniques: photometric – stars: rotation – surveys.1 Introduction
NGC 2547 is a relatively well-studied nearby young open cluster; we adopt the parameters of Naylor & Jeffries 2006, who give an age of , distance modulus and reddening . The age derived by these authors puts the cluster at the approximate point where G-dwarfs reach the zero age main sequence (ZAMS; see for example Figure 1 of Irwin et al. 2007b), and slightly younger than the typically-used benchmark of Persei (, e.g. Basri & Martín 1999). The small distance modulus makes it possible to probe down to very low masses, with relatively modest-sized telescopes.
The cluster has been surveyed in X-rays using ROSAT (Jeffries & Tolley 1998) and XMM-Newton (Jeffries et al. 2006). The latter study found that the solar type stars in NGC 2547 exhibited a similar relation between X-ray activity and Rossby number to field stars and older clusters, but with saturated or super-saturated X-ray activity levels, and median levels of X-ray luminosity and X-ray to bolometric luminosity ratio similar to T-Tauri stars in the ONC, but much higher than in the Pleiades. These measures are consistent with the relative youth of NGC 2547.
Surveys of lithium depletion (Oliveira et al. 2003; Jeffries et al. 2003; Jeffries & Oliveira 2005) have placed constraints on the cluster age, and conversely, on stellar evolution models by comparison with isochrone fitting results. Jeffries & Oliveira 2005 find ages based on lithium depletion of , reasonably consistent with the isochrone-based estimate we assumed earlier.
Jeffries, Totten & James 2000 performed a survey of the solar-type stars in the cluster, finding a distribution indistinguishable from that in the similar-age clusters IC 2391 and IC 2602, with a similar rotation-activity relationship to older clusters such as the Pleiades. Littlefair et al. 2003 found weak evidence for mass segregation in the cluster, confirmed by Jeffries et al. 2003 using a new photometric survey, where they also derived the cluster mass function down to , finding a result very similar to the Pleiades mass function over the range .
Finally, NGC 2547 has been observed with Spitzer using the IRAC and MIPS instruments by Young et al. 2004 to investigate the cluster disc frequency. Gorlova et al. 2007 subsequently extended the survey coverage, finding only out of stars of B—mid-M spectral type to show excesses in the IRAC band, a fraction of per cent. In the MIPS band, they found per cent of the stars of B—F spectral types to show excesses. This striking result is most likely due to the discs clearing from the inside outwards, with the lack of short-wavelength excesses caused by the discs being substantially cleared within the central parts by the age of NGC 2547.
1.1 Evolution of stellar angular momentum
For a discussion of the context of this work, the reader is referred to our M34 and NGC 2516 publications in Irwin et al. 2006 and Irwin et al. 2007b. The present survey probes a different open cluster of younger age ( for NGC 2547, compared to for NGC 2516 and for M34). Due to the small distance modulus and young age, the NGC 2547 survey probes a relatively wide range of masses, covering , compared to in NGC 2516 and in M34. This will allow a more detailed comparison with models of angular momentum evolution, and in particular to test our results in Irwin et al. 2007b, where we found that the evolution of the fast rotators appeared to be better-reproduced by solid body models, and the slow rotators by differentially rotating models. At the age of NGC 2547, stars with masses should be fully-convective, and at , just beginning to develop a radiative core (Chabrier & Baraffe 1997).
1.2 The survey
We have undertaken a photometric survey in NGC 2547 using the MPG/ESO 2.2m telescope with the Wide Field Imager (WFI; Baade et al. 1999). Our goals are two-fold: first, to study rotation periods for a sample of low-mass members, covering K and M spectral types, down to , and second, to look for eclipsing binary systems containing low-mass stars, to obtain dynamical mass measurements in conjunction with radial velocities from follow-up spectroscopy. Such systems provide the most accurate determinations of fundamental stellar parameters (in particular, masses) for input to models of stellar evolution, which are poorly constrained in this age range. We defer discussion of our eclipsing binary candidates to a later paper once we have obtained suitable follow-up spectroscopy.
These observations are part of a larger photometric monitoring survey of young open clusters over a range of ages and metalicities (the Monitor project; Hodgkin et al. 2006 and Aigrain et al. 2007).
The remainder of the paper is structured as follows: the observations and data reduction are described in §2, and the colour magnitude diagram (CMD) of the cluster and candidate membership selection are presented in §3. The method we use for obtaining photometric periods is summarised in §4 (see Irwin et al. 2006 for a more detailed discussion), and our results are summarised in §5. We discuss the implications of these results in §6, and our conclusions are summarised in §7.
2 Observations and data reduction
Photometric monitoring observations were obtained using the MPG/ESO 2.2m telescope with WFI in service mode, with of observations distributed over a period from 2005 October to 2006 May. The instrument provides a field of view of (), using a mosaic of eight pixel CCDs, at a scale of .
In order to maximise the number of cluster members covered by our survey we elected to use two fields, with a -band exposure in each, observed by cycling between them, to give a cadence of , covering of the cluster, illustrated in Figure 1. Our observations are sufficient to give or better photometric precision per data point from saturation at down to (see Figure 2), covering K to mid M spectral types at the age and distance of NGC 2547.

We also obtained and -band exposures in each field during photometric conditions, to generate a colour magnitude diagram (CMD).
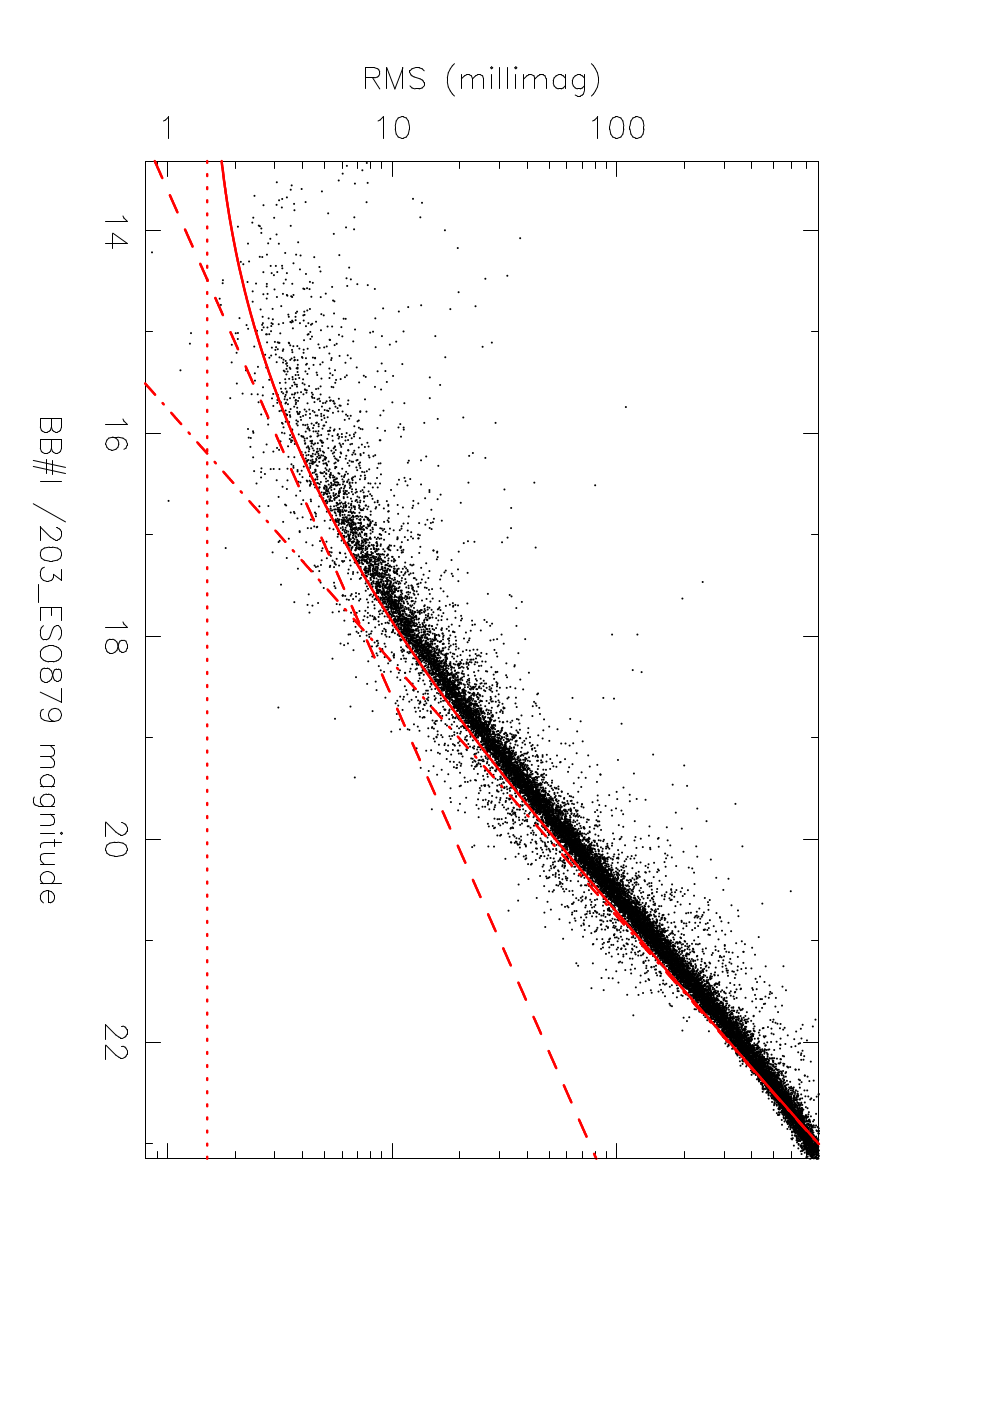
For a full description of our data reduction steps, the reader is referred to Irwin et al. 2007a. Briefly, we used the pipeline for the INT wide-field survey (Irwin & Lewis 2001) for 2-D instrumental signature removal (bias correction, flatfielding, defringing) and astrometric and photometric calibration. We then generated a master catalogue for each filter by stacking of the frames taken in the best conditions (seeing, sky brightness and transparency) and running the source detection software on the stacked image. The resulting source positions were used to perform aperture photometry on all of the time-series images. We achieved a per data point photometric precision of for the brightest objects, with RMS scatter for (see Figure 2).
Our source detection software flags any objects detected as having overlapping isophotes. This information is used, in conjunction with a morphological image classification flag also generated by the pipeline software (Irwin & Lewis 2001) to allow us to identify non-stellar or blended objects in the time-series photometry.
Photometric calibration of our data was carried out using regular observations of Landolt 1992 equatorial standard star fields in the usual way, as part of the standard ESO nightly calibrations.
Light curves were extracted from the data for objects, of which had stellar morphological classifications, using our standard aperture photometry techniques, described in Irwin et al. 2007a. We fit a 2-D quadratic polynomial to the residuals in each frame (measured for each object as the difference between its magnitude on the frame in question and the median calculated across all frames) as a function of position, for each of the CCDs separately. Subsequent removal of this function accounted for effects such as varying differential atmospheric extinction across each frame. Over a single CCD, the spatially-varying part of the correction remains small, typically peak-to-peak. The reasons for using this technique are discussed in more detail in Irwin et al. 2007a.
For the production of deep CMDs, we used the -band master catalogue, and combined the -band exposures. The limiting magnitudes, measured as the approximate magnitude at which our catalogues are complete on these images were and .
3 Selection of candidate low-mass members
A catalogue of photometrically-selected candidate members (using photometry) covering most of our survey area was available from Jeffries et al. 2004 for solar mass down to (limiting magnitude ), but we elected to perform a new photometric selection using versus CMDs from our data, to make better use of the deeper limiting magnitudes of the present survey.
3.1 The versus CMD
Our CMD of NGC 2547 is shown in Figure 3. The and measurements were converted to the standard Johnson-Cousins photometric system using colour equations derived from standard star observations by Mike Irwin (private communication):
| (1) | |||||
| (2) | |||||
| (3) |

Candidate cluster members were selected by defining an empirical cluster sequence ‘by eye’ to follow the clearly-visible cluster single-star sequence. The cuts were defined by moving this line along a vector perpendicular to the cluster sequence, by amounts and as measured along this vector, where is the photometric error in the colour. The values of used were for the lower line and for the upper line on the diagram, making the brighter region wider to avoid rejecting binary and multiple systems, which are overluminous for their colour compared to single stars. candidate photometric members were selected, over the full magnitude range from to , but the well-defined cluster sequence appears to terminate at , or , with a few candidate members below this limit, but with high field contamination.
The selection region used here is comparable to that of Jeffries et al. 2004, and below , of their candidate cluster members are also selected by our cut. Above , there are slight differences in the isochrones and due to saturation in the present sample, and the corresponding fraction is reduced to .
We also considered using the model isochrones of Baraffe et al. 1998 and Chabrier et al. 2000 for selecting candidate members. The NextGen model isochrones were found to be unsuitable due to the known discrepancy between these models and observations in the colour for (corresponding here to ). This was examined in more detail by Baraffe et al. 1998, and is due to a missing source of opacity at these temperatures, leading to overestimation of the -band flux. Consequently, when we have used the NextGen isochrones to determine model masses and radii for our objects, the -band absolute magnitudes were used to perform the relevant look-up, since these are less susceptible to the missing source of opacity, and hence give more robust estimates.
3.2 Contamination
In order to estimate the level of contamination in our catalogue, we used the Besançon Galactic models (Robin et al. 2003) to generate a simulated catalogue of objects passing our selection criteria at the Galactic coordinates of NGC 2547 (, ), covering the total FoV of (including gaps between detectors). We selected all objects over the apparent magnitude range , giving stars. The same selection process as above for the cluster members was then applied to find the contaminant objects. A total of simulated objects passed these membership selection criteria, giving an overall contamination level of after correcting for bins where the number of objects predicted by the models exceeded the number actually observed (we simply assumed field contamination in these bins). Figure 4 shows the contamination as a function of magnitude. We note that this figure is somewhat uncertain due to the need to use Galactic models, and especially given the overestimation of the numbers of observed objects by the models. Follow-up data will be required to make a more accurate estimate.

4 Period detection
4.1 Method
The method we use for detection of periodic variables is described in detail in Irwin et al. 2006, and we provide only a brief summary here. The method uses least-squares fitting of sine curves to the time series (in magnitudes) for all candidate cluster members, using the form:
| (4) |
where (the DC light curve level), (the amplitude) and (the phase) are free parameters at each value of over an equally-spaced grid of frequencies, corresponding to periods from for the present data-set.
Periodic variable light curves were selected by evaluating the change in reduced :
| (5) |
where is the reduced of the original light curve with respect to a constant model, and is the reduced of the light curve with the smoothed, phase-folded version subtracted. This threshold was used for the M34 data and appears to work well here too, carefully checked by examining all the light curves for two of the detectors, chosen randomly. A total of objects were selected by this automated part of the procedure.
The selected light curves were examined by eye, to define the final sample of periodic variables. A total of light curves were selected, with the remainder appearing non-variable or too ambiguous to be included.
4.2 Simulations
Monte Carlo simulations were performed following the method detailed in Irwin et al. 2006, injecting simulated signals of amplitude and periods chosen following a uniform distribution on period from to , into light curves covering a uniform distribution in mass, from to . A total of objects were simulated.
The results of the simulations are shown in Figure 5 as diagrams of completeness, reliability and contamination as a function of period and stellar mass. Broadly, our period detections are close to complete from down to , with remarkably little period dependence. Figure 6 shows a comparison of the detected periods with real periods for our simulated objects, indicating remarkably high reliability, especially compared to the earlier data-sets (Irwin et al. 2006; Irwin et al. 2007b), resulting from the extremely long time base-line of the present survey afforded by observing in service mode.


These results indicate overall that the service mode observing strategy as implemented by ESO performs very favourably for rotation period detection in NGC 2547, compared to our conventional visitor mode observations (e.g. Irwin et al. 2006; Irwin et al. 2007b). In particular, the sampling is very well-suited to determining extremely precise and accurate rotation periods, as illustrated in Figure 6.
However, there are two principal disadvantages. The long time span of the observations, and sparse sampling, here over , means the process of period detection is complicated by the evolution of the spot patterns on the stellar surfaces giving rise to the photometric modulations. This has the effect of modifying the amplitude and phase of the variability, and may occur over timescales of a few months. This has not been accounted for in the simulations. Qualitatively, this effect may reduce the overall detection rate since the variations will not produce a smooth phase-folded light curve for any plausible period, and will therefore be rejected in the detection process. Furthermore, for eclipsing binary detection this is obviously a serious problem, since the variations become much more difficult to remove when searching for shallow eclipses.
The second problem relates to the observing conditions. Since desired weather conditions are specified for a service mode proposal, and differential photometry does not require the best observing conditions, a service mode programme will in general receive poorer conditions than a visitor mode programme performed in good weather (e.g. the NGC 2516 survey; Irwin et al. 2007b). For rotation period detection at reasonable amplitudes, the simulations indicate that this is not a serious issue. However, poor seeing and particularly poor transparency, increase the level of low-amplitude correlated noise in the light curves (see Irwin et al. 2007a), which severely impedes detection of shallow transit events.
The effects of both these factors on transit detection will be evaluated in more detail in a future publication presenting our eclipse candidates.
4.3 Detection rate and reliability
The locations of our detected periodic variable candidate cluster members on a versus CMD of NGC 2547 are shown in Figure 7. The diagram indicates that the majority of the detections lie on the single-star cluster sequence, as would be expected for rotation in cluster stars as opposed to, say, eclipsing binaries.

Figure 8 shows the fraction of cluster members with detected periods as a function of magnitude. The decaying parts of the histogram at the bright and faint ends may be caused by the increased field contamination here (see Figure 4), since we expect field objects on average show less rotational modulation than cluster objects, and/or incompleteness effects resulting from saturation for , and for , the gradual increase in the minimum amplitude of variations we can detect (corresponding to the reduction in sensitivity moving to fainter stars, see Figure 2).

In the M34 survey of Irwin et al. 2006, we commented on a possible increase in the fraction of photometric variables from to spectral types, subject to a large uncertainty due to small number statistics. This feature was also seen in the NGC 2516 survey (Irwin et al. 2007b), and the three distributions look qualitatively very similar after correcting for the different mass ranges covered, with a rise in the fraction of periodic objects detected at spectral types of M0. However, in all three cases, this is also the point at which the cluster sequence becomes well-separated from the field in the CMD analysis, corresponding to a reduction in field contamination moving toward later spectral types. It is therefore difficult to say if the trend is significant from the present observations.
Likewise, lower field contamination is expected in the rotation sample than in the full candidate membership sample. Typical field population ages for the young disc of (Mayor 1974; Meusinger, Stecklum & Reimann 1991) imply slower rotation rates by factors of a few than cluster members, and reduced activity, implying smaller asymmetric components of the spot coverage and hence lower photometric amplitudes (which probably render many of them undetectable).
The properties of all our rotation candidates are listed in Table 1.
| Identifier | RA | Dec | ||||||
|---|---|---|---|---|---|---|---|---|
| J2000 | J2000 | mag | mag | days | mag | |||
| N2547-1-1-2501 | 08 11 20.69 | -48 49 22.5 | 17.97 | 15.55 | 2.758 | 0.014 | 0.44 | 0.56 |
| N2547-1-1-3141 | 08 11 32.39 | -48 48 01.0 | 17.78 | 15.43 | 9.523 | 0.009 | 0.47 | 0.59 |
| N2547-1-1-3640 | 08 11 59.66 | -48 46 56.8 | 15.58 | 14.01 | 3.213 | 0.038 | 0.76 | 0.82 |
| N2547-1-1-3903 | 08 11 22.55 | -48 46 29.8 | 14.90 | 13.57 | 0.991 | 0.005 | 0.81 | 0.89 |
| N2547-1-1-4637 | 08 11 46.91 | -48 44 54.0 | 17.16 | 14.83 | 3.071 | 0.024 | 0.61 | 0.69 |
4.4 Non-periodic objects
The population of objects rejected by the period detection procedure described in §4 was examined, finding that the most variable population of these light curves (which might correspond to non-periodic or semi-periodic variability) was contaminated by a small number of light curves () exhibiting various uncorrected systematic effects, mostly seeing-correlated variations due to image blending. It is therefore difficult to quantify the level of non-periodic or semi-periodic variability in NGC 2547 from our data. Qualitatively however, there appear to be very few of these variables, and examining the light curves indicated only obvious cases, some of which resembled eclipses (presumably due to eclipsing binaries), and will be the subject of a later Monitor project paper.
5 Results
5.1 NGC 2547 rotation periods
Plots of period as a function of colour and mass for the objects photometrically selected as possible cluster members are shown in Figure 9. These diagrams show a striking correlation between stellar mass (or spectral type) and the longest rotation period seen at that mass, with a clear lack of slow rotators at very low masses. This trend is also followed by the majority of the rotators, with only a tail of faster rotators to periods. Furthermore, very few objects were found rotating faster than this, implying a hard lower limit to the observed rotation periods at .


Could the apparent morphology in Figure 9 be explained by sample biases? The simulations of §4.2 suggest that this is unlikely, since we are sensitive to shorter periods than the ‘limit’, and the slight bias toward detection of shorter periods at low mass is not sufficient to explain the observations for the slow rotators. Furthermore, Figure 10 indicates that the lack of sensitivity to low amplitudes at low masses does not appear to introduce any systematic changes in the detected periods.


Figure 10 shows an apparent lack of objects with masses and rotation periods , a region of the diagram where the survey is sensitive down to amplitudes of (see also §4.2).
A very large fraction () of the bright rotators () were detected in the X-ray survey of Jeffries et al. 2006. Detection in X-rays is suggestive of youth and hence cluster membership, which confirms that the level of field contamination is low in the rotation sample, especially when the incomplete spatial overlap between our optical survey and the XMM-Newton observation of Jeffries et al. 2006 is accounted for. Very few of the lower-mass stars in Figure 9 were detected in X-rays (e.g. for there was only a single X-ray detection), but this is not surprising since these objects are fainter. Indeed, Figure 3 of Jeffries et al. 2006 indicates that the X-ray detection limit for a cluster member corresponds to , equivalent to with the models we are using.
5.1.1 Period distributions
In order to quantify the morphology of Figure 9, we have used histograms of the rotation period distributions in two broad mass bins, and , shown in Figure 11. We have attempted to correct the distributions for the effects of incompleteness and (un)reliability using the simulations described in §4.2, following the method used in Irwin et al. 2006. The results of doing this are shown in the solid histograms in Figure 11, and the raw period distributions in the dashed histograms.


The period distributions in the two mass bins of Figure 11 show clear differences, with the low-mass stars () showing a strongly peaked rotational period distribution, with a maximum at , whereas the higher-mass stars () show a broader distribution. We applied a two-sided Kolmogorov-Smirnov test to the corrected distributions to confirm the statistical significance of this result, finding a probability of that the distributions were drawn from the same parent population.
The implication of this result is that the observed morphology in Figure 9, and in particular the increase of the longest observed rotation period as a function of increasing mass, a trend followed also by the bulk of the rotators, is real and statistically significant.
5.1.2 Rapid rotators
We have examined the periods of our fastest-rotating stars, to check if they are rotating close to their break-up velocity. The critical period for break-up is given approximately by:
| (6) |
where and are the stellar radius and mass respectively (e.g. Herbst et al. 2002). Using the NextGen models of Baraffe et al. 1998, the object rotating closest to breakup is N2547-2-2-1563, with . However, the majority of our objects are rotating at much lower fractions of their break-up velocity.
Figure 10 indicates that there is only one object with , N2547-2-2-1485 at . Therefore, in common with the other clusters we have studied, we find a short-period limit of , with no objects found rotating faster than this rate.
5.2 The rotation-activity relation
Observations of open clusters in the age range to several Gyr have established an age-rotation-activity relationship, where younger stars tend to be more rapidly rotating, and emit strong X-rays (up to a saturation level), whereas older stars have spun-down to lower rotation rates, and emit a smaller fraction of their flux in X-rays (Jeffries 1999; Randich 2000). Jeffries et al. 2006 established that G and K stars in NGC 2547 follow the same relationship between X-ray activity and Rossby number established for field stars and old clusters, but at saturated or super-saturated X-ray activity levels, with values similar to those for T-Tauri stars in the ONC, but an order of magnitude higher than in the Pleiades. In this section, we re-evaluate the rotation-activity relation using the present NGC 2547 rotation period sample, which probes to lower masses than the sample of Jeffries et al. 2006.
Following the method of Jeffries et al. 2006, Figure 12 shows a plot of X-ray activity as a function of the Rossby number, defined as the ratio of rotation period to convective overturn timescale at the base of the convection zone, . Our X-ray luminosities were taken from Jeffries et al. 2006, but assuming a distance of for consistency with the distance modulus of we assume in this work (see §1). Bolometric luminosities were calculated from the -band absolute magnitudes and colours using a quadratic fit to the empirical bolometric corrections and colours of Leggett et al. 1996:
| (7) |

The values of were derived using Eq. (4) of Noyes et al. 1984 and colours of our stars, obtained from a linear fit to the intrinsic stellar colours of Leggett 1992:
| (8) |
These relations should give reliable results over the entire late-K to mid-M range of spectral types covered by the present rotation sample.
Comparing Figure 12 to Figure 9 of Jeffries et al. 2006 shows that we reproduce the same trend of X-ray activity with Rossby number seen in the earlier NGC 2547 work, and the ONC, where we have used a similar plot scale to aid comparison with their Figure.
A small group of objects at and in the NGC 2547 sample have unusually small values of compared to the remainder of the NGC 2547 objects. These all have very short rotation periods (). Comparing with Figure 9 of Jeffries et al. 2006 indicates that they also see one object in this region of the diagram. It is possible that these objects could show fast rotation rates as a result of tidal synchronisation effects in binary systems, a hypothesis which could be verified with follow-up spectroscopy.
There are also a small number of objects showing unusually strong X-ray emission, with values up to , which were not seen by Jeffries et al. 2006. Such high X-ray luminosities would be indicative of very strong activity, or alternatively, overestimation of or underestimation of . These objects could also result from mis-identification of a very luminous background AGN in X-rays with a cluster star in the optical, given the large search radii (here ) which must be used due to the limited astrometric accuracy of the X-ray data.
In order to attempt to trace the rotation-activity relation to lower-mass in NGC 2547, it would be desirable to obtain deeper X-ray observations, since the stars with masses were not detected in the existing XMM-Newton observations of Jeffries et al. 2006.
5.3 Comparison with mid-IR Spitzer observations
We have compared the rotation period results to the mid-IR Spitzer observations of Gorlova et al. 2007, to search for any correlation between mid-IR excess (presumably due to a circumstellar disc) and rotation period, as would be expected in the disc regulation paradigm for angular momentum evolution on the early-PMS.
Figure 13 shows a plot of colour versus rotation period. There are only three objects in the rotation period sample identified as having possible excesses. These are N2547-1-6-3669, N2547-2-2-6311, and N2547-2-3-6494. Of these, the latter two objects are flagged by Gorlova et al. 2007 as having possibly unreliable measurements, due to the presence of nearby sources or other image features which might contribute to the measured flux (confirmed by visual examination of our -band images). Therefore, only one object, N2547-1-6-3669, has a reasonably reliable excess. This has a very low inferred mass of , and falls on the locus of slow rotators at this mass, having a rotation period of .

Given the extremely small number of objects under discussion, it is difficult to draw any conclusions regarding the disc regulation paradigm. However, the only object with reliable evidence of an inner disc, N2547-1-6-3669, is indeed a slow rotator, as would be expected if its angular velocity was regulated by the presence of the disc.
One object in the rotation sample has a detection, and shows an excess in this band: N2547-1-5-1123. Again, this has a low inferred mass of , but is a rapid rotator, having a period of . This object does not have an excess, indicating that the inner disc has cleared, which may also be consistent with the disc regulation paradigm, since the inner disc is most likely the part that couples to the star to induce angular momentum loss and prevent it from spinning up.
The existence of a relatively large fraction of detections in the sample of Gorlova et al. 2007 motivates deeper MIPS observations, to probe to lower masses: the existing observations were only sufficient to detect photospheres down to F spectral types. The single object with a detection has a mid-M spectral type, and was only detected as a result of its large excess.
5.4 Comparison with other data-sets
5.4.1 Period versus mass diagram
Figure 14 shows a diagram of rotation period as a function of stellar mass for the ONC (; Hillenbrand 1997), NGC 2264 (; Park et al. 2000), NGC 2362 (; Moitinho et al. 2001; Balona & Laney 1996), NGC 2547, the Pleiades (; Meynet et al. 1993), NGC 2516 (; Jeffries et al. 2001), and M34 (; Jones & Prosser 1996). Data sources for each cluster are indicated in the figure caption.

The diagram clearly shows a gradual evolutionary sequence, from a relatively flat mass-dependence of the rotation periods in the ONC (), to a sloping relation in NGC 2362 () and NGC 2547, and the emergence of the break between a flat distribution for and strongly sloping distribution at lower masses, for the Pleiades, NGC 2516 () and M34 (), as discussed in Irwin et al. 2007b.
6 Discussion
6.1 Link to angular momentum
It is instructive to re-examine Figure 9 in terms of the stellar angular momentum . We define
| (9) | |||||
| (10) |
where is the moment of inertia of a star of mass and radius , is the radius of gyration ( for a uniform sphere rotating as a solid body), and is the rotational angular velocity. A plot of as a function of stellar mass for the NGC 2547 sample is shown in Figure 15.

We computed the median angular momentum as a function of mass for the NGC 2547 data, shown in Figure 15. The relation is consistent with the same , or specific angular momentum , relation as seen by Irwin et al. 2007b, and consistent with the conclusions of Herbst et al. 2001 in the ONC. The lack of any change in the median relation for stars still undergoing contraction on the PMS indicates that any mass-dependent angular momentum losses are not important in determining the evolution of the median over this age range, unless high angular momentum is hidden in a fast rotating radiative core. However, this is not the case in detail or once the stars reach the ZAMS, in particular it is clear (e.g. from Figure 14) the shape of the distribution does evolve in a mass-dependent fashion (see also the next Section).
6.2 Simple models
6.2.1 Description
For a full description of our simple model scheme, the reader is referred to the NGC 2516 publication (Irwin et al. 2007b). Briefly, we have generated models for solid body rotation, and a simple implementation of core-envelope decoupling where the core and envelope are treated as two separate entities joined at the convective/radiative boundary by angular momentum transfer according to the prescription of MacGregor 1991. The angular momentum loss rate was split into two components: losses due to stellar winds, assuming a loss law with saturation at a critical angular velocity (allowed to vary as a function of mass), and losses due to disc locking, which to a good approximation maintains a constant angular velocity until the circumstellar disc dissipates at an age . For the decoupled models there is one further parameter, , the timescale for coupling of angular momentum between the core and envelope.
For NGC 2547, we have computed the object masses using two different values of the cluster parameters (particularly, the age), in order to examine the consistency of the rotation periods with the range of cluster ages found in the literature. The first set of parameters are those assumed earlier, corresponding to an age of , which is consistent with the Lithium age for the cluster of (Jeffries & Oliveira 2005). The second set of parameters corresponded to the “conventional” isochrone based estimates, from Naylor et al. 2002, with an age of , and corresponding distance modulus .
6.2.2 Evolution from NGC 2362
We first attempt to evolve the observed rotation rates from our survey in NGC 2362 (Irwin et al., in preparation) forward in time to reproduce the available rotation period data. Following the method used in Section 6.2.2 of Irwin et al. 2007b, we have characterised the slow rotator population by the th percentile (the lower quartile) of the distribution of observed angular velocities, , and the fastest rotators by the th percentile.
Figure 16 shows a revised version of Figure 19 of Irwin et al. 2007b, adding in the NGC 2547 data. We have re-used the solid body and differentially rotating model fits to the NGC 2516 data: the models were not re-fit with the NGC 2547 observations. The mass bins used were as before: , , , , and (chosen empirically to encompass the changes in behaviour seen in the models, while retaining reasonable statistics). The models were calculated for single masses roughly at the centre of these bins, of , , , and . Since there are very few observations (one) in the highest-mass bin for NGC 2547, this will not be discussed further here.

Model parameters are summarised in each panel of Figure 16. Briefly, we fit the models using NGC 2362 as an initial condition, to best-reproduce the NGC 2516 rotation periods. The saturation angular velocity and disc lifetime were varied to obtain the best-fit for the solid body models to the fast rotators, and for the decoupled models we varied , the core-envelope coupling timescale, to fit the slow rotators. See Irwin et al. 2007b for a more detailed discussion.
The models for the bin show overall good agreement with the NGC 2547 data. At this mass and age it is difficult to distinguish between the solid body and decoupled models, but at later ages, the solid body model appears to give a better fit to the rapid rotators, and a differentially-rotating model to the slow rotators (Irwin et al. 2007b).
However, in the remaining three bins (and to some extent in the bin), a clear trend is visible for both the fast and slow rotator populations, where the observations show that the stars in NGC 2547 are rotating slower than expected.
Returning to Figure 14, it is clear that the fastest rotators have spun up significantly from NGC 2362 to NGC 2547, in accordance with the model prediction. Furthermore, there is some degree of scatter in the NGC 2362 data, especially at short periods, which may be due to contamination, e.g. from field binaries (Irwin et al., in preparation) in a similar fashion as we have hypothesised in M34 (Irwin et al. 2006) and NGC 2516 (Irwin et al. 2007b). If this is true, the presence of these objects has shifted the th percentile in NGC 2362 upward in , and may partly explain the discrepancy, especially due to the small number of objects in question. It is difficult to confirm this hypothesis before obtaining follow-up spectroscopy for the NGC 2362 sample to determine the nature of these objects.
For the slow rotators, examining Figure 14 indicates that there are a number of ‘outliers’ at longer period than the general trend shown by the upper envelope of the rotators. It is possible that that if these objects were removed from the computation of the percentiles, the slow rotators would then fall into agreement with the models. The nature of these objects is not clear, and we defer discussion of them in detail until we can obtain spectroscopy to confirm their nature as slow rotators, and confirm the masses we have determined from the models of Baraffe et al. 1998.
Returning to the issue of the age of NGC 2547, the rotation periods seem to be slightly more consistent with the younger age, although the results are still clearly not reproduced by the models, especially in the intermediate-mass and bins, where the NGC 2547 objects appear to be rotating slower than the models predict. Moving the NGC 2547 points to the left in the diagram would improve agreement with the models, but this is difficult to justify since the youngest ages in the literature for this cluster are . Given the uncertainties in the models, the rotation period measurements cannot therefore place useful constraints on the cluster age.
In light of the discussion above, the NGC 2547 data seem to be in reasonable agreement with the models, pending the results of spectroscopic follow-up, without need for significant modification from the earlier NGC 2516 study Irwin et al. 2007b. At this age it is difficult to observe the effects of core-envelope decoupling, so we are unable to refute our earlier statements that core-envelope decoupled models appear to be required to reproduce the evolution of the slowest rotators, and that the same models do not appear to give a good fit to the fast rotators, which are well-fit by solid body models.
6.2.3 Detailed evolution
Figure 17 shows the results of attempting to evolve the measured rotation periods in NGC 2362 forward in time to the age of NGC 2547 using the models we have described, with the relations fit from the NGC 2516 data for as a function of mass, on an object-by-object basis. By doing this, we can test if the model we have presented can reproduce the observations of NGC 2547, given the NGC 2362 rotators as an input.


Comparing the left and right-hand panels in Figure 17 indicates that the results are relatively independent of the assumed age for NGC 2547. This is due to the relatively shallow slope of the time-dependence in the rotation rates during this age range (see Figure 16).
The shape of the mass dependent morphology of the NGC 2547 distribution is reasonably well-reproduced from the NGC 2362 distribution by the models, with the differentially rotating models providing a slightly better fit overall to the slow rotators, but at this age it is difficult to distinguish between the two classes of models since the effects of differential rotation become much more pronounced between .
Furthermore, the rotation rates are also well-reproduced below , but not for higher masses, where the predicted rates are a factor of two faster than actually observed in NGC 2547. It should be noted that the adopted values of in this mass range are not well-constrained by the NGC 2516 data used to calibrate them, and have a strong effect on the morphology of this part of the diagram, so it is possible that any deviations here result from our assumption of a linear relation over the entire mass range.
The models predict that a number of objects should be rotating faster than , whereas none were observed in NGC 2547. However, re-examining Figure 14 shows some scatter in the NGC 2362 distribution at short periods, which may be related to contamination of the sample, so it is difficult to conclude if this result is significant before obtaining follow-up of the NGC 2362 sample.
This work suggests overall that the mass dependence of the observed rotation period distribution is reasonably well-reproduced by the combination of the initial conditions as seen in NGC 2362, the mass-dependence of stellar contraction on the PMS, and the mass-dependence of the saturation angular velocity , in agreement with Irwin et al. 2007b.
7 Conclusions
We have reported on results of an -band photometric survey of NGC 2547, covering of the cluster. Selection of candidate members in a versus colour-magnitude diagram using an empirical fit to the cluster sequence found candidate members, over a magnitude range of (covering masses from down to below the brown dwarf limit). The likely field contamination level was estimated using a simulated catalogue of field objects from the Besançon Galactic models (Robin et al. 2003), finding that objects were likely field contaminants, an overall contamination level of , implying that there are real cluster members over this mass range in our field-of-view.
From of time-series photometry we derived light curves for objects in the NGC 2547 field, achieving a precision of per data point over . The light curves of our candidate cluster members were searched for periodic variability corresponding to stellar rotation, giving detections over the mass range .
The rotation period distribution a a function of mass was found to show a clear mass-dependent morphology, intermediate between those found in NGC 2362 (Irwin et al., in preparation) and NGC 2516 (Irwin et al. 2007b), with a median relation of , or , as seen in the other clusters we have surveyed.
In §6.2, simple models of the rotational evolution were considered, both for the solid body case, and including differential rotation between a decoupled radiative core and convective envelope, as in our earlier work on NGC 2516 (Irwin et al. 2007b). Allowing for the uncertainty in the age of NGC 2547, the results indicate that it is possible to qualitatively reproduce the shape of the observed rotation rate distribution by evolving the NGC 2362 distribution forward in time, using the parameters fit to the NGC 2516 data of Irwin et al. 2007b. It is difficult to examine the effects of differential rotation at this age since they are still relatively small. Some small discrepancies were noted, caused by what appear to be ‘outliers’ in the distributions for NGC 2362 and NGC 2547, but it is difficult to resolve these issues at the present time. Follow-up spectroscopy will be required to make further progress.
Acknowledgments
Based on observations collected at the European Southern Observatory, Chile, as part of ESO large program 175.C-0685. This publication makes use of data products from the Two Micron All Sky Survey, which is a joint project of the University of Massachusetts and the Infrared Processing and Analysis Center/California Institute of Technology, funded by the National Aeronautics and Space Administration and the National Science Foundation. This research has also made use of the Digitized Sky Surveys, which were produced at the Space Telescope Science Institute under U.S. Government grant NAG W-2166, the SIMBAD database, operated at CDS, Strasbourg, France, and the WEBDA database, operated at the Institute for Astronomy of the University of Vienna. The Open Cluster Database, as provided by C.F. Prosser and J.R. Stauffer, may currently be accessed at http://www.noao.edu/noao/staff/cprosser/, or by anonymous ftp to 140.252.1.11, cd /pub/prosser/clusters/.
JI gratefully acknowledges the support of a PPARC studentship, and SA the support of a PPARC postdoctoral fellowship. We would like to express our gratitude to Isabelle Baraffe for providing the stellar evolution model tracks used in §6.2, and to Erick Young for supplying a machine-readable table of the Spitzer mid-IR observations.
References
- Aigrain et al. (2007) Aigrain S., Hodgkin S., Irwin J., Hebb L., Irwin M., Favata F., Moraux E., Pont F., 2007, MNRAS, 375, 29
- Allain et al. (1996) Allain S., Fernandez M., Martín E.L., Bouvier J., 1996, A&A, 314, 173
- Baade et al. (1999) Baade D., et al., 1999, The Messenger, 95, 15
- Balona & Laney (1996) Balona L.A., Laney C.D., 1996, MNRAS, 281, 1341
- Baraffe et al. (1998) Baraffe I., Chabrier G., Allard F., Hauschildt P.H., 1998, A&A, 337, 403
- Barnes et al. (1998) Barnes J.R., Collier Cameron A., Unruh Y.C., Donati J.F., Hussain G.A.J., 1998, MNRAS, 299, 904
- Barnes et al. (1999) Barnes S.A., Sofia S., Prosser C.F., Stauffer J.R., 1999, ApJ, 516, 263
- Basri & Martín (1999) Basri G., Martín E.L., 1999, 510, 266
- Chabrier & Baraffe (1997) Chabrier G., Baraffe I., 1997, A&A, 327, 1039
- Chabrier et al. (2000) Chabrier G., Baraffe I., Allard F., Hauschildt P.H., 2000, ApJ, 542, 464
- Cieza & Baliber (2006) Cieza L., Baliber N., 2006, ApJ, 649, 862
- Getman et al. (2005) Getman K., et al., 2005, ApJS, 160, 319
- Gorlova et al. (2007) Gorlova N., Balog Z., Rieke G. H., Muzerolle J., Su K. Y. L., Ivanov V. D., Young E. T., 2007, ApJ, in press (arXiv:0707.2827)
- Herbst et al. (2001) Herbst W., Bailer-Jones C.A.L., Mundt R., 2001, ApJ, 554, 197
- Herbst et al. (2002) Herbst W., Bailer-Jones C.A.L., Mundt R., Meisenheimer K., Wackermann R., 2002, A&A, 396, 513
- Hillenbrand (1997) Hillenbrand L., 1997, AJ, 113, 1733
- Hodgkin et al. (2006) Hodgkin S.T., Irwin J.M., Aigrain S., Hebb L., Moraux E., Irwin M.J., 2006, AN, 327, 9
- Irwin & Lewis (2001) Irwin M.J., Lewis J.R., 2001, NewAR, 45, 105
- Irwin et al. (2006) Irwin J., Aigrain S., Hodgkin S., Irwin M., Bouvier J., Clarke C., Hebb L., Moraux E., 2006, MNRAS, 370, 954
- Irwin et al. (2007a) Irwin J., Irwin M., Aigrain S., Hodgkin S., Hebb L., Moraux E., 2007, MNRAS, 375, 1449
- Irwin et al. (2007b) Irwin J., Aigrain S., Hodgkin S., Irwin M., Bouvier J., Clarke C., Hebb L., Moraux E., Bramich D.M., 2007, MNRAS, 377, 741
- Jeffries & Tolley (1998) Jeffries R.D., Tolley A.J., 1998, MNRAS, 300, 331
- Jeffries (1999) Jeffries R.D., 1999, in Butler C.J., Doyle J.G., eds, ASP Conf. Ser. Vol. 158, Solar and Stellar Activity: Similarities and Differences. Astron. Soc. Pac., San Francisco, p. 75
- Jeffries, Totten & James (2000) Jeffries R.D., Totten E.J., James D.J., 2000, MNRAS, 316, 950
- Jeffries et al. (2001) Jeffries R.D., Thurston M.R., Hambly N.C., 2001, A&A, 375, 863
- Jeffries et al. (2003) Jeffries R.D., Oliveira J.M., Barrado y Navascués D., Stauffer J.R., 2003, MNRAS, 343, 1271
- Jeffries et al. (2004) Jeffries R.D., Naylor T., Devey C.R., Totten E.J., 2004, MNRAS, 351, 1401
- Jeffries & Oliveira (2005) Jeffries R.D., Oliveira J.M., 2005, MNRAS, 358, 13
- Jeffries et al. (2006) Jeffries R.D., Evans P.A., Pye J.P., Briggs K.R., 2006, MNRAS, 367, 781
- Jones & Prosser (1996) Jones B.F., Prosser C.F., 1996, AJ, 111, 1193
- Jones, Fischer & Stauffer (1996) Jones B.F., Fischer D.A., Stauffer J.R., 1996, AJ, 112, 1562
- Krishnamurthi et al. (1998) Krishnamurthi et al., 1998, ApJ, 493, 914
- Lamm et al. (2005) Lamm M.H., Mundt R., Bailer-Jones C.A.L., Herbst W., 2005, A&A, 430, 1005
- Leggett (1992) Leggett S.K., 1992, ApJS, 82, 351
- Leggett et al. (1996) Leggett S.K., Allard F., Berriman G., Dahn C.C., Hauschildt P.H., 1996, ApJS, 104, 117
- Littlefair et al. (2003) Littlefair S.P., Naylor T., Jeffries R.D., Devey C.R., Vine S., 2003, MNRAS, 345, 1205
- Landolt (1992) Landolt A.J., 1992, AJ, 104, L340
- MacGregor (1991) MacGregor K.B., 1991, in Angular momentum evolution of young stars, Eds. Catalano S., Stauffer J.R.
- Magnitskii (1987) Magnitskii A.K., 1987, Soviet Astron. Lett., 13, 451
- Martín & Zapatero Osorio (1997) Martín E.L., Zapatero Osorio M.R., 1997, MNRAS, 286, L17
- Mayor (1974) Mayor M., 1974, A&A, 32, 321
- Meusinger, Stecklum & Reimann (1991) Meusinger H., Stecklum G., Reimann H.G., 1991, A&A, 245, 57
- Meynet et al. (1993) Meynet G., Mermilliod J.-C., Maeder A. 1993, A&AS, 98, 477
- Moitinho et al. (2001) Moitinho A., Alves J., Huélamo N., Lada C. J., 2001, ApJ, 563, 73
- Makidon et al. (2004) Makidon R.B., Rebull L.M., Strom S.E., Adams M.T., Patten B.M., 2004, AJ, 127, 2228
- Naylor et al. (2002) Naylor T., Totten E.J., Jeffries R.D., Pozzo M., Devey C.R., Thompson S.A., 2002, MNRAS, 335, 291
- Naylor & Jeffries (2006) Naylor T., Jeffries R., 2006, MNRAS, 373, 1251
- Noyes et al. (1984) Noyes R.W., Hartmann L.W., Baliunas S.L., Duncan D.K., Vaughan A.H., 1984, ApJ, 279, 763
- O’Dell & Collier Cameron (1993) O’Dell M.A., Collier Cameron A., 1993, MNRAS, 262, 521
- O’Dell, Hendry & Collier Cameron (1994) O’Dell M.A., Hendry M.A., and Collier Cameron A., 1994, MNRAS, 268, 181
- O’Dell at al. (1996) O’Dell M.A., Hilditch R.W., Collier Cameron A., Bell S.A., 1996, MNRAS 284, 874
- Oliveira et al. (2003) Oliveira J.M., Jeffries R.D., Devey C.R., Barrado y Navascués D., Naylor T., Stauffer J.R., Totten E.J., 2003, MNRAS, 342, 651
- Park et al. (2000) Park B., Sung H., Bessell M., Kang Y., 2000, AJ, 120, 894
- Patten & Simon (1996) Patten B., Simon T., 1996, ApJS, 106, 489
- Pizzolato et al. (2003) Pizzolato N., Maggio A., Micela G., Sciortino S., Ventura P., 2003, A&A, 397, 147
- Preibisch et al. (2005) Preibisch T., et al., 2005, ApJS, 160, 401
- Prosser (1991) Prosser C.F., 1991, PhD Thesis, University of California, Santa Cruz
- Prosser et al. (1993a) Prosser C.F., Schild R.E., Stauffer J.R., Jones B.F., 1993, PASP 105, 269
- Prosser et al. (1993b) Prosser et al., 1993, PASP, 105, 1407
- Prosser et al. (1995) Prosser et al., 1995, PASP, 107, 211
- Prosser & Randich (1998) Prosser C.F., Randich S., 1998, AN, 319, 210
- Prosser, Randich & Simon (1998) Prosser C.F., Randich S., Simon T. 1998, AN, 319, 215
- Queloz et al. (1998) Queloz D., Allain S., Mermilliod J.-C., Bouvier J., Mayor M., 1998, A&A, 335, 183
- Radick et al. (1987) Radick R.R., Thompson D.T., Lockwood G.W., Duncan D.K., Baggett W.E., 1987, ApJ, 321, 459
- Randich (2000) Randich S., 2000, in Pallavicini R., Micela G., Sciortino S., eds, ASP Conf. Ser. Vol. 198, Stellar Clusters and Associations: Convection, Rotation and Dynamos. Astron. Soc. Pac., San Francisco, p. 401
- Robin et al. (2003) Robin A.C., Reylé C., Derrière S., Picaud S., 2003, A&A, 409, 523
- Scholz & Eislöffel (2004) Scholz A., Eislöffel J., 2004, A&A, 421, 259
- Soderblom et al. (1993) Soderblom D.R., Stauffer J.R., Hudon J.D., Jones B.F., 1993, ApJS, 85, 315
- Stauffer et al. (1984) Stauffer J.R., Hartmann L., Soderblom D.R., Burnham N., 1984, ApJ, 280, 202
- Stauffer et al. (1985) Stauffer J.R., Hartmann L.W., Burnham J.N., Jones B.F., 1985, ApJ, 289, 247
- Stauffer & Hartmann (1987) Stauffer J.R., Hartmann L.W., 1987, ApJ, 318, 337
- Stauffer et al. (1987) Stauffer J.R., Schild R.A., Baliunas S.L., Africano J.L., 1987, PASP, 99, 471
- Stauffer, Hartmann & Jones (1989) Stauffer J.R., Hartmann L.W., Jones B.F., 1989, ApJ, 346, 160
- Terndrup et al. (1999) Terndrup D.M., Krishnamurthi A., Pinsonneault M.H., Stauffer J.R., 1999, AJ, 118, 1814
- Terndrup et al. (2000) Terndrup D.M., Stauffer J.R., Pinsonneault M.H., Sills A., Yuan Y., Jones B.F., Fischer D., Krishamurthi A., 2000, AJ, 119, 1303
- Terndrup et al. (2002) Terndrup D.M., Pinsonneault M., Jeffries R.D., Ford A., Sills A., 2002, ApJ, 576, 950
- Van Leeuwen, Alphenaar & Meys (1987) Van Leeuwen F., Alphenaar P, Meys J.J.M., 1987, A&AS, 67, 483
- Young et al. (2004) Young E.T., et al., 2004, ApJS, 154, 428