Spitzer IRS mapping of the central kpc of Centaurus A
Abstract
We report on the results of spectroscopic mapping observations carried out in the nuclear region of Centaurus A (NGC5128) over the 5.2 - 15 and 20-36m spectral regions using the Infrared Spectrograph on the Spitzer Space Telescope. We have detected and mapped S(0), S(2), S(3), and S(5) pure rotational transition lines of molecular hydrogen and emissions in the fine-structure transitions of [SiII], [SIII], [FeII], [FeIII], [ArII], [SIV], [NeII], [NeV] and [OIV]. The 500 pc bipolar dust shell discovered by Quillen et al.(2006) is even more clearly seen in the 11.3m dust emission feature than previous broad band imaging. The pure rotational lines of molecular hydrogen other than the S(0) line are detected above the dusty disk and associated with the oval dust shell. The molecular hydrogen transitions indicate the presence of warm gas at temperatures 250–720K. The column density of the warm molecular hydrogen in the shell is cm-2 and similar to that estimated from the continuum dust shell surface brightness. The ratio of the dust emission features at 7.7m and 11.3m and the ratio of the [NeII](12.8m) and 11.3m dust emission feature are lower in the 500 pc dust shell than in the star forming disk. The clearer shell morphology at 11.3m, warm molecular hydrogen emission in the shell, and variation in line ratios in the shell compared to those in the disk, confirm spectroscopically that this shell is a separate coherent entity and is unlikely to be a chance superposition of dust filaments. The physical conditions in the shell are most similar to Galactic supernova remnants where blast waves encounter molecular clouds. The lines requiring the highest level of ionization, [NeV](m) and [OIV](m), are detected 20–25″north-east and south-west of the nucleus and at position angles near the radio jet axis. Fine structure line ratios and limits from this region suggest that the medium is low density and illuminated by a hard radiation field at low ionization parameter. These higher S molecular hydrogen pure rotational transitions are also particularly bright in the same region as the [OIV] and [NeV] emission. This suggests that the gas associated with the dust shell has been excited near the jet axis and is part of an ionization cone.
1 Introduction
The nearest of all the giant radio galaxies, Centaurus A (NGC 5128) provides a unique opportunity to observe the dynamics and morphology of an active galaxy in detail across the electromagnetic spectrum. For a recent review on this remarkable object see Israel 1998. In its central regions, NGC 5128 exhibits a well recognized and optically-dark band of absorption across its nucleus. Images from the Spitzer Space Telescope (SST) with the Infrared Array Camera (IRAC) and Multiple Imaging Photometer for Spitzer (MIPS) cameras in the mid-infrared reveal a 3′long parallelogram shape (Quillen et al. 2006b) that has been modeled as a series of folds in a dusty warped thin disk (e.g., Bland 1986; Bland et al. 1987; Nicholson et al. 1992; Sparke 1996; Quillen et al. 2006b). The dusty disk is also the site of ongoing star formation at a rate of about yr-1, (based on the infrared luminosity estimated by Eckart et al. 1990). Centaurus A hosts an active nucleus (e.g., Whysong & Antonucci 2004; Mirabel et al. 1999) that has been recently studied using infrared spectra from the SST. (Weedman et al. 2005; Gorjian et al. 2007). Its nucleus exhibits a strong silicate absorption feature and emission from [NeV]. Here we do not study the nucleus but focus on structure exterior to it.
The IRAC and MIPS images of Centaurus A have revealed another surprise, a bipolar shell-like structure 500 pc north and south of the nucleus (Quillen et al. 2006a). This shell, seen for the first time with Spitzer imaging, could be the first extragalactic nuclear shell discovered in the infrared.
In this paper we present mapping of the central 500–600pc of Centaurus A done with the Infrared Spectrograph (IRS) on board the SST. The infrared spectral maps were obtained to test the possibility that the apparent dust shell is a separate coherent structure and not a chance superposition of dust filaments. They were also obtained to search for possible interactions between the AGN and the interstellar medium either by illumination from the AGN or caused by jets or outflows.
Based on the discussion by Israel 1998, we adopt a distance to Cen A of 3.4 Mpc. At this distance, 1 kpc corresponds to 1′on the sky. All positions reported in this manuscript are given with respect to Epoch 2000.
2 IRS observations
Observations were obtained in spectral mapping mode in the Short-Low (SL;5–14m) resolution and Long-High (LH; 19-38m) resolution modules of the Infrared Spectrograph on board the SST. The spectral resolution of SL is whereas that of LH is . In spectral mapping mode the Spitzer space craft points on a raster of discrete steps, settling at each position before the integrations begin. Each map was accompanied by a 4 position offset observation taken with the same slit pattern and exposure sequence. The offset (rogue) positions were used for sky subtraction. The rogue sky position is at RA=13:25:15.7 (Epoch 2000) DEC=-42:55:13, approximately 6′north of the nucleus and sufficiently far away that little emission from the galaxy was seen in the previously observed broad band IRAC and MIPS images.
2.1 SL observations
We mapped in the short low (SL) module of the Infrared Spectrograph using slit overlaps of 25″1.85″using a 60s ramp. One data set covers map positions (through the guaranteed time observer program; GTO), and the other two cover map positions (through the guest observer program; GO). Both maps were observed by the SST on Mar 13, 2007. Spectral cube assembly, including background subtraction, bad pixel removal, spatial regridding and calibration was done using the software package CUbe Builder for IRS Spectra Maps, (CUBISM)11 1 http://ssc.spitzer.caltech.edu/archanaly/contributed/cubism/ (Smith et al. 2007b) producing a single spectral cube.
2.2 LH observations
We mapped in the long high spectral resolution (LH) module of the Infrared Spectrograph using slit overlaps of 10″4.5″, so that central positions in the map were covered by four slit positions. We used a 60s ramp, and each observation contained 2 cycles. For central map positions, this corresponds to a 480s on source integration time. Two data sets (guest observer; GO) were taken covering 620 map positions. The third (guaranteed time observer; GTO) data set covers map positions. All three maps were observed by the SST on Aug 1, 2006.
Data reduction of the three LH spectral data sets involved bad pixel removal, spectral extraction, spatial regridding, and application of the slit loss correction. For descriptions of the software procedures used see Appendix A by Neufeld et al. 2006. The resulting three data cubes were then resampled onto the same spatial grid and averaged into a single cube, resulting in 1440s on source exposure times for central positions in the map.
2.3 Continuum morphology in the spectral cubes
We have extracted continuum images from both spectral cubes to check that they are consistent with previous broad band imaging and to bring attention to features noted in previous studies (Quillen et al. 2006b; Quillen et al. 2006a) and that we will discuss below.
In Figure 1 we show the morphology of the continuum emission in m wide bands centered at 25m and 32m from the long-high spectral cube. We chose these regions so as to be free from artifacts caused by order separation and emission lines. The morphology at 25m is consistent with the morphology seen in the broad band MIPS m image previously presented by (Quillen et al. 2006b). The broad band of emission approximately 30″wide, and stretching approximately along the east-west direction across the galaxy nucleus we refer to as ‘the parallelogram’ (see figure 3 by Quillen et al. 2006b). The parallelogram shape is due to folds in a thin dusty warped disk. The warped disk is also rich in molecular gas (Quillen et al. 1992) and so is the site of most active star formation present in the galaxy.
In the SL spectral cube, broad and prominent dust emission features are present. These dust emission features are generally attributed to polycyclic aromatic hydrocarbons (PAHs). These dominate the broad band emission in the IRAC broad band images previously studied (Quillen et al. 2006a; Quillen et al. 2006b) except possibly at the nucleus. In Figure 2 we show the morphology of the peak of the m dust emission feature extracted from the SL spectral cube. This map also shows the parallelogram shape or star forming disk seen in the IRAC band images. Above and below the parallelogram we can see the shell-like bipolar structure described by Quillen et al. 2006a that was most prominent in the IRAC m image. This shell has a major axis of , a minor axis of and position angle of approximately (Quillen et al. 2006a). The IRAC 8.0m band image is dominated by the PAH dust emission feature at 7.7m and so it is not surprising that the 11.3m image shows similar morphology. We show an image at 11.3m here because it most clearly reveals the dust shell. The morphology at 7.7m and other PAH emission features and their ratios will be discussed in more detail below. In the next section we will compare the morphology in line emission maps to that seen in continuum (Figure 1) and in the dust emission features.
In the m continuum image (Figure 1a) three peaks in the emission are seen, 2 to the west of the nucleus, one to south-east. A weaker but fourth is located directly east of the nucleus. These are labeled with arrows on the 24m image in Figure 2 by Quillen et al. 2006a. We bring these to the attention of the reader as we extract spectra from these higher surface brightness regions to represent conditions typical of the star forming disk. We will show that spectra extracted from regions above or below the parallelogram region differ from those extracted from the star forming disk or parallelogram shaped region.
3 Emission Line Maps
Line emission images were created by summing emission near the line peak and subtracting nearby continuum. These images are shown in Figures 3 – 5 for lines present in the long wavelength spectral data cube and in Figures 8 – 11 for lines or dust emission features present in the SL spectral data cube. Line identifications and rest frame wavelengths are summarized in Table 1.
3.1 Morphology associated with the star forming warped disk
The lines [SiII](m) and [SIII](m) (as displayed in Figure 3) are strong in the parallelogram or star forming disk, as would be expected from the presence of HII regions in this disk. Peaks in these maps are approximately coincident with peaks seen in the nearby continuum at m (Figure 1b). The [FeII](m) and [FeIII](22.93m) lines are also detected in the same region with [FeIII] weaker than [FeII] (Figure 4). Molecular hydrogen in the H2S(0)–0(m) line is also detected associated with star formation in the warped disk or parallelogram (Figure 5) though the morphology in this line differs from that seen in the [SiII], [SIII], and [FeII] lines. The northwestern and southeastern ridges of the parallelogram are stronger than the southwestern and northern ridges. The northwestern and southeastern ridges also seem to be brighter in the [FeII] map.
The emission lines present in the long wavelength spectral cube are clearly associated with the disk, however there are differences between these maps and the nearby continuum. There is more structure seen in the [SIII] map than present in nearby continuum at 32m; peaks in the disk are brighter than the surrounding emission in the parallelogram (compare Figure 3 to 1b). Quillen et al. 2006a suggested that the 4 peaks in the broad band m images were due to a superposition of the shell and the star forming disk. However the emission lines at long wavelengths are not detected in the vicinity of the shell-like structure but do display the four emission peaks (particularly the [SIII] line image). Therefore that explanation for the 4 peaks seen at 24m is probably incorrect. Those peaks were not predicted by the warped disk model presented by Quillen et al. 2006b. The peaks are symmetrical about the nucleus suggesting that they are due to projection of a warped disk and that improvements in the warp model might succeed in accounting for them. If this were the case then the size of the peaks should be similar in the continuum and line emission. Unfortunately the peaks are more prominent in some of the lines (e.g., [SIII]) than the nearby continuum. Spiral structure in the warped disk could cause particular regions in the disk to exhibit higher levels of star formation and could maintain the reflective symmetry. If this were the case then variations in the observed morphology between lines and continuum would require a model in which the strength of spiral structure depends on wavelength.
3.2 [NeII] emission associated with the dust-shell
The [SIII], [SiII] and [FeII] emission are primarily confined to the warped disk (or parallelogram shape). However the [NeII](12.8m) image (see Figure 11) does show faint levels of emission (at the level of erg cm-2s-1SR-1) associated with the dust shell. This line is blended with the nearby 12.7m dust emission feature, nevertheless the shape of the spectrum at different locations suggests that [NeII] dominates the dust emission and is present above and below the galaxy disk. If so then the [SIII], [SiII] and [FeII] emission associated with the dust shell is just too faint to see in the long wavelength spectral cube. Deeper observations at longer wavelengths or higher spectral resolution short wavelength infrared observations would be needed to confirm the presence of ionized gas in the shell. A spectroscopic study at visible band wavelengths would be quite sensitive as extinction is probably not high in the shell region above and below the parallelogram.
3.3 Morphology associated with higher ionization lines, [OIV] and [NeV]
Lines requiring higher ionization, [OIV](m) and [NeV](m), are also detected in the LH spectral cube and they exhibit different morphology than the lower ionization lines. Emission from [OIV] and [NeV] is strong along position angles of and from the nucleus and is resolved at locations outside the nucleus; see Figure 6. These position angles are within 15∘ of the jet axis, though the jet is seen prominently only on the north-east side in radio emission. The radio and X-ray jets in this region have a position angle of (Burns et al. 1983; Kraft et al. 2000). In figure 7 we show contours of radio continuum at 5 GHz by Hardcastle et al. 2006 overlayed on the [OIV](m) emission map (shown in grayscale). We find that the position angle of the [OIV] differs from the jet axis by . The different between the axis of the [OIV] emission and radio jet axis is perhaps not surprising. Observations of Seyfert galaxies have found that the jet axis can differ from that of an ionization cone (NGC 1068, for example).
High angular resolution observations of the central few arcseconds of Centaurus A have revealed elongated or cone-shaped emission in Pa, Pa and [FeII](1.26m) north of the nucleus that has been interpreted in terms of a rotating disk, rather than in terms of an ionization cone (Schreier et al. 1998; Krajnovic et al. 2005). The jet axis lies on the western side of the possible ionization cone seen in [FeII](1.26). The [OIV] and [NeV] extension to the north of the galaxy nucleus are approximately oriented in the same direction as the cone seen in [FeII](1.26m) shown by Krajnovic et al. 2005. As there is no cone feature seen in the near-infrared [FeII] observations south of the nucleus (likely because the band of absorption caused by the warped disk) it is more difficult to compare the cone to the [OIV] emission south-west of the nucleus. The [OIV] emission north and south of the nucleus are not apart and the emission south-west of the nucleus would not overlay the [FeII](1.26) possibly ionization cone if rotated by .
It is interesting to reinspect the morphology of the lower ionization line maps at the position of the peak in [OIV] south west of the nucleus. An extension in the contours of the [SIII], [SiII], [FeII] [FeIII] and H2S(0) emission line brightness is seen at the same location as the peak south-west of the nucleus in the [OIV] map. The ratio of the surface brightness in the extension compared to that in the disk is higher in the [FeIII] line compared to the [FeII] line. This is not surprising as we know these extensions contain higher ionization species such as [NeV].
The spectral resolution in the LH spectral cube (a spectral resolution of corresponds to a velocity resolution of km/s) is sufficiently high that we can just barely see the galactic disk’s rotation in the brighter lines (e.g., [SIII], [SiII] and H2S(0)), with the western and eastern sides of the disk redshifted or blueshifted, respectively, compared to the system velocity. We inspected the channels near the line centers and searched for evidence of structure in the radial velocity distribution. We found no clear evidence for a significant (greater than km/s) red or blue shift in the [OIV] emission extensions compared to the system velocity. We also saw no clear evidence for an increase in line width. The line width (FWHM) must be smaller than the galactic rotation full width or km/s. Near the [OIV] peak south-west of the nucleus the extensions in the contours of the [SIII], [SiII], and H2S(0) also appear to have velocities within 200km/s of the system velocity. Unfortunately the spectral resolution is just not high enough to be certain about these line widths or allow a search for structure in the radial velocity distribution.
3.4 Emission from molecular hydrogen
In the SL spectral cube we detect four pure rotational molecular hydrogen lines, the S(7)–5, the S(5)–3, the S(3)–1 and the S(2)–0 lines. We show the continuum subtracted line emission maps for the H2S(5)(6.909m) and H2S(3)(9.665m) lines in Figure 8. The S(7) is weak and the S(2) strongly blended with dust emission features so we have only presented line emission maps from the other two lines. The S(4) line at 8.0251m was not detected, probably due to the bright dust emission feature at 7.7m at its expected wavelength and because the even number transitions are singlets rather than triplets and so have one third the number of states. The S(1) line at 17.03m was not detected because it lies outside the spectral range covered by the SL and LH modules. To observe this line we would have needed observations with the SH module of the Infrared Spectrograph.
The morphology of the higher S(3) and S(5) rotational molecular hydrogen lines differs from that we see at longer wavelengths in the S(0) line at 28m (compare Figure 5 to Figure 9). The S(0) line is primarily associated with the star forming disk, however the S(3) and S(5) lines are seen above the disk. An overlay of the H2S(3)(9.665m) line and [OIV](25.89m) in Figure 9a shows that the peak in the [OIV] south-west of the nucleus coincides with the peak H2S(3) surface brightness in the same region. An overlay shown in Figure 9b of the S(3) line with the dust emission in the 11.3 PAH emission feature (previously shown in Figure 2) shows that the warmer molecular hydrogen gas (traced by the higher S pure rotational transitions) is near the dust shell. The simplest explanation for the morphology is that warmer molecular hydrogen is associated with the dust shell but that there is additional excitation of the shell material near the jet axis. Constraints on the column depth and temperature of the molecular hydrogen are discussed below in section 5.
3.5 Colors in the dust-shell compared to the warped disk
In Figure 10 and Figure 11 we show maps of continuum emission at the peak of the 7.7, and 8.6m dust emission features and the [NeII]12.81m line. We did not subtract continuum from these maps as the [NeII] line and dust emission feature are 3-8 times brighter than the continuum. As expected, the [NeII] line and dust emission features primarily trace the star forming regions in the warped disk. Fainter levels of emission arise from the dust shell above and below the disk and from the region that is bright in [OIV] emission (25″south west of the nucleus). In Figure 12 we show ratios of the 7.7m and 11.3m surface brightness and the ratio of the [NeII]12.8 and 11.3m surface brightness. Both of these ratios exhibit variations across the galaxy, with the lowest values in the dust shell and higher values present in the star forming disk. Subtraction of the continuum made little difference in the morphology of the ratio maps because the lines and dust emission features are over twice as strong as the continuum.
Smith et al. 2007 found a correlation between the 7.7/11.3m ratio of dust emission complexes and the [NeIII](15.6)/[NeII](12.8m) ratio in star forming galaxies. They also noted that the galaxies with low 7.7/11.3 complex ratios were more likely to be classified as LINERS or Seyferts. They suggested that the 7.7m/11.3m ratio is an indicator of the hardness of the radiation field. The [NeIII](15.6m) line lies is outside the wavelength coverage of the SL module so we cannot use that ratio to probe the radiation field above the disk. At the nucleus in Cen A, this line was detected but was not strong (Weedman et al. 2005). We do have higher ionization tracers in the the [OIV](25.9m) and [NeV](24.3m) lines. However, the morphology in those lines differs from that we see in the the 7.7 to 11.3m ratio map. The [OIV] line is bright near the jet axis whereas whereas the 7.7/11.3 ratio is low in the dustshell (see Figure 12). The lack of change in the 7.7/11.3 ratio in the region containing [OIV]25.9 and [NeV]24.3 emission near the jet axis makes it difficult to interpret variations in the 7.7/11.3 ratio purely in terms of hardness of radiation field. Since the 7.7/11.3 ratio drops in the vicinity of the dust shell and this is where we detect warm molecular gas we might instead consider models in which PAH emission is affected by the presence of warm gas or the physical process that is responsible for heating the warm gas. We could also consider models where this ratio is affected by the ambient radiation field strength.
4 Spectra
We have extracted spectra at various positions in the star forming disk from the LH spectral cube and these are shown in figure 14a. Spectra were extracted from 7″square regions centered at 5 regions. 4 of these correspond to peaks evident in Figure 3 excluding the nucleus. From bottom to top the spectra shown in Figure 14a were extracted from regions centered at RA=13:25:25.8, DEC=-43 00 52 (peak to the west and north of the nucleus), RA=13:25:25.9, DEC=-43:01:09 (peak west of the nucleus), RA=13:25:29.5, DEC=-43:01:27 (south-east of the nucleus), RA=13 25 29.5, DEC=-43:01:10 (peak east of the nucleus), and RA=13:25:28.6, DEC=-43:01:23 (peak south-east of the nucleus).
We also extract an LH spectrum along the jet axis at the peak shown in Fig.14b. This spectrum was extracted over a 11″square region centered at RA=13:25:25.7, DEC=-43:01:24, at the peak in the [OIV] emission south-west of the nucleus (see figure 6). The lines we have detected from these spectra are listed in Table 1. Line fluxes measured from this region are listed in Tables 2 and 3.
We see only minor differences in different regions of the parallelogram (see Figure 14). However, along the jet axis there are deviations in the spectra, in the relative strengths of the lines requiring higher levels of ionization, [OIV](m) and [NeV](m), compared to those requiring lower levels (e.g., [SiII](m) ,[SIII](m)). To produce the emitting ion from the preceding ionization state, [OIV] requires an ionization energy of 54.0ev where as [NeV] requires 97.1ev. A harder UV radiation field most naturally accounts for these species.
In the SL spectral cube we extracted a spectrum from the same bright region along the jet axis south-west of the nucleus as that shown in Figure 14b and from a representative region in the parallelogram representing the star forming disk. The spectrum representing the star forming disk was extracted from a position centered at RA=13:25:25.9, DEC=-43:01:09. The location is the same as that for the second from bottom spectrum shown in Figure 14. The two spectra extracted from the SL spectral cube are shown in Figure 13.
As can be seen from Figure 13a the star forming region exhibits little molecular hydrogen emission in the higher S rotational lines. However, the S(2), S(3), and S(5) lines are detected near the jet axis and above the disk near the dust shell (see Figure 13b). The S(7) line is barely detected at 5.511m. The S(4) line at 8.0241 is not detected likely because it has been overpowered by the dust emission feature at 7.7m. Likewise the S(6) line at 6.1086m is not detected as it would have been overpowered by the dust emission feature at 6.2m. The S(5) line is detected above the disk but not in the star forming region at 6.909m (Figure 13b). At almost the same wavelength the [ArII] line at 6.985m is seen in the star forming disk. The spectra are sufficiently high spectral resolution that we can differ between the two lines. A comparison between the two spectra also shows that the relative heights of the 7.7 and 11.3m dust emission features differs. These two dust emission features are approximately the same height in the star forming disk. However the 11.3m emission feature is twice as bright as the 7.7m dust emission feature in the dust shell. The [NeII](12.81m) and dust emission feature at 11.3m are also similar in height in the star forming region but the 11.3m is almost twice as bright as [NeII] above the disk. These changes are reflected in the ratio maps shown in Figure 12 and discussed in section 3.
There is a weak feature near 14.2m in both spectra from the star forming disk and jet region (Figure 13a,b). The shape of the spectra are similar in shape at 14.2m suggesting that this feature is a dust emission feature rather than due to emission from [NeV](14.3m). A higher spectral resolution spectrum would be required to detect this line. Weak [NeV](14.3m) emission was detected in the SH spectrum of the nucleus (Weedman et al. 2005).
5 Line ratios
We have measured line fluxes from the spectra shown in Figures 14b and 13b which were extracted at the location of the [OIV] peak south-west of the nucleus. Table 2 lists the fluxes of the emission lines from ions and Table 3 lists the fluxes of the pure rotational molecular hydrogen transitions. Line fluxes were measured from the 3 spectral cubes in the same aperture using continuum fitting and subtraction routines available in CUBISM. We have used CUBISM to measure line fluxes for the LH spectral cube even though the images (displayed in our figures) show the spectral cube reduced with the software described by Neufeld et al. 2006. This spectral cube had fewer artifacts than the one produced by CUBISM, however the artifacts in the CUBISM reduced LH spectral cube should not have affected the measured line fluxes as we were able to choose where to measure the continuum and line emission. Also the same software package was used to measure all line fluxes to check and ensure consistency in the calibration between the spectral cubes.
5.1 Molecular hydrogen emission
Pure rotational transitions of molecular hydrogen in the mid-infrared (between 3 and 20m) are a major coolant of of warm gas in the temperature range 100-1000K (Neufeld & Kaufman 1993). Higher S pure rotation molecular hydrogen lines have previously been detected in extragalactic objects. Higdon et al. 2006 detected pure rotational lines from ULIRGS including the S(7) line in a few objects. Panuzzo et al. 2007 detected these lines in the elliptical galaxy NGC 4435 that is experiencing an off-center encounter with a nearby galaxy. This galaxy hosts a dusty disk as seen from visible band HST images and ongoing star formation at modest rate of yr. Roussel et al. 2007 observed warm gas in the centers of nearby galaxies with LINERs and Seyferts having warmer H2 emitting in the excited states or higher S transitions. The above studies did not resolve the H2 emission or did not study its morphology. Higher angular resolution near infrared studies have found emission from molecular hydrogen in vibrational transitions in active galaxies. In some Seyferts this emission is resolved on 100pc or larger scales (e.g., Quillen et al. 1999; Davies et al. 2005) in others rotation is seen near the massive black hole (e.g., Hicks & Malkan 2007).
The flux of a pure rotational transition can be written where is Planck’s constant, is the speed of light, is the wavelength of the transition, is the Einstein A-coefficient, is the solid angle and is the column density of the initial quantum state. Since we are consider pure rotational transitions the rotational quantum number change is , the vibrational quantum number change is , and .
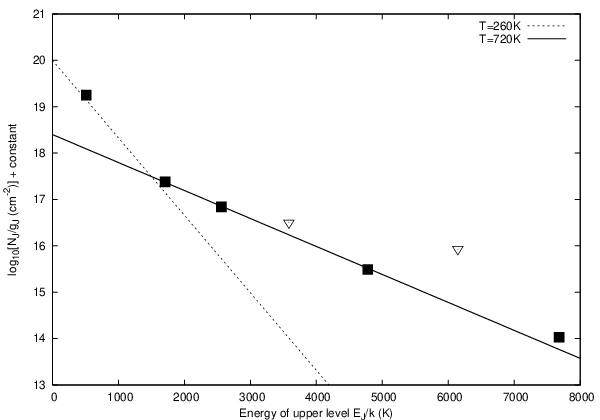
Assuming local thermal equilibrium, the fraction of molecules in the th state is where is the partition function. Here is the statistical weight of the state or times 1 or 3 for the even and odd states, respectively. To estimate the temperature of the warm molecular hydrogen we make an excitation diagram plotting the energy of the initial state versus a constant. The excitation diagram is shown in Figure 15. On such a plot a single temperature gas with temperature would have points with slope equal to . We have chosen to plot using rather than the natural log so that the -axis gives an estimate for the column density of the states.
Figure 15 shows that a single temperature model does not fit all data points. This is not unexpected as other extragalactic objects also require multi-temperature models (e.g., Higdon et al. 2006; Panuzzo et al. 2007; Roussel et al. 2007; Ogle et al. 2007). The points lie along a line for initial states higher than implying that the higher rotational level populations are close to LTE. The S(2) and higher lines are fit with a temperature of . The S(0) and S(2) line are connected with a slope corresponding to a temperature of . Had we subtracted the warmer component, a somewhat lower temperature would have been measured. Unfortunately our spectra do not cover the S(1) line. This would have helped in making a 2 component model. It is unlikely that there is a strong deviation from thermalization of ortho levels with para levels as the S(2) point lies along the same line as the S(3), S(5) and S(7) points in the excitation diagram.
The column density corresponding to the above excitation model is cm-2 for the cooler molecular component () and cm-2 for the warm component (). The column densities are similar to those measured in the nuclei of nearby galaxies by Roussel et al. 2007 and in supernova remnants where blast waves encounter molecular clouds (Neufeld et al. 2007). The temperatures of the two components we measure are higher than most of those measured by Roussel et al. 2007 for most nearby galaxy centers excepting the LINERS and Seyfert galaxies, but lower than the supernova remnants (Neufeld et al. 2007) and ULIRGs with two temperature models (Higdon et al. 2006). The fraction, , in the warmer component (that at 720K compared to that at 260K) is higher than that measured for the ULIRGS with 2 component temperature models and most but not all the galaxies studied by Roussel et al. 2007 but similar to that measured from the supernova remnants (Neufeld et al. 2007). The physical conditions in Cen A’s dustshell are most closely matched by the supernovas studied by Neufeld et al. 2007.
As we have discussed from the images, the molecular hydrogen emission in the higher S lines arises from the dust shell and along the jet axis, though that in S(0) is associated with the disk and so is probably from with photodissasociation regions (PDRs) associated with star formation. We did not clearly detect the higher S lines in the disk suggesting that the molecular hydrogen at the hotter temperature is primarily excited in the vicinity of the dust shell or along the jet axis. The column density of cooler molecular hydrogen is similar to that estimated in the dustshell by Quillen et al. 2006a from the shell surface brightness. This suggests that gas associated with the dust shell has been heated, in the shell and more so near the jet axis. There is probably more than one excitation process as [OIV] and [NeV] emission are detected primarily along the jet axis whereas the higher S pure rotational molecular hydrogen lines are detected there and in the vicinity of the dust shell.
5.2 Excitation near the jet axis
Nebular emission lines can constrain the the spectrum of the energy powering the emission. Our spectra allow us to make use of the following line ratios: [OIV]/[SIII]m, and [OIV]25.9/[NeII]12.8m. We do not detect [NeV] at m so we will discuss limits on the ratios [NeV]14.3/[NeII]12.8m and [NeV]14.3/[NeV]24.3m.
We measure [OIV]/[SIII]m at the [OIV] peak. This ratio is most similar to those of the AGNs considered by (Genzel et al. 1998) (see their figure 3). However we have failed to detect a significant [NeV] line at 14.3m so we estimate a limit on [NeV](14.3)/[NeII](12.8) . Ratios this low are more similar to starbursts than AGNs. We note that the ratio we measure in this region [OIV]25.9/[NeII]12.8 is lower than expected from the [OIV]25.9/[SIII]33.5 ratio using Genzel et al.’s corrective factor of 1.7. Our estimated [OIV]25.9/[NeII]12.8 ratio places the emission along the jet axis more similar to ULIRGs than AGNs. [OIV]25.9/[NeII]12.8 is expected to be approximately 1 for AGNs (Genzel et al. 1998, Figure 3a and Figure 7 by Sturm et al. 2002). Our low estimated ratios of [NeV]14.3/[NeII]12.8m and [OIV]25.9/[NeII]12.8m compared to those expected in AGNs may in part be due to the blending of the [NeII]12.8 emission with dust emission features which may have caused us to overestimate the [NeII](12.8m) line strength.
We don’t detect [NeV](14.3m) or [NeVI] at 7.6m and we do detect [NeV](24.3m). By comparing upper limits of ratios of these lines with [OIV](25.9) and [NeV](24.3m) and Figure 4 by Sturm et al. 2002 (based on models by Spinoglio et al. 2000) we infer the emitting region is likely to have low ionization parameter . Our estimated upper limit in the ratio of [NeV]14.3/24.3 of in the jet region and a comparison of Figure 3 by Alexander et al. 1999 suggests that the electron density is also low cm-3. The detection of [NeV] suggests that a hard radiation field is illuminating the dust shell near the jet axis. However we have failed to detect [NeV](14.3m) or [NeVI](7.65m) suggesting that the illuminated region is low density and has a low ionization parameter. The difference in the physical conditions compared to those expected in narrow line regions might account for the discrepancy between the [OIV]25.9/[NeII]12.8 and [OIV]25.9/[SIII]33.5 ratios compared to those seen in AGNs.
We consider the possibility that the low electron density and ionization parameter are consistent with illumination of a region distant from the nucleus by hard radiation from the central AGN. The position of the [OIV](25.9m) peak corresponds to a distance pc from the nucleus. The active nucleus is estimated to have a bolometric luminosity of erg/s (Whysong & Antonucci 2004). The ionization parameter, , for isotropic emission is where is the speed of light, is the ionizing photon emission rate (photons per second) and is the gas density (in cm-3). Assuming a mean energy for ionizing photons of 100ev (the estimated energy of the UV bump and hard enough to produce NeV from the preceding ionization state) at the estimated bolometric luminosity emitted isotropically into radians,
This estimate illustrates that a low ionization parameter, low density medium (such as we infer from the line ratios) is the only situation that we might expect at a distance of 400 pc from the AGN.
We now ask: can the AGN nucleus provide enough UV photons to account for the flux of the [OIV] emission 25″from the nucleus? We summed the [OIV](25.9m) flux in a 15″wide region centered on the [OIV] emission peak, estimating a flux of erg cm-2 s-1 in the line. This flux corresponds to a luminosity in [OIV] of erg/s. We can compare the [OIV] luminosity to the mid-infrared luminosity as have Sturm et al. 2002 for other objects. Since the [OIV] flux is illuminated only in a small solid angle from the nucleus we must first estimate the fraction of UV luminosity that could be causing the [OIV] emission. The [OIV] emission comes from a region that is about 10″wide. As viewed from the position of the nucleus, this corresponds to a solid angle of or % of steradians. Thus we compare the [OIV] luminosity to 1% of the mid-infrared luminosity. The mid-infrared luminosity of the AGN is erg s-1 (Whysong & Antonucci 2004). Consequently we estimate that the ratio of the [OIV] to 1% of the mid-Infrared luminosity is . This ratio is similar to that seen for the brighter Seyferts studied by Sturm et al. 2002 (see their Figure 12). We conclude that as long as they are not absorbed before they run into the dust shell, UV photons from the AGN can account for the [OIV] and [NeV] emission near the jet axis. An additional power source (like shocks associated with the jet) is not necessarily required to account for the high ionization species seen near the jet axis but distant from the nucleus. If UV photons from the AGN are responsible for the high ionization species then the column depth along the sight line between the AGN and dust shell must be low. If a blast wave is responsible for sweeping up the dust shell, as proposed by Quillen et al. 2006a, then it could also be responsible for evacuating material between the AGN and the dust shell.
6 Summary and Conclusion
We have carried out a spectroscopic study of the central 2 arcminutes of Centaurus A using short low and long high spectral modules of the Infrared Spectrograph on board the Spitzer Space Telescope. Most of the emission lines detected in the spectral cubes (e.g., [SIII](33.5m), [SiII](34.8), [FeII](26.0), [FeIII](23.9), [ArII](6.98) and H2S(0)(28.2)) and dust emission features primarily trace regions of star formation in the warped disk.
Our previous study based on IRAC and MIPS imaging suggested that Centaurus A hosts an oval or bipolar dustshell at a distance approximately 500 pc from the nucleus seen above and below the warped disk. This dust shell, if confirmed, would be the first extragalactic shell to be discovered in the infrared. Here we see the dust shell even more clearly and prominently in the 11.3m dust emission feature than we saw previously in the broad band IRAC images. We have found variations in the dust emission feature 7.7m/11.3m ratio and dust 11.3m/[NeII](12.8) ratio, with the oval dust shell having the lowest ratios compared to the star forming disk. The clearer shell morphology at 11.3m than previously seen in broad band images, the association of the molecular hydrogen emission in the shell, and the variation in line ratios in the shell compared to those in the disk, confirm spectroscopically that the shell discovered previously (Quillen et al. 2006a) is a separate coherent entity and is unlikely to be a chance superposition of dust filaments.
We find evidence for higher ionization species line emission in [NeV](m) and [OIV](m) near the jet axis. Emission in these two lines is seen both north-east and south-west of the nucleus along position angles and . These angles are similar to but not exactly the same as the jet axis at 55∘ as seen at 5GHz. Outside the nucleus, the peak surface brightness in these lines is 25″or 400 pc south-west of the nucleus. Emission line ratios and limits at the location of the [OIV] peak suggest that the emitting region is at low ionization parameter, , and has low electron density, cm-3. We crudely estimate that the AGN can provide sufficient UV photons to account for the [OIV] luminosity 400 pc from the nucleus, as long as UV photons are not absorbed by intervening material as they travel from the AGN to the dust shell. A much more detailed photo-ionization study is required to understand the excitation of the [OIV] and [NeV] emission. Previous reports of an ionization cone in Cen A were based on near-infrared imaging of the central few arcseconds (Bryant & Hunstead 1999). Subsequent studies interpreted line emission in terms of a disk rather than ionization cone (Schreier et al. 1998; Krajnovic et al. 2005). Unfortunately the morphology of the near-infrared images is strongly affected by extinction and the warp disk models have not been good enough to accurately predict the extinction in the central few arcsecond of the nucleus. Cen A might be the only active galaxy in which mid-infrared spectroscopy has found evidence for high ionization species such as NeV at hundred pc distances from the nucleus. As far as we know Cen A hosts the only ionization cone that has been resolved with observations from the Spitzer Space Telescope.
We see evidence for warm molecular hydrogen coincident with the peak in [OIV] in the odd pure rotational odd transitions S(3) and S(5). The S(7) and S(2) transitions are also detected but at weaker levels. The S(3) and S(5) emission also lies in the vicinity of the dust shell that is most prominent in the 11.3m dust (PAH) emission feature. A two temperature component model can fit the rotational line ratios and implies that there is warm molecular hydrogen with temperatures in the range 250–720K. The temperatures are warmer than seen in nucleus of non-active nearby galaxies, similar to those of LINERS and Seyferts but lower than exhibited by supernova remnants ULIRGS (as compared to studies by Roussel et al. 2007, Higdon et al. 2006 and Neufeld et al. 2007). Near the jet axis, the column depth of warm molecular hydrogen is cm-2 similar to that estimated from the infrared continuum emission of the dust shell by Quillen et al. 2006a. This suggests that gas associated with the dust shell has been heated near the jet axis. There is probably more than one excitation process as [OIV] and [NeV] emission are detected primarily along the jet axis whereas the higher S pure rotational molecular hydrogen lines are detected there and in the vicinity of the dust shell.
Previous studies of the pure-rotational molecular hydrogen lines in extra-galactic objects (e.g., Higdon et al. 2006; Panuzzo et al. 2007; Roussel et al. 2007; Ogle et al. 2007) have not well resolved the emission. The association of the warm molecular hydrogen gas with a shell is most similar to phenomena exhibited by Galactic supernova remnants where the blast wave encounters molecular clouds (Neufeld et al. 2007). The physical conditions estimated from the molecular hydrogen observations are similar in properties (column depth, temperatures and fraction of gas in the two temperature components) to the parameters estimated by Neufeld et al. 2007 in 4 Galactic supernova remnants. This suggests that theory of interstellar shock waves be applied to interpreting observations of the shell. Neufeld et al. 2007 associates the warmer molecular hydrogen component responsible for the higher S pure rotational transitions with dissociative shocks. These require shock velocities km/s (e.g., Draine & McKee 1993). A physical scenario and model accounting for the shell’s structure and energetics is currently lacking. Deep optical spectroscopic and radio studies are particularly needed to better constrain gas motions and physical conditions in this shell.
We thank Dan Watson, Paul van der Werf, Ralph Kraft, Jacqueline van Gorkom, Martin Hardcastle, and Christine Jones-Forman for helpful discussions and correspondence. We thank Martin Hardcastle for providing us with images of Centaurus A in the radio. Support for this work was in part provided by by NASA through an award issued by JPL/Caltech, National Science Foundation grants AST-0406823 PHY-0552695, the National Aeronautics and Space Administration under Grant No.NNG04GM12G issued through the Origins of Solar Systems Program, and HST-AR-10972 to the Space Telescope Science Institute. JBH is funded by a Federation Fellowship from the Australian Research Council.


References
- Alexander et al. (1999) Alexander, T., Sturm, E., Lutz, D., Sternberg, A., Netzer, H., & Genzel, R. 1999, ApJ, 512, 204
- Bland et al. (1987) Bland, J., Taylor, K., & Atherton, P. D. 1987, MNRAS, 228, 595
- Bland (1986) Bland, J. 1986, Ph.D. thesis, Univ. Sussex
- Buchanan et al. (2006) Buchanan, C. L., Gallimore, J. F., O’Dea, C. P., Baum, S. A., Axon, D. J., Robinson, A., Elitzur, M., & Elvis, M. 2006, AJ, 132, 401
- Bryant & Hunstead (1999) Bryant, J. J., & Hunstead, R. W. 1999, MNRAS, 308, 431
- Burns et al. (1983) Burns, J. O., Feigelson, E. D., & Schreier, E. J. 1983, ApJ, 273, 128
- Clarke et al. (1992) Clarke, D. A., Burns, J. O., & Norman, M. L. 1992, ApJ, 395, 444
- Davies et al. (2005) Davies, R. I., Sternberg, A., Lehnert, M. D., & Tacconi-Garman, L. E. 2005, ApJ, 633, 105
- Draine & McKee (1993) Draine, B.T., & McKee, C. F. 1993, ARA&A, 31, 373
- Eckart et al. (1990) Eckart, A., Cameron, M., Rothermel, H., Wild, W., Zinnecker, H., Rydbeck, G., Olberg, M., & Wiklind, T. 1990, ApJ, 363, 451
- Genzel et al. (1998) Genzel, R., et al. 1998, ApJ, 498, 579
- Gorjian et al. (2007) Gorjian, V., Cleary, K., Werner, M. W., & Lawrence, C. R. 2007, ApJ, 655, L73
- Hardcastle et al. (2006) Hardcastle, M. J., Kraft, R. P., & Worrall, D. M. 2006, MNRAS, 368, L15
- Hicks & Malkan (2007) Hicks, E. K. S., & Malkan, M. A. 2007, ApJ, in press
- Higdon et al. (2006) Higdon, S. J. U., Armus, L., Higdon, J. L., Soifer, B. T., & Spoon, H. W. W. 2006, ApJ, 648, 323
- Israel (1998) Israel, F. P. 1998, A&ARv, 8, 237
- Kraft et al. (2003) Kraft, R. P., Vazquez, S. E., Forman, W. R., Jones, C., Murray, S. S., Hardcastle, M. J., Worrall, D. M., & Churazov, E. 2003, ApJ, 592, 129
- Kraft et al. (2000) Kraft, R. P., et al. 2000, ApJ, 531, L9
- Krajnovic et al. (2005) Krajnovic, D., Sharp, R., & Thatte, N. 2006, MNRAS, in press, (astro-ph/0610371)
- Mirabel et al. (1999) Mirabel, I. F., et al. 1999, A&A, 341, 667
- Neufeld & Kaufman (1993) Neufeld, D.A., & Kaufman, M.J. 1993, ApJ, 481, 263
- Neufeld et al. (2006) Neufeld, D. A., Green, J. D., Hollenbach, D. J., Sonnentrucker, P., Melnick, G. J., Bergin, E. A., Snell, R. L., Forrest, W. J., Watson, D. M., & Kaufman, M. J. 2006, ApJ, 647, L33
- Neufeld et al. (2007) Neufeld, D. A., Hollenbach, D. J., Kaufman, M. J., Snell, R. L., Melnick, G. J., Bergin, E. A., & Sonnentrucker, P. 2007 ApJ, 665, 890
- Nicholson et al. (1992) Nicholson, R. A., Bland-Hawthorn, J., & Taylor, K. 1992, ApJ, 387, 503
- Ogle et al. (2007) Ogle, P., Antonucci, R., Appleton, P. N., & Whysong, D. 2007, ApJ, in press, astro-ph:arXiv0707.0896O
- Oliva et al. (1999) Oliva, E., Moorwood, A. F. M., Drapatz, S., Lutz, D., & Sturm, E. 1999, A&A, 343, 943O
- Panuzzo et al. (2007) Panuzzo, P., Vega, O., Bressan, A., Buson, L., Clemens, M., Rampazzo, R., Silva, L., Valdes, J. R., Granato, G. L., & Danese, L. 2007, ApJ, 656, 206
- Quillen et al. (2006b) Quillen, A., Brookes, M. H., Keene, J., Stern, D., Lawrence, C. R., & Werner, M. W., 2006, ApJ, 645, 1092
- Quillen et al. (2006a) Quillen, A. C., Bland-Hawthorn, J., Brookes, M. H., Werner, M. W., Smith, J. D., Stern, D., Keene, J., & Lawrence, C. R. 2006, ApJ, 641, L29
- Quillen et al. (1999) Quillen, A. C., Alonso-Herrero, A., Rieke, M. J., Rieke, G. H., Ruiz, M., & Kulkarni, V. 1999, ApJ, 527, 696
- Quillen et al. (1992) Quillen, A. C., de Zeeuw, P. T., Phinney, E. S., & Phillips, T. G. 1992, ApJ, 391, 121
- Roussel et al. (2007) Roussel, H. et al. 2007, astro-ph:2007arXiv0707.0395
- Schreier et al. (1998) Schreier, E. J., et al. 1998, ApJ, 499, L143
- Sparke (1996) Sparke, L. S. 1996, ApJ, 473, 810
- Smith et al. (2007) Smith, J. D. T., et al. 2007, ApJ, 656, 770
- Smith et al. (2007b) Smith, J. D. T., et al. 2007, in preparation
- Spinoglio et al. (2000) Spinoglio, L. Benedettini, M. DeTroia, G. et al. 2000, ISO Beyond the peaks: The 2nd ISO workshop on analytical spectroscopy, ed., A. Salama, M. F. Kessler, K. Leech, & B. Schultz ESA-SP 456, 261
- Sturm et al. (2002) Sturm, E., Lutz, D., Verma, A., Netzer, H., Sternberg, A., Moorwood, A. F. M., Oliva, E., & Genzel, R. 2002, A&A, 393, 821
- Weedman et al. (2005) Weedman, et al. 2005, ApJ, 633, 706
- Whysong & Antonucci (2004) Whysong, D., & Antonucci, R. 2004, ApJ, 602, 116
| Line | Rest Wavelength(m) |
|---|---|
| [FeII] | 5.340 |
| H2S(7)J=9-7 | 5.511 |
| Dust | 5.7 |
| Dust | 6.2 |
| H2S(5)J=7-5 | 6.909 |
| ArII | 6.985 |
| Dust | 7.7 |
| Dust | 8.6 |
| H2S(3)J=5-3 | 9.665 |
| SIV | 10.51 |
| Dust | 11.3 |
| Dust | 12.0 |
| H2S(2)J=4-2 | 12.279 |
| Dust | 12.7 |
| NeII | 12.81 |
| Dust | 14.2 |
| FeIII | 22.925 |
| NeV | 24.318 |
| OIV | 25.890 |
| FeII | 25.988 |
| H2S(0)J=2-0 | 28.219 |
| SIII | 33.481 |
| SiII | 34.815 |
The spectra in the star forming disk and jet region have the same shape near 14.2m suggesting that the feature at that wavelength is a dust emission feature (Smith et al. 2007) rather than due to emission from [NeV](14.3m). The H2S(4)J=6-4 line at 8.025m is not detected. The emission at this wavelength is dominated by nearby bright 7.7 and 8.6m dust emission features. The S(6) line at 6.1086m is also not detected as it would have been overpowered by the dust emission feature at 6.2m. The even molecular hydrogen rotation quantum states are singlets rather than triplets and so should be similar to 3 times fainter than nearby odd transitions. At the [OIV] and H2S(3) peak south-west of the nucleus the [ArII](6.985m) is weaker than the H2S(5)(6.909m) line. The opposite is true in the star forming disk. [FeII](5.3m is detected in the disk and at the OIV peak near the jet axis. The line in the middle above list denotes the break in wavelength between the SL and LH wavelength coverage.
| Line | Flux |
|---|---|
| OIV(25.9m) | 1.5 |
| NeII(12.8m) | 9.0 |
| NeV(24.3m) | 0.15 |
| NeV(14.3m) | 0.5 |
| SIII(33.5m) | 1.6 |
| SiII(34.8m) | 4.0 |
| SIV(10.5m) | 1.6 |
| FeII(26.0m) | 0.2 |
| FeIII(22.9m) | 0.05 |
| ArII(6.98m) | 0.1 |
The fluxes were measured in a square region centered at RA=13:25:25.7 DEC=-43:01:24 and 11″wide. that is a peak in [OIV] and H2S(3) emission (see figure 9). The spectra from this region are shown in Figures 14b and 13b. Fluxes are given in units of . The [NeV](14.3m) flux is an upper limit. We did not detect [NeVI] at 7.642m.
| Line | Flux |
|---|---|
| S(0)(28.2m) | 0.21 |
| S(2)(12.2m) | 1.1 |
| S(3)(9.7m) | 5.2 |
| S(4)(8.0m) | 3 |
| S(5)(6.9m) | 2.7 |
| S(6)(6.1m) | 6 |
| S(7)(5.5m) | 0.5 |