First observation of and decaying to
Abstract
The decays of and to are observed and measured for the first time, and the perturbative QCD “12%” rule is tested, based on and events collected with BESII detector at the Beijing Electron-Positron Collider. No obvious enhancement near threshold in is observed, and the upper limit on the branching ratio of is determined.
1 Introduction
Since the discovery of the at Brookhaven [1] and SLAC [2] in 1974, more than one hundred exclusive decay modes of the have been reported. According to Ref. [3], direct hadronic, electromagnetic and radiative decays make up roughly 65%, 14%, and 7% of the total decay width, respectively. However, the measured hadronic decay channels sum up to less than 35 %. The BESII data sample of 5.8 events provides a good opportunity to search for missing hadronic decays.
In 2004, BESII reported the observation of an enhancement near the threshold of the invariant mass spectrum of in decays. The mass, width, and product branching fraction of this enhancement are MeV/, MeV/ [4], and , respectively. The study of the isospin conjugate channel is therefore important not only in exploring new decay modes of but also in understanding the .
The and events at BESII also offer a unique opportunity to search for new decay modes of and and test the “12% rule” in hadronic decays. In perturbative QCD, hadronic decays of the and are expected to proceed dominantly via three gluons or a single direct photon with widths proportional to the square of the wave function at the origin, which is well determined from dilepton decays. Thus for any hadronic final state , the and decay branching fractions should satisfy the so called “12% rule” [5].
The leptonic branching fractions are taken from the particle data group (PDG) [6] tables. It is roughly obeyed for a number of exclusive hadronic decay channels except some , and channels [7][8][9], where and denote members of the pseudoscalar, vector and tensor nonets, respectively.
In this paper, the first observation and measurement of and to , as well as a test of the perturbative QCD 12% rule are presented. The and resonance structures in are also shown, where no obvious enhancement near threshold is observed. The upper limit on the branching fraction of is determined.
2 The BES Detector
The upgraded Beijing Spectrometer detector (BESII) is located at the Beijing Electron-Positron Collider (BEPC). BESII is a large solid-angle magnetic spectrometer which is described in detail in Ref. [10]. The momentum of charged particles is determined by a 40-layer cylindrical main drift chamber (MDC) which has a momentum resolution of /p= ( in GeV/). Particle identification is accomplished using specific ionization () measurements in the drift chamber and time-of-flight (TOF) information in a barrel-like array of 48 scintillation counters. The resolution is ; the TOF resolution for Bhabha events is ps. Radially outside of the time-of-flight counters is a 12-radiation-length barrel shower counter (BSC) comprised of gas tubes interleaved with lead sheets. The BSC measures the energy and direction of photons with resolutions of ( in GeV), mrad, and cm. The iron flux return of the magnet is instrumented with three double layers of proportional counters that are used to identify muons.
A GEANT3 based Monte Carlo (MC) program (SIMBES) [11] with detailed consideration of the detector performance is used. The consistency between data and MC has been carefully checked in many high purity physics channels, and the agreement is reasonable. More details on this comparison can be found in Ref. [11]. The detection efficiency and mass resolution for each decay mode in this analysis are obtained from MC simulation.
3 Analysis
The analyzed and with and (and ) final states contain four charged tracks and an undetected neutron or anti-neutron. We require the candidate events to satisfy the following common selection criteria:
- 1.
Events must have four good charged tracks with zero net charge. A good charged track is a track that is well fitted to a three-dimensional helix, originates from the interaction region and has a polar angle in the range 0.8. Because of the long decay lengths before and decay to and , the interaction region is defined as R 0.12 m and 0.3 m. Here, Rxy is the distance from the beamline to the point of closest approach of the track to the beamline, and is the distance along the beamline to this point from the interaction point.
- 2.
For each charged track in an event, is determined using both and TOF information:
=
where corresponds to the particle hypothesis. A charged track is identified as a if for the hypothesis is less than those for the or hypotheses. For the channels studied, one charged track must be identified as a or .
3.1 Measurement of
For , the and decays are reconstructed using secondary vertex fitting, and the from the decay is identified. To select [ mass selection], GeV/c2 is required, and to select ( mass selection), GeV/c2 is required. To reject the backgrounds from channels containing a but no , like e.g. , we require , the distance from the reconstructed vertex to the event origin, to be larger than 5 mm.
Figure 1 is the missing mass spectrum determined from the charged tracks in candidate events satisfying and mass selections and mm. A clear peak at the nominal neutron mass is observed. The second peak in the high missing mass region comes from and backgrounds. To suppress background and improve the resolution, a one constraint (1C) kinematic fit with a missing neutron is applied under the hypothesis. The distribution of 1C fit for the above selection is shown in Fig. 2. The agreement between data and MC simulation is reasonable, and in the following, is required.


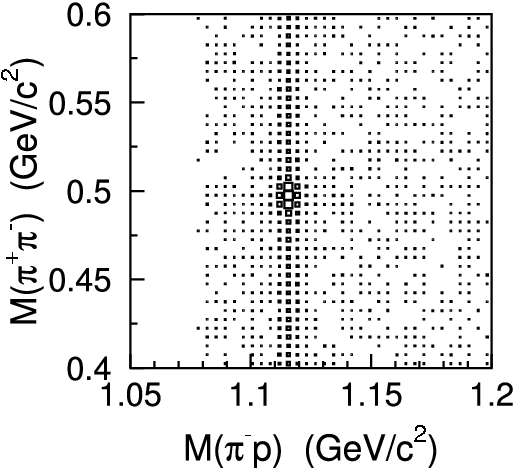
Figure 3 shows the scatter plot of versus , and clear and signals are seen. Figure 4 shows the decay length distributions for data and MC simulation for events satisfying and mass selection requirements and . The missing mass distribution of charged tracks for events satisfying these requirments plus mm is shown in Fig. 5, and a very clean neutron peak is seen. A fit with a Gaussian function yields a mass value consistent with that of the neutron. The invariant mass spectrum is shown in Fig. 6, and a signal is clearly seen.


Backgrounds for which contribute to the peak in the signal region mainly come from and that survive selection criteria. Normalizing with the corresponding branching fractions and the number of events in the data sample, a total of and background events are esitmated. These events will be subtracted in determining the final branching fractions. Other surviving background events mainly come from , , , and , and their charge conjugate channels, but they only give a flat contribution in the signal region. The sum of these backgrounds, normalized by their branching fractions, is shown as the cross-hatched area in Fig. 6, and it is consistent with the background under the peak for data.

Using a Gaussian to describe the and a second order polynomial function to model the background shape, a fit to the distribution is performed, shown as the curve in Fig. 6. A total of 105833 events are obtained. No signal is observed in the invariant mass distribution for events which recoil against the sideband region ( GeV/). The detection efficiency for the signal is 6.09%, which is determined from a uniform phase space MC simulation. The branching fraction is:
where is the number of events observed (105833); is the number of background events from (42 8) and (12 3); is the detection efficiency; is the number of events; and and are the branching fractions of and [6]. The error is statistical only.
If we fit the charge conjugate channels separately, we obtain events with an efficiency of for , events, an efficiency of for , and the following branching fractions:
,
,
where the errors are statistical only. These results are consistent with each other in .
In order to obtain a clean sample of and , we require events to satisfy the and mass selection requirements, , and mm, and also require the decay length mm to eliminate backgrounds without a in the final state, such as . After this final selection, the background contribution is estimated to be less than 5%. Figure 7 shows the scatter plot of versus for candidate events for all but the and mass selection requirements, where the boxes in the plot show the signal and sideband regions. The invariant mass spectra of , , and , as well as the Dalitz plot for all selection requirements are shown in Fig. 8. In the invariant mass spectrum, an enhancement near threshold is evident, as is found in the mass spectrum in [12]. If the enhancement is fitted with an acceptance weighted S-wave Breit-Wigner function and a function describing the phase space “background” contribution, the fit leads to M=1.6480.006GeV/ and MeV/, respectively. Here the errors are only statistical. The systematic uncertainties are not included since more accurate measurements of the mass and width should come from a full PWA involving interferences among and states. The fitted mass and width are consistent with those obtained from a partial wave analysis of [12]. The signal which was seen in the invariant mass spectrum in is not significant here. Using a Bayesian approach [13] and fixing the mass and width of to 2075 MeV/ and 90 MeV/ respectively, the upper limit on the number of events observed is 54 events at the 90% C.L.
The state at around 1.9 GeV/c2 in the invariant mass spectrum and the states at around 1.5 and 1.7 GeV/c2 in the invariant mass spectrum are present. A larger data sample and a partial wave analysis are needed to analyze these and states.


3.2 Measurement of
Using the same criteria as in Section 3.1, we select events from the BESII sample of 14M events. The and invariant mass spectra, the scatter plot of versus , and the missing mass spectrum after the final selection are shown in Fig. 9. The and signals are obvious.

Fitting the mass spectrum with a Gaussian for the signal and a first order polynomial background, as shown in Fig. 10, yields 507 events. The statistical significance of the is about 7.2. The background events from the sidebands and 21 background events from are subtracted. A uniform phase space MC simulation determines the detection efficiency to be 9.16%. The corresponding branching fraction is:
.
Here the error is statistical only.

3.3 Systematic Errors
In this analysis, the systematic errors on the branching fractions mainly come from following sources.
3.3.1 MDC tracking
The MDC tracking efficiency has been measured using channels like , , and . The MC simulation agrees with data within 1 to 2% for each charged track [11]. Thus 8% is taken as the systematic error coming from MDC tracking for the 4-prong events considered in this analysis.
3.3.2 Kinematic fit
The systematic error from the 1C kinematic fit should be smaller than that from the 4C kinematic fit, since there are fewer constraints. Various studies show that the uncertainty of the 4C kinematic fit is around 4% [14]. Here we conservatively take 4% as the error from the 1C kinematic fit.
3.3.3 Particle identification
In Ref. [11], the particle identification efficiency of , , and are analyzed in detail. Here, only one charged track is required to be identified as a or , and the systematic error from particle identification is less than 2%.
3.3.4 and vertex finding
3.3.5 MC model
Different hadronization models for simulating the hadronic interactions give different detection efficiencies. Their differences are taken as systematic errors. The systematic errors are 7.0% and 14.7% for and its conjugate channel, respectively, and 11.1% for . The efficiency differences with or without considering the intermediate and states are also taken as the systematic errors. They are 5.3% and 4.5% for and , respectively.
3.3.6 Background uncertainty
The background uncertainties come from the uncertainties associated with the estimation of the sideband backgrounds, continuum events, and the events from other background channels, as well as the uncertainties of the background shape, different fit ranges, etc. Therefore, the statistical errors in the estimated background events, the largest difference in changing the background shape, and the difference of changing the fit ranges are taken as the systematic errors for the background uncertainty.
3.3.7 Intermediate decay branching fractions
The branching fractions of and the decays are taken from the PDG [6]. The errors on these branching fractions are taken as systematic errors in our measurements.
3.3.8 Number of and events
The total number of events is (57.70 2.62), determined from inclusive 4-prong hadrons [17], and the total number of events is (14.00.6), determined from inclusive hadronic events [18]. The uncertainty on the number of events, 4.7%, and the uncertainty on the number of events, 4.0%, are also systematic errors.
The above systematic errors are all listed in Table 1. The total systematic error is determined by adding all terms in quadrature.
4 Results
The decays of and to are observed for the first time, and their branching fractions are:
,
,
,
.
The ratio of the branching fractions of and decaying to is = (12.6 3.5)% and obeys the 12% rule well.
There is no obvious enhancement near threshold. The upper limit on the branching fraction on the near-threshold enhancement at threshold at the 90 % C.L. is:
where is 54 events; =5.32% is the detection efficiency considering the angular distributions; is the number of events; and are the and branching fractions, and is the systematic error (17.3%). Taking into account the isospin factor, the branching fraction upper limit for is not inconsistent with that for [4].
| Sources | Relative Error (%) | |||
|---|---|---|---|---|
| decay modes | ||||
| MDC tracking | 8.0 | 8.0 | 8.0 | 8.0 |
| Kinematic fit | 4.0 | 4.0 | 4.0 | 4.0 |
| Particle ID | 2.0 | 2.0 | 2.0 | 2.0 |
| MC model | 15.6 | 8.3 | 9.4 | 11.1 |
| Background uncertainty | 2.1 | 5.1 | 9.3 | 7.1 |
| and reconstruction | 1.2 | 1.2 | 4.3 | 1.2 |
| Intermediate decay branching fractions | 0.9 | 0.9 | 0.9 | 0.9 |
| Numbers of and events | 4.7 | 4.7 | 4.7 | 4.0 |
| Total systematic error | 18.9 | 14.3 | 17.3 | 16.6 |
5 Acknowledgments
The BES collaboration thanks the staff of BEPC and computing center for their hard efforts. This work is supported in part by the National Natural Science Foundation of China under contracts Nos. 10491300, 10225524, 10225525, 10425523, 10625524, 10521003, the Chinese Academy of Sciences under contract No. KJ 95T-03, the 100 Talents Program of CAS under Contract Nos. U-11, U-24, U-25, and the Knowledge Innovation Project of CAS under Contract Nos. U-602, U-34 (IHEP), the National Natural Science Foundation of China under Contract No. 10225522 (Tsinghua University), and the Department of Energy under Contract No. DE-FG02-04ER41291 (U. Hawaii).
References
- [1] J. J. Aubert, et al., Phys. Rev. Lett. 33,1404 (1974).
- [2] J. E. Augustin, et al., Phys. Rev. Lett. 33,1406 (1974).
- [3] L. Köpke and A. Wermes, Phys. Rep. 174, 67 (1989).
- [4] BES Collaboration, M. Ablikim et al., Phys. Rev. Lett. 93, 112002 (2004).
- [5] T. Appelquist and H. D. Politzer, Phys, Rev. Lett.34, 43 (1975); A. De Rujula and S. L. Glashow, ibid, page 46.
- [6] W.-M. Yao et al. (Particle Data Group), J. Phys. G 33,1 (2006).
- [7] P. B Mackenzie, G. P. Lepage, Phys. Rev. Lett. 47, 1244 (1981).
- [8] W. S. Hou and A. Soni, Phys. Rev. lett. 50, 569 (1983).
- [9] W. S. Hou, Phys. Rev. D 55, 6952 (1992).
- [10] BES Collaboration, J. Z. Bai et al., Nucl. Instrum. and Methods A 458, 627 (2001).
- [11] BES Collaboration, M. Ablikim et al., Nucl. Instrum. and Methods A 552, 344 (2005).
- [12] H. X. Yang for BES Collaboration, Int. J. Mod. Phys. A 20, 1985 (2005).
- [13] G. J Feldman and R. D. Cousins, Phys. Rev. D 57,3873 (1998).
- [14] BES Collaboration, M. Ablikim et al., Phys. Rev. D 74, 012004 (2006).
- [15] BES Collaboration, M. Ablikim et al., Phys. Lett. B 648, 149 (2007).
- [16] BES Collaboration, M. Ablikim et al., Phys. Rev. Lett. 92, 052001 (2004).
- [17] S. S. Fang et al., HEP&NP 27, 277 (2003) (in Chinese).
- [18] X. H. Mo et al., HEP&NP, 28, 455 (2004).