Leptonic and semileptonic and decays at B-factories
Abstract
Recent measurements of branching fractions, form factors and decay constants of leptonic and semileptonic decays of -mesons acquired at experiments running at the resonance energy are reviewed.
I Introduction
One of the important goals of particle physics is the precise measurement and understanding of the Cabibbo-Kobayashi-Maskawa (CKM) Matrix. To interpret results from B-factory experiments such as BABAR ref:babar and Belle Belle, theoretical calculations of form factors and decay constants (usually based on lattice gauge theory, see e.g. Kronfeld:2006sk) are needed. It is necessary to have accurate measurements in the charm sector to check (and allow further tuning of) theoretical methods and predictions.
Due to their relative abundance and simplified theoretical treatment, (semi)leptonic decays of or mesons are a favored means of determining the weak interaction couplings of quarks within the standard model.
This review concentrates on experimental results for such decays achieved at experiments running at the resonance threshold, namely the BABAR and Belle experiments. It uses adapted excerpts from the cited Belle and BABAR publications.
II The Experiments
The BABAR detector ref:babar reconstructs charged particles by matching hits in the 5-layer double-sided silicon vertex tracker (SVT) with track elements in the 40-layer drift chamber (DCH), which is filled with a gas mixture of helium and isobutane. Slow particles which do not leave enough hits in the DCH due to the bending in the -T magnetic field, are reconstructed in the SVT. Charged hadron identification is performed combining the measurements of the energy deposition in the SVT and in the DCH with the information from the Cherenkov detector (DIRC). Photons are detected and measured in the CsI(Tl) electro-magnetic calorimeter (EMC). Electrons are identified by the ratio of the track momentum to the associated energy deposited in the EMC, the transverse profile of the shower, the energy loss in the DCH, and the Cherenkov angle in the DIRC. Muons are identified in the instrumented flux return, composed of resistive plate chambers interleaved with layers of steel and brass.
The Belle detector Belle is a large-solid-angle magnetic spectrometer that consists of a silicon vertex detector (SVD), a 50-layer central drift chamber (CDC), an array of aerogel threshold Cherenkov counters (ACC), a barrel-like arrangement of time-of-flight scintillation counters (TOF), and an electromagnetic calorimeter comprised of CsI(Tl) crystals (ECL) located inside a superconducting solenoid coil that provides a 1.5 T magnetic field. An iron flux-return located outside of the coil is instrumented to detect mesons and to identify muons (KLM). The detector is described in detail elsewhere Belle. Two inner detector configurations were used. A 2.0 cm beampipe and a 3-layer silicon vertex detector were used for the first sample of fb-1, while a 1.5 cm beampipe, a 4-layer silicon detector and a small-cell inner drift chamber were used to record the remaining fb-1 svd2.
III Semileptonic Decays to Scalar Mesons
Form factors from meson semileptonic decay have been calculated using lattice QCD techniques ref:unquenched; ref:unquenched2; ref:quenched. In the theoretical description, the differential decay width is dominated by the form factor ref:2a, where is the invariant mass of the lepton pair. Up to order it is given by
| (1) |
where is the magnitude of the meson 3-momentum in the rest frame.
In the modified pole model ref:bk, the form factor is described as
| (2) |
with the pole masses predicted as GeV/ (for ) and GeV/ (for ). Setting leads to the simple pole model ref:2a.
A model independent description of the form factor has been studied in ref:hill1. The most general expressions of the form factor are analytic functions satisfying the dispersion relation:
| (3) |
The only singularities in the complex plane originate from the interaction of the charm and the strange quarks in vector states. They are a pole, situated at the mass squared and a cut, along the positive real axis, starting at threshold () for production.
This cut -plane can be mapped onto the open unit disk with center at using the variable:
| (4) |
In this variable, the physical region for the semileptonic decay corresponds to the small (real) range between . The expansion of ,
| (5) |
is thus expected to converge quickly.
III.1 at Belle
Belle has measured the absolute branching fractions and form factors of and () ref:belle, using a novel reconstruction method with better resolution than in previous experiments. The analysis is based on data corresponding to a total integrated luminosity of 282 fb-1.
To achieve good resolution in the neutrino momentum and , the are tagged by fully reconstructing the remainder of the event. The studied events are of the type , where may include additional , , or mesons (inclusion of charge-conjugate states is implied throughout this paper). The is reconstructed in the modes and , with {}. Each and candidate is subjected to a mass-constrained vertex fit to improve the momentum resolution. The 4-momentum of is found by energy-momentum conservation, assuming a event. Its resolution is improved by subjecting it to a fit of the tracks and the momentum, constrained to originate at the run-by-run average collision point, while the invariant mass is constrained to the nominal mass of a . Candidates for are selected from among the remaining tracks, and for each the candidate 4-momentum is calculated from that of the and . The momentum is then adjusted by a kinematic fit constraining the candidate mass to that of the . For this fit, the decay vertex of the has been estimated by extrapolating from the collision point in the direction of the momentum assuming the average decay length.
Background lying under the mass peak (i.e. fake-) is estimated using a wrong sign (WS) sample where the tag- and signal-side candidates have the same flavor ( instead of ). A MC study (including and continuum (, where , , , ) events ref:bellegen; ref:bellemc) has found that this sample can properly model the shape of background except for a small contribution from real decays () from interchange between particles used for the tag due to particle misidentification. Background from fake is subtracted normalizing this shape in a sideband region GeV/, yielding signal tags.
Within this sample of tags, the semileptonic decay is reconstructed with and candidates from among the remaining tracks. The neutrino candidate 4-momentum is reconstructed by energy-momentum conservation, and its invariant mass squared, , is required to satisfy .
Multiple candidates still remain in one third of tags, and in about one quarter of the semileptonic sample. In these cases all candidates are saved and given equal weights such that each event has a total weight of .
| channel | full | ||||
|---|---|---|---|---|---|
| yield | |||||
| fake | |||||
| semileptonic | n/a | ||||
| hadronic | n/a | ||||
| signal | |||||
| stat. error | 309 | 37 | 37 | 12 | 12 |
| syst. error | 830 | 7 | 25 | 3 | 6 |
| Branching Fraction () | |||||
| ( and channels, average) | |||||
The contribution from fake in the sample of semileptonic decay candidates is estimated using the invariant mass WS shape of the tag sample, normalized in the previously defined sideband region. Backgrounds from semileptonic decays with either an incorrectly identified meson or where additional mesons are lost in reconstruction are highly suppressed by the good neutrino mass resolution. For the most significant background is amounting to of the total yield. It was estimated using the reconstructed decays in data, reweighted with the (independently measured) probability of kaons to fake pions. Smaller backgrounds from and decays amounting to were measured by normalizing MC to data in the upper sideband region , which is dominated by these channels. For , decays of contribute at the level of , measured using a sideband evaluation as described above, while background from and was found to be negligible ( of the total yield). Background from decays to hadrons, where a hadron is mis-identified as a lepton, is measured with an opposite sign (OS) sample, where the lepton charge is opposite to that of the slow pion. Note that the signal is extracted from the same sign (SS) sample. In contrast to the SS sample, the OS sample has no signal or semileptonic backgrounds; fake are subtracted in the same manner described previously. Assigning well identified pion and kaon tracks a lepton mass, pure background distributions are constructed in both SS and OS, which are labelled and , . A fit of the weights and of the components and in the distribution of the OS data sample is performed, and the hadronic background in the SS data sample is calculated as , utilizing the fact that the hadron misidentification rate does not depend on the charge correlation defining SS and OS. The method has been validated using MC samples. As the muon fake rate is about an order of magnitude larger than that for electrons, this background is much more significant for muon modes. The signal yields and estimated backgrounds are summarized in the upper part of Table 1.
Efficiencies depend strongly on , defined as the number of and mesons assigned to (in ), and are determined with MC; differences in the distribution between MC and data give rise to a further correction. Applying these corrections, the absolute branching fractions (normalized to the total number of tags) summarized in the lower part of Table 1 are obtained.
The resolution in of semileptonic decays is found to be GeV in MC signal events. This is much smaller than statistically reasonable bin widths, which have been chosen as for kaon (pion) modes, and hence no unfolding is necessary. Bias in the measurement of that may arise due to events where the lepton and meson are interchanged, a double mis-assignment, was checked with candidate events and found to be negligible. The differential decay width is bin-by-bin background subtracted and efficiency corrected, using the same methods described previously.
The measured distribution is fitted with free parameters to the predicted differential decay width of the pole models with being one of the parameters, and either (setting ) or (assuming the theoretical pole) the other. Binning effects are accounted for by averaging the model functions within individual bins. The fit to the simple pole model yields GeV/ () and GeV/ (). While the pole mass for the decay agrees within errors with the predicted value, , the more accurate fit of is several standard deviations below . In the modified pole model, describes this deviation of the real poles from the masses. Fixing these masses to their known experimental values, a fit of yields () and ().
The fitted values for vary little for the different fits, for the modified pole model the results are and .
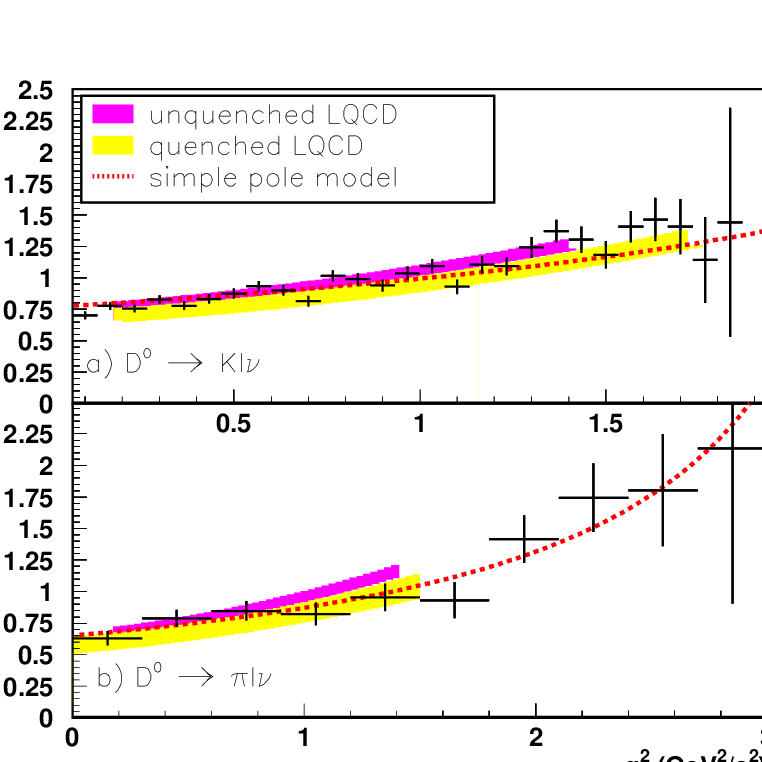
The measured form factors are shown in Figure 1 with predictions of the simple pole model, unquenched ref:unquenched2 and quenched ref:quenched LQCD. To obtain a continuous curve for from the LQCD values reported at discrete points, the values were fitted by a parabola, which is found to fit well within the stated theoretical errors and is not associated with any specific model. To quantify the degree of agreement, a /ndf is calculated between this measurement and the interpolated LQCD curve within the range for which LQCD predictions are made. For the kaon modes, is (), for the pion modes (); correlations induced by the fit of the calculated points to a parabola have been considered.
III.2 at BABAR
This subsection is an adapted excerpt of BABAR’s publication babarkenu.
The corresponding BABAR analysis babarkenu is using a total integrated luminosity of fb-1 collected during the years 2000-2002. It measures the variation and the absolute value of the hadronic form factor at for the decay . Normalizing to , it also gives a value for its branching fraction. In contrast to the Belle analysis, a semi-inclusive reconstruction technique is used to select semileptonic decays with less resolution, but much higher efficiency. As a result of this approach, events with a photon radiated during the decay are included in the signal.
decays are reconstructed in events where the originates from the . Charged and neutral particles are boosted to the center of mass system (c.m.) and the event thrust axis is determined. The direction of this axis is required to be in the interval to minimize the loss of particles in regions close to the beam axis. A plane perpendicular to the thrust axis is used to define two hemispheres, equivalent to the two jets produced by quark fragmentation. In each hemisphere, pairs of oppositely charged leptons and kaons are searched for. For the charged lepton candidates only electrons or positrons with c.m. momentum greater than 0.5 GeV/ are considered.
Since the momentum is unmeasured, a kinematic fit is performed, constraining the invariant mass of the candidate system to the mass. In this fit, the momentum and the neutrino energy are estimated from the other particles measured in the event. The direction is taken as the direction opposite to the sum of the momenta of all reconstructed particles in the event, except for the kaon and the positron associated with the signal candidate. The energy of the jet is determined from the total c.m. energy and from the measured masses of the two jets. The neutrino energy is estimated as the difference between the total energy of the jet and the sum of the energies of all reconstructed particles in the hemisphere. A correction, which depends on the value of the missing energy measured in the opposite jet, is applied to account for the presence of missing energy due to particles escaping detection, even in the absence of a neutrino from the decay.
| Theoretical | Unit | Parameters | /NDF | Expectations |
|---|---|---|---|---|
| ansatz | [/NDF] | |||
| expansion | 5.9/7 | |||
| Modified pole | 6.0/8 | |||
| Simple pole | 7.4/8 |
Background events arise from decays and hadronic events from the continuum. To reduce the contribution from events, selection criteria exploiting the topological differences to events with fragmentation are used. Background events from the continuum arise mainly from charm particles Because charm hadrons take a large fraction of the charm quark energy, charm decay products have higher average energies and different angular distributions (relative to the thrust axis or to the direction) compared with other particles in the hemisphere emitted from the hadronization of the and quarks. Selection criteria based on these considerations are applied to suppress this kind of background.
The remaining background from -events can be divided into peaking (60) and non-peaking (40) candidates. Peaking events are those background events whose distribution is peaked around the signal region. These are mainly events with a real in which the slow is included in the candidate track combination. Backgrounds from annihilations into light quarks and events are non-peaking. To improve the accuracy of the reconstructed momentum, the nominal mass is added as a constraint in the previous fit and only events with a probability higher than 1 are kept, resulting in 85260 selected candidates containing an estimated number of 11280 background events. The non-peaking component comprises of the background. Detailed studies have been performed to understand corrections (and the connected systematics) of various components of the peaking background.
To obtain the true distribution, the measured one has to be corrected for selection efficiency and detector resolution effects. This is done using an unfolding algorithm based on MC simulation of these effects: Using Singular Value Decomposition (SVD) ref:svd of the resolution matrix, the unfolded distribution for signal events, corrected for resolution and acceptance effects, is obtained. This approach provides the full covariance matrix for the bin contents of the unfolded distribution. To verify that the variation of the selection efficiency is well described by the simulation, a control sample of is reconstructed as if they were events, and indicates no significant bias. With a second control sample of , the accuracy of the direction and missing energy reconstruction for the analysis is checked. This information is used in the mass-constrained fits and thus influences the reconstruction. Once the simulation is tuned to reproduce the results obtained on data for these parameters, the resolution distributions agree very well. One half of the measured variation on the fitted parameters from these corrections has been taken as a systematic uncertainty.
Effects from a momentum-dependent difference between data and simulated events on the charged lepton and on the kaon identification have been found to be and included in the corrections and systematics. Care has also be taken to correctly understand radiative decays where . Corresponding corrections have been applied and the corresponding uncertainties enter in the systematic uncertainty evaluation. Toy simulations have been used to verify that the statistical precision obtained for each binned unfolded value is correct and if biases generated by removing information are under control.
The fit to a model is done by comparing the number of events measured in a given bin of with the expectation from the exact analytic integration of the expression over the bin range, with the overall normalization left free. The summary of the fits to the normalized distributions is presented in Table 2. As long as the form factor parameters are left free in the fit, the fitted distributions agree well with the data and it is not possible to reject any of the parameterizations. As also observed by Belle and other experiments, the simple pole model ansatz, with does not reproduce the measurements.
Figure 2 shows the product as a function of (defined above), where is the theoretical normalization ref:hill1, which constrains this product to unity at (equivalent to ). The data are compatible with a linear dependence, which is fully consistent with the modified pole ansatz for .

The branching fraction is measured relative to the reference decay channel, :
| (6) |
Using slightly adapted selection criteria, after background subtraction there remain events of in data. To select candidates, care has been taken to do this in the most similar way possible. After background subtraction and the necessary corrections, there are candidates selected in the interval .
A summary of the systematic uncertainties on is given in babarkenu. The measured relative decay rate is:
| (7) |
Using the world average for the branching fraction ref:pdg06, gives , where the last quoted uncertainty corresponds to the accuracy on .
The value of the hadronic form factor at can be obtained as
| (8) |
where is the measured branching fraction, ref:pdg06 is the lifetime and . To account for the variation of the form factor within one bin, and in particular to extrapolate the result at , the pole mass and the modified pole ansätze have been used; the corresponding values obtained for differ by 0.002. Taking the average between these two values and including their difference in the systematic uncertainty, this gives
| (9) |
where the last quoted uncertainty corresponds to the accuracy on , and . For the expansion, this corresponds to .
IV Semileptonic Decays to Vector Mesons
The differential semileptonic decay rate of a scalar meson to a vector meson, specifically, , depends on the four variables , , and ref:KS, depicted in Fig. 3.

Neglecting the electron mass, the differential decay rate as function of these four variables depends in a given way babarphienu; ref:ks2 on three form factors
| (10) | |||||
| (11) |
with the pole masses and . Measurements have usually been expressed in terms of the ratios of the form factors at , namely:
| (12) |
Based on a prediction by ref:fk, is a constant depending only on particle masses,
| (13) |
IV.1 at BABAR
This subsection is an adapted excerpt of BABAR’s publication babarphienu.
BaBar has presented a study of the hadronic form factors for the vector meson decay with babarphienu (results still preliminary). This analysis is based on a fraction of the total available BABAR data sample, corresponding to integrated luminosities of recorded on the resonance. It focuses on semileptonic decays of mesons which are produced via annihilation. mesons produced in events are not included and treated as background.
Similar to BABAR’s analysis presented above, a plane perpendicular to the thrust axis is used to define two hemispheres, equivalent to the two jets produced by quark fragmentation. In each hemisphere, decay products of the , a charged lepton and two oppositely charged kaons are searched for. Charged leptons are required to have a c.m. momentum larger than 0.5 . The unmeasured neutrino momentum is determined in a way similar to the analysis presented above.

Figure 4 shows the invariant mass distribution for the selected decays compared to MC simulation and the composition of the background. candidates are defined as pairs with an invariant mass in the interval from 1.01 and 1.03 . Various selection criteria are applied to suppress the background babarphienu. About 71 of the total background include a true decay combined with an electron from another source, namely meson decays (41), charm particle decays (25), photon conversions or Dalitz decays (24), and the rest are fake electrons. These mesons are expected to originate from the primary vertex, or from a secondary charm decay vertex.
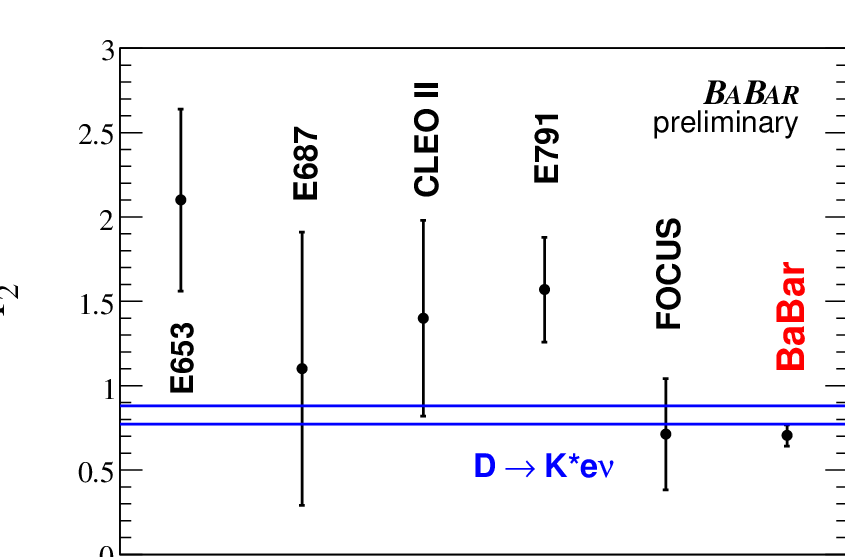
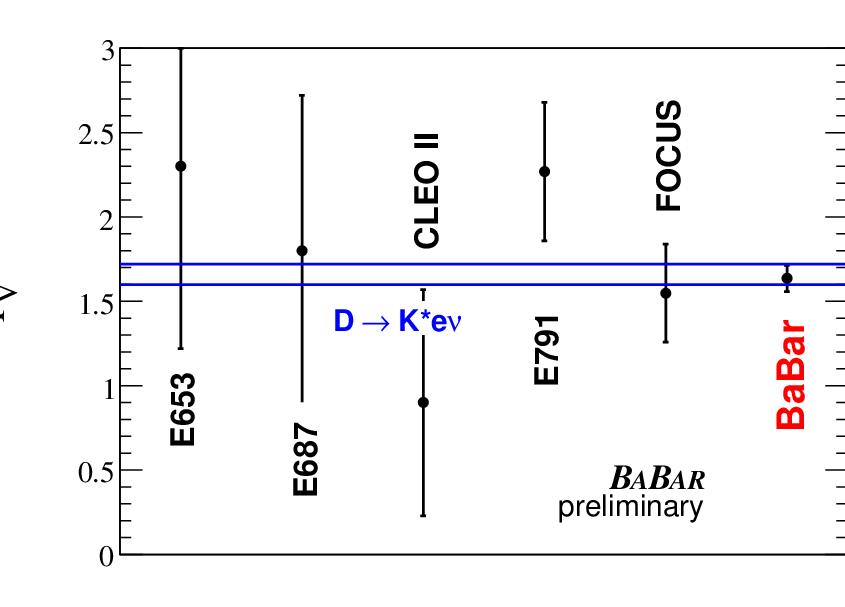
A maximum likelihood fit is performed to the four-dimensional decay distribution in the reconstructed variables , , and using the likelihood function
| (14) |
In this expression, for each bin , is the Poisson probability to observe events, when are expected. Considering the typical resolutions and the available statistics, the four variables are divided into 4 bins each, corresponding to a four-dimensional array with a total number of bins of .
To determine the expected number of signal events, a dedicated sample of signal events is generated in MC with a uniform decay phase space distribution, and each event is weighted using the differential decay rate divided by . Two of the four variables, and , are integrated (averaged), taking advantage of the fact that the estimated background rate is flat in these variables. The background components are normalized to correspond to the expected rates for the integrated luminosity of the data sample. The absolute normalization for signal events is left free to vary in the fit. In each bin , the expected number of events is evaluated to be:
| (15) |
Here refers to the number of simulated signal events, with reconstructed values of the four variables corresponding to bin . The weight is evaluated for each event, using the generated values of the kinematic variables, thus accounting for resolution effects. is the sum of the weights for all simulated signal events which have been generated according to a uniform phase space distribution. and are the parameters to be fitted. Specifically, the free parameters are , , and parameters which define dependence of the form factors. To avoid having to introduce finite ranges for the fit to the pole masses, , we define . This expression ensures that is always larger than .
The fit to the four-dimensional data distribution is performed using simulated signal events generated according to a uniform phase space distribution. Signal MC events are weighted to correct for differences in the quark fragmentation process between data and simulated events.
Differences between data and MC have been measured using decays, according corrections were applied. The influence of combinatorial background has been studied and considered in the systematics. Background from mesons produced in or decays results in a further correction in MC (to calibrate the production rate) and corresponding systematics. The effect of uncertainties due to finite MC statistics and background estimation on the fit has been studied with toy simulations, and was also included in the final results. Remaining detector effects have been determined with control data samples. Using and events it has been verified that differences between data and simulated events in the resolution of the variables and are small compared with other sources of systematic uncertainties. They have been neglected at present.
Using fixed values for the pole masses ( and ), the final fit results including all corrections are:
Keeping fixed, for which there is no sensitivity, and adding as additional free parameter, the fit results in
V Leptonic Decays
The purely leptonic decay (the charge conjugate mode is implied throughout this paper) is theoretically a rather clean decay; in the Standard Model (SM), the decay is mediated by a single virtual -boson. The decay rate is given by
| (16) |
where is the Fermi coupling constant, and are the masses of the lepton and of the meson, respectively. is the corresponding CKM-matrix element, while all effects of strong interaction are accounted for in the decay constant . Due to helicity conservation, the decay rate is highly suppressed for electrons. Since the detection of ’s involve additional neutrinos, the muon mode is experimentally the cleanest and most accessible mode.
V.1 at BABAR
This subsection is an adapted excerpt of BABAR’s publication babardsmunu.
BABAR performed a measurement of the ratio and the decay constant , based on a total integrated luminosity of fb-1 .
In order to measure , the decay chain is reconstructed from mesons produced in the hard fragmentation of continuum events. The subsequent decay results in a photon, a high-momentum and daughter muon and neutrino, lying mostly in the same hemisphere of the event. Signal candidates are required to lie in the recoil of a fully reconstructed , , , or meson (the “tag”) reconstructed in a variety of modes babardsmunu wherein the tag flavor is uniquely determined. To eliminate signal from decays, the minimum tag momentum is chosen to be close to the kinematic limit for charm mesons arising from decays.
For each event a single tag candidate is chosen and then used in the subsequent analysis. To pick this tag among multiple candidates within an event (there are 1.2 candidates on average in events with at least one candidate) modes of higher purity are preferred. In events where two tag candidates are reconstructed in the same mode, the quality of the vertex fit of the meson is used as a secondary criterion. After subtracting combinatorial background there are charm tagged events with a muon amongst the recoiling particles.
The signature of the decay is a narrow peak in the distribution of the mass difference at 143.5 . The signal is reconstructed from a muon and a photon candidate in the recoil of the tag. Muons are identified as non-showering tracks penetrating the IFR. The muon must have a momentum of at least 1.2 in the center-of-mass (CM) frame and have a charge consistent with the tag flavor. Clusters of energy in the EMC not associated with charged tracks and exceeding an CM energy of are identified as photon candidates.
The CM missing energy () and momentum () are calculated from the four-momenta of the incoming , the tag four-momentum, and the four-momenta of all remaining tracks and photons in the event. The energy of the charged particles that do not belong to the tag is calculated from the track momentum under a pion mass hypothesis. Assigning a mass according to the most likely particle hypothesis has negligible effect on the missing energy resolution.
The neutrino CM four-momentum () is estimated from the muon CM four-momentum () and , using a technique adopted from Ref. Chadha:1998zh. The difference is minimized, while the invariant mass of the neutrino-muon pair is required to be the known mass of the Eidelman:2004wy. The muon CM four-momentum () is combined with to form the candidate. The candidate is then combined with a photon candidate to form the . The selection requirements on , , and other variables have been optimized to maximize the significance , where and are the signal and background yields expected in the data set.
One class of background are events , where , or , which do not contain a real charm tag. The contribution of these events is estimated from data using the tag sidebands. In addition there are events where the tag is incorrectly reconstructed. Although these events potentially contain the signal decay, they are also subtracted using the tag sidebands. These two sources amount to of the background. A second class of background events () are correctly tagged events with the recoil muon coming from a semileptonic charm decay or from . This includes events . To estimate the size and shape of this background contribution, the analysis is repeated, substituting a well-identified electron for the muon. Except for a small phase-space correction, the widths of weak charm decays into muons and electrons are assumed to be equal. QED effects such as bremsstrahlung () energy losses and photon conversion (), where the muon equivalents have a much lower rate, are explicitly removed. In particular, bremsstrahlung photons found in the vicinity of an electron track are combined with the track. The small number of events with an electron from a converted photon that survive the selection are suppressed by a photon conversion veto, using the vertex and the known radial distribution of the material in the detector. The muon selection efficiency as a function of momentum and direction is measured using events, while radiative Bhabha events are used to quantify the electron efficiency. The ratio of muon to electron efficiencies is applied as a weight to each electron event. The remaining backgrounds are estimated from simulation.

Events that pass the signal selection are grouped into four sets, depending on whether the tag lies in the signal region or the sideband regions, and on whether the lepton is a muon or an electron (Fig. 6). For each lepton type the sideband distribution is subtracted. The electron distribution, scaled by the relative phase-space factor (0.97) appropriate to semileptonic charm meson decays and leptonic decays is then subtracted from the muon distribution. The resulting distribution is fitted with a function , where and describe the simulated signal and background distributions. The function is a double Gaussian distribution. The function consists of a double and a single Gaussian distribution describing the two peaking background components, and a function babardsmunu describing the flat background component. The relative sizes of the background components, along with all parameters except and are fixed to the values estimated from simulation. The fit yields signal events and has a fit probability of 8.9 % (Fig. 7).
The branching fraction of cannot be determined directly, since the production rate of mesons in fragmentation is unknown. Instead the partial width ratio is measured by reconstructing decays. The branching fraction is evaluated using the measured branching fraction for .
Candidate mesons are reconstructed from two kaons of opposite charge. The candidates are combined with charged pions to form meson candidates. Both times a geometrically constrained fit is employed, and a minimum requirement on the fit quality is made. The and the candidate masses must lie within of their nominal values, obtained from fits to simulated events and data. Photon candidates are then combined with the to form candidates. The same requirements on the CM photon energy and momentum as in the signal selection are made. Data events that pass the selection are grouped into two sets: the tag signal and sideband regions. After the tag sideband has been subtracted from the tag signal distribution, the remaining distribution is fitted with , where is a triple Gaussian, describing the simulated signal, and consists of a broad Gaussian centered at and a function babardsmunu describing the simulated background distributions. The Gaussian describes the background where the photon candidate originates from the . The relative sizes of the background components, along with all parameters except , , and the mean of the peak are fixed to the values estimated from simulation. The fit yields events and has a probability of 25.0 % (Fig. 8). From simulation events are expected to contribute to the signal, where the error is mostly from the uncertainty in the braching ratio.

Precise knowledge of the efficiency of reconstructing the tag is not important, since it mostly cancels in the calculation of the partial width ratio. However, the presence of two charged kaons in events leads to an increased number of random tag candidates, compared to events, which decreases the chances that the correct tag is picked. The size of the correction for this effect to the efficiency ratio () is determined to be % in simulated events.
To measure the effect of a difference between the momentum spectrum in simulated and data events, events are selected in data with the momentum requirement removed. The sample is purified by requiring the CM momentum of the charged pion to be at least 0.8 . The efficiency-corrected momentum distribution in data is compared to that of in simulated events. A harder momentum spectrum is observed in data. The detection efficiencies for signal and events are re-evaluated after weighting simulated events to match the momentum distribution measured in data. The correction to the efficiency ratio is %.
With both corrections applied, the partial width ratio is determined to be , with Eidelman:2004wy.

A detailed discussion of the systematics can be found in babardsmunu. Using the BABAR average for the branching ratio Aubert:2005xuAubert:2006nm, the branching fraction and the decay constant are obtained. The first and second errors are statistical and systematic, respectively; the third is the uncertainty from .
V.2 at Belle
The Belle analysis uses data corresponding to fb-1 to study the decay , using the full-reconstruction recoil method first established in the study of semileptonic mesons described above.
This analysis uses fully reconstructed events of the type , where can be any number of additional pions from fragmentation, and up to one photon11 1 It has been found that events with additional kaons or more than one photon have a poor signal/background ratio and have been therefore excluded. . The tag side consists of a - and a meson (in any charge combination) while the signal side is a meson decaying to . Reconstructing the tag side, and allowing any possible set of particles in , the signal side is reconstructed in the recoil, using the known beam momentum.


Tracks are detected with the CDC and the SVD. They are required to have at least one associated hit in the SVD and an impact parameter with respect to the interaction point in the radial direction of less than cm and in the beam direction of less than cm. Tracks are also required to have momenta in the laboratory frame greater than MeV/. A likelihood ratio for a given track to be a kaon or pion, which is required to be larger than , is obtained by utilising specific ionisation energy loss measurements made with the CDC, light yield measurements from the ACC, and time-of-flight information from the TOF. Lepton candidates are required to have momentum in the lab frame larger than 500 MeV/. For electron identification we use position, cluster energy, shower shape in the ECL, combined with track momentum and measurements in the CDC and hits in the ACC. For muon identification, we extrapolate the CDC track to the KLM and compare the measured range and transverse deviation in the KLM with the expected values. Neutral pion candidates are reconstructed using photon pairs with invariant mass within MeV/ of the nominal mass. Neutral kaon candidates are reconstructed using charged pion pairs within MeV/ of the nominal mass.
Tag-side mesons (both charged and neutral) are reconstructed in with (total branching fraction ). Mass windows have been optimised for each channel separately, and a combined mass- and vertex fit (requiring a confidence level greater than ) is applied to the meson to improve the momentum resolution. -candidates are not directly reconstructed, but searched for in the recoil of , using the known beam momentum, by applying a mass window cut of MeV around the nominal mass ref:pdg06. Since at this point in the reconstruction can be any set of remaining pions and photons, there are usually a large number of combinatorial possibilities. This number is reduced by requiring the presence of a photon that is consistent with the decay where the has its nominal mass within a mass window of MeV. Further selection criteria are applied on the momentum of the primary meson in the rest frame, , which should be smaller than GeV/; the momentum of the meson in the rest frame, , should be larger than GeV/; the momentum of the meson in the rest frame, , is required to be larger than GeV/ and the energy of the photon in , in the lab frame, is required to be larger than MeV/, irrespective of . To further improve the recoil momentum resolution, inverse 22 2 The fit is called inverse since it uses information from the mother and sister particles, rather than information about daughter particles as is usually the case. mass-constrained vertex fits are then performed for the and , requiring a confidence level greater than . After all these selections are applied, the average number of combinatorial reconstruction possibilities is per event. The sample is further divided into a right- (RS) and wrong-sign (WS) part, depending on the relative charges of the primary meson, the meson and that of the meson the meson decays into (), compared to the charge of the meson, which is fixed by the total charge of the assuming overall charge conservation for the event.
Within this sample of -tags, decays of the type are selected by requiring another charged track that is identified as a muon and has the same charge as the candidate. No additional charged particles are allowed in the event, and additional energy corresponding to neutral particles is required to be smaller than GeV where is the number of additional neutral particles. After these selections, in almost all cases only one combinatorial reconstruction possibility remains. Figure 9 shows the mass spectra for -tags and neutrino candidates.
is defined as the number of primary particles in the event, where primary means that the particle is not a daughter of any particle reconstructed in the event. The minimal value for is three corresponding to a event without any further particles from fragmentation. The upper limit for is determined by the reconstruction efficiency; Monte-Carlo (MC) shows that the number of reconstructed signal events is negligible for . As the efficiency very sensitively depends on , it is crucial to use MC that correctly reflects the distribution observed in data. Unfortunately, the details of fragmentation processes are not very well understood, and standard MC ref:bellegen shows notable differences compared to data. Furthermore, the true (generated) value differs from the reconstructed , as particles can be lost or wrongly assigned. Thus the measured (reconstructed) distribution has to be deconvoluted so that the analysis can be done in bins of to avoid bias in the results.
To extract the number of -tags as function of in data from the background, 2-dimensional histograms in (ranging from to ) and the invariant recoil mass are used. The signal shapes for different values of (ranging from to 33 3 The upper limit of is chosen because the bin has some overlap with .) of the signal are modelled with generic MC (GMC) ref:bellemc, which has been filtered on the generator-level for events of the type . The weights of these components, , are free parameters in the fit to data. As a model for the background in RS, the WS data sample is used. Each slice of is fitted separately, adding another 6 free parameters. Since the WS-sample contains some signal ( of the RS signal), these signal components (in slices of ) are also included in the fit as independent parameters (yielding a negative weight to compensate for the WS signal present in the data shapes). The fit is performed simultaneously with all these free parameters. As a crosscheck, the fit has also been performed using generic MC RS-sample backgrounds, which gives a negligible change in the results. A further crosscheck involved dividing the MC sample randomly into two halves, using the shapes of the first half to fit the signal in the second. The result as function of , normalized to the amount of signal in the first half, fits to a flat line as , which agrees well with the expectation of . The total number of reconstructed -tags in data is calculated as
| (17) |
where represents the total number of reconstructed filtered GMC events that were generated in the -th bin of (regardless of the reconstructed ) and is the fitted weight of this component.
To fit the number of -events as function of , 2-dimensional histograms in and the missing mass squared are used. The shape of the signal is modelled with signal MC. As MC studies show, the background under the -signal peak consists primarily of non- decays, semileptonic decays (where the additional hadrons have low momenta and remain undetected) and leptonic decays (where the decays to a muon and two neutrinos). Hadronic decays (with one hadron misidentfied as muon) are a rather small background component. Except for hadronic decays, which are negligible, all backgrounds are common to the -mode, which is suppressed by a factor of . Thus, the -sample provides a good model of the background that has to be corrected only for kinematical and efficiency differences. Including this corrected shape in the fit, the total number of fitted -events in data is given by
| (18) |
where represents the total number of reconstructed signal MC events that were generated in the -th bin of (regardless of the reconstructed ) and is the fitted weight of this component.
The numerical result for is , that for is . The statistical uncertainties are due to statistics in the data signal, the systematic uncertainties due to statistics of the data background samples and those of the MC samples used. These errors include the non-negligble correlations between the bins.
As the branching fraction of used for the generation of generic MC is known, the branching fraction in data can be determined using the following formula:
| (19) |
where and is the number of reconstructed -events in the generic MC, weighted according to the fit to data, i.e.
| (20) |
where represents the total number of reconstructed -events filtered from GMC that were generated in the -th bin of (regardless of the reconstructed ).

Figure 10 shows the branching fraction determined in bins of (using correlated fit results). The result is stable within errors in ; note that the errors shown for the bins are the total errors, including correlation. The final result is:
| (21) |
The statistical error reflects the statistics of the signal sample. The systematic error is dominated by statistical uncertainties due to background samples from data and MC samples () and the statistical uncertainty on (). Since the branching fraction is determined by calculating a ratio of the signal yield to the number of -tags, systematics in the reconstruction of the tag side cancel; the only remaining systematics are due to the tracking and identification of the muon, which have been estimated as , contributing to the total systematic error. As a crosscheck, also the branching fraction for has been determined as , which agrees nicely with the result given above including all available bins.
VI Summary: Overview and Comparison
| decay mode | parameter | prediction | BaBar result | Belle result | difference |
|---|---|---|---|---|---|
| BF (%) | |||||
| z-expansion, | n/a | ||||
| z-expansion, | n/a | ||||
| z-expansion, | n/a | ||||
| (GeV/) | |||||
| BF (%) | n/a | ||||
| (GeV/) | n/a | included in | |||
| n/a | results shown | ||||
| n/a | above | ||||
| BF (%) | n/a | ||||
| (GeV/) | n/a | ||||
| n/a | |||||
| n/a | |||||
| BF (%) | n/a | ||||
| (GeV/) | n/a | included in | |||
| n/a | results shown | ||||
| n/a | above | ||||
| ( fixed) | n/a | ||||
| ( fixed) | n/a | ||||
| ( fixed) | n/a | ||||
| ( fixed) | n/a | ||||
| (GeV/) ( fixed) | n/a | ||||
| BF () | |||||
| (MeV) |
Studies in the charm sector are notoriously difficult for experiments running at much higher than threshold energy; still both Belle and BABAR present an interesting variety of results on (semi)leptonic charm decays. While Belle concentrated on fully reconstructed (and consequently tagged) events, BABAR preferred methods with partially reconstructed events, and uses tag information only for its analysis.
The advantage of Belle’s approach is a very effective background suppression and an excellent neutrino momentum resolution which can compete with results achieved at experiments operating at threshold energy like Cleo-c cleoc. It also allows absolute measurements, by normalization to the number of tags.
However, BABAR’s approach is significantly more efficient in terms of event statistics. In the case of the analysis, despite higher backgrounds, this results in a much better accuracy of measurements. For the analysis, the advantage of higher statistics is more or less equalled by the disadvantage of larger backgrounds, which eventually gives somewhat larger errors than Belle’s.
In any case, it is a valuable crosscheck to have rather different experimental approaches at different experiments. Table 3 summarizes all results by Belle and BABAR.
Within the semileptonic channels discussed in this review, only the mode has been studied by both BABAR and Belle, and can be compared. The measured branching fractions agree well within errors, larger differences are seen in the form factor measurements. However, these differences do not exceed , and could be due to the more complicated systematics of the fits involved. The results are much more precise than those of previous experiments, and also well compatible with other recent results cleo3; focus. Obviously, the untagged, partial reconstruction of BABAR has clearly smaller erros, even though it suffers a large uncertainty due to the normalizing channel used, which is the dominating part of its systematic error. Belle does an absolute measurement, but also is clearly limited by systematics. Thus in neither case a significant further improvement of the measurements can be expected with more data accumulated, without also further developing the experimental methods.
The other mode where results can be compared is . The results agree very well with each other. Here Belle profits from its full reconstruction method, and has somewhat, but not dramatically smaller errors. Both results are well compatible with other recent results, and still compatible with theoretical predictions, which tend to be lower by , but bear some uncertainties as well theofds. In both experiments, statistical and systematic error are of the same order. Considering the fact that part of the systematic error is due to the size of control samples which will get larger with more statistics, there is some room for further improvements once the full data sets of the experiments are available.
Acknowledgements.
We wish to thank Arantza Oyanguren, Justine Serrano and Paul Jackson from BABAR for providing material to compile this talk. Text excerpts from BABAR publications covering the described analyses have been used to compile this review. As far as my own collaboration Belle is concerned, the thanks go to the KEKB group for the excellent operation of the accelerator, the KEK cryogenics group for the efficient operation of the solenoid, and the KEK computer group and the National Institute of Informatics for valuable computing and Super-SINET network support. We acknowledge support from the Ministry of Education, Culture, Sports, Science, and Technology of Japan and the Japan Society for the Promotion of Science; the Australian Research Council and the Australian Department of Education, Science and Training; the National Science Foundation of China under contract No. 10575109 and 10775142; the Department of Science and Technology of India; the BK21 program of the Ministry of Education of Korea, the CHEP SRC program and Basic Research program (grant No. R01-2005-000-10089-0) of the Korea Science and Engineering Foundation, and the Pure Basic Research Group program of the Korea Research Foundation; the Polish State Committee for Scientific Research; the Ministry of Education and Science of the Russian Federation and the Russian Federal Agency for Atomic Energy; the Slovenian Research Agency; the Swiss National Science Foundation; the National Science Council and the Ministry of Education of Taiwan; and the U.S. Department of Energy.References
- (1) B. Aubert et al. [BABAR Collaboration], Phys. Rev. D66, 032003 (2002).
- (2) A. Abashian et al. [Belle Collaboration], Nucl. Instr. and Meth. A 479, 117 (2002).
- (3) A. S. Kronfeld [Fermilab Lattice Collaboration], J. Phys. Conf. Ser. 46 (2006) 147 [arXiv:hep-lat/0607011].
- (4) Z. Natkaniec et al. [Belle Collaboration], Nucl. Instr. and Meth. A 560, 1 (2006).
- (5) M. Okamoto et al., Nucl. Phys. Proc. Suppl. 129, 334 (2004).
- (6) C. Aubin et al., [Fermilab Lattice Collaboration, MILC Collaboration and HPQCD Collaboration], Phys. Rev. Lett. 94, 011601 (2005).
- (7) A. Abada, D. Becirevic, P. Boucaud, J. P. Leroy, V. Lubicz and F. Mescia, Nucl. Phys. B 619, 565 (2001).
- (8) G. Amoros, S. Noguera, J. Portoles, Eur. Phys. J. C27, 243 (2003).
- (9) D. Becirevic and A.B. Kaidalov, Phys. Lett. B 478, 417 (2000) [arXiv:hep-ph/9904490].
- (10) R. J. Hill, Proceedings of 4th Flavor Physics and CP Violation Conference (FPCP 2006), Vancouver, British Columbia, Canada, 9-12 Apr 2006, pp 027, [arXiv:hep-ph/0606023].
- (11) L. Widhalm et al. [Belle collaboration], Phys. Rev. Lett. 97, 061804 (2006).
- (12) see http://www.lns.cornell.edu/public/CLEO/soft/QQ.
- (13) R. Brun et al., GEANT 3.21, CERN Report DD/EE/84-1, (1984).
- (14) B. Aubert et al. [BABAR Collaboration], arXiv:0704.0020 [hep-ex].
- (15) A. Höcker and V. Kartvelishvili, Nucl. Instrum. Methods A372, 469 (1996).
- (16) W.-M. Yao et al., Review of Particle Physics, Journal of Physics G 33, 1 (2006).
- (17) G.Kopp, G. Kramer, G.A. Schuler and W.F. Palmer, Z. Phys. C 48, 327 (1990).
- (18) B. Aubert et al. [BABAR Collaboration], [arXiv:hep-ex/0607085].
- (19)
J.G. Koerner and G.A. Schuler, Z. Phys. C 38, 511 (1988);
Erratum-ibid C 41, 690 (1989).
M. Bauer and M. Wirbel, Z. Phys. C 42, 671 (1989). - (20) S. Fajfer, J. Kamenik, Phys. Rev. D 72, 034029 (2005).
- (21) J. Wiss, “Recent results on fully leptonic and semileptonic charm decays”, FPCP Conference, Vancouver 2006 [arXiv:hep-ex/0605030].
- (22) B. Aubert et al. [BABAR Collaboration], Phys. Rev. Lett. 98 (2007) 141801 [arXiv:hep-ex/0607094].
- (23) M. Chadha et al. [CLEO Collaboration], Phys. Rev. D 58, 032002 (1998).
- (24) S. Eidelman et al. [Particle Data Group], Phys. Lett. B 592, 1 (2004).
- (25) B. Aubert et al. [BABAR Collaboration], Phys. Rev. D 71, 091104 (2005).
- (26) B. Aubert et al. [BABAR Collaboration], hep-ex/0605036, to appear in Phys. Rev. D - Rapid Communications.
- (27) T. Pedlar et al. (CLEO-c Collab.), hep-ex/0704.0437
- (28) G. S. Huang et al. [CLEO collaboration], Phys. Rev. Lett. 94, 011802 (2005).
- (29) J. M. Link et al. [FOCUS collaboration], Phys. Lett. B607, 233 (2005).
- (30) C. Aubin et al., Phys. Rev. Lett. 95, 122002 (2005).