Bose-Einstein correlations of pairs in central Pb+Pb collisions at CERN SPS energies
Abstract
Measurements of Bose–Einstein correlations of pairs in central Pb+Pb collisions were performed with the NA49 detector at the CERN SPS for beam energies of 20, 30, 40, 80, and 158 GeV. Correlation functions were measured in the longitudinally co-moving “out-side-long” reference frame as a function of rapidity and transverse momentum in the forward hemisphere of the reaction. Radius and correlation strength parameters were obtained from fits of a Gaussian parametrization. The results show a decrease of the radius parameters with increasing transverse momentum characteristic of strong radial flow in the pion source. No striking dependence on pion-pair rapidity or beam energy is observed. Static and dynamic properties of the pion source are obtained from simultaneous fits with a blast-wave model to radius parameters and midrapidity transverse momentum spectra. Predictions of hydrodynamic and microscopic models of Pb+Pb collisions are discussed.
(Septemer 26, 2007)
pacs
25.75.-q,25.75.GzI Introduction
In central collisions of ultra-relativistic heavy ions an extended volume of high energy density is created. Several observations at top SPS Heinz:2000bk and RHIC Adcox:2004mh; Back:2004je; Adams:2005dq; Arsene:2004fa energies indicate that the initial energy density is large enough to overcome QCD confinement and to form a phase of deconfined quarks and gluons during the early stages of the collisions.
This strongly compressed interacting matter expands into the surrounding vacuum, causing the temperature and energy density to drop to the critical values and forcing the system to form hadrons at the phase boundary. During the subsequent stage the hadrons may continue to scatter inelastically and elastically until all interactions cease.
The excitation functions of several observables, e.g. the energy dependence of the pion yield per wounded nucleon and the strange particle per pion ratio indicate that deconfinement indeed appears already in central Pb+Pb collisions at lower SPS energies Gazdzicki:2004ef. The transient existence of a deconfined phase in the early stage of the reaction may be still reflected in such properties as e.g. the lifetime, final size, and collective flow of the freeze-out stage of the reaction Pratt:1986cc; Bertsch:1989vn.
The study of Bose-Einstein (BE) correlations has been shown to contribute unique information on the static and dynamic properties of the system at thermal freeze-out Wiedemann:1999qn; Lisa:2005dd. Traditionally a multi-dimensional Gaussian function, parametrized by radius parameters, is fitted to the BE correlation function. Quantitative parameters of the pion source can be derived from a simultaneous analysis of single-particle transverse momentum spectra and two-particle BE radius parameters using hydrodynamically inspired models describing the evolution of the system. Detailed measurements of the rapidity and transverse momentum dependence of BE correlations for pairs in the full SPS energy range from 20 to 158 GeV beam energy and their interpretation in terms of a rapidly expanding fireball are the subject of this paper. An alternative analysis scheme of BE correlations has been developed Brown:1997ku; Brown:1997sn, which tries to deduce the properties of the pion source directly from the BE correlations by an integral inversion technique. An analysis using this method has been applied to RHIC data Adler:2006as and is currently in progress for the SPS data of NA49.
An earlier analysis of BE correlations at 158A GeV beam energy with the NA49 spectrometer Appelshauser:1997rr pioneered the simultaneous analysis of BE correlations and inclusive transverse momentum spectra. The study found a mean velocity of the collective transverse expansion of and a freeze-out temperature of MeV. Furthermore a strong longitudinal expansion and a finite duration of particle emission of 3 to 4 fm/c were observed. The results presented in this paper basically agree with these findings. One of the major differences of the two analyses lies in the parametrization of the correlation function: in the present work the momentum difference is decomposed into Cartesian components , , and as suggested by Podgoretsky Podgoretsky:1982xu, Pratt Pratt:1986cc, and Bertsch Bertsch:1988db; in the previous publication the parametrization developed by Yano-Koonin Yano:1978gk and Podgoretsky Podgoretsky:1982xu was applied. In addition, in this article also measurements at lower SPS energies will be presented.
Results of an analysis of K+K+ and K-K- BE correlations at 158A GeV beam energy from NA49 were reported in Afanasiev:2002fv. These are less differential due to the much smaller number of kaon pairs. However, taking account of the radial flow and comparing the extracted source parameters at equivalent values of the transverse masses, consistency is found between results from pion and kaon analyses.
The NA49 detector allows to study also correlations of heavier particles. Two-proton correlations at 158A GeV beam energy were analysed in Appelshauser:1999in. Here the contributions from strong interactions, Coulomb repulsion and Fermi-Dirac quantum statistics are of similar magnitude and make it impossible to extract source parameters with the help of a simple parametrization. The final result of that study, i.e. the extracted averaged source radius, is compatible with that obtained from and BE correlations.
Numerous other BE correlation analyses near midrapidity were reported in the literature. Measurements at the AGS can be found in Lisa:2000hw. Results from the SPS were published by experiments NA44 Bearden:1998aq, WA97 Antinori:2001yi, WA98 Rosselet:2002ru, and NA45 Adamova:2002wi. Measurements at RHIC have been reported by STAR Adler:2001zd; Adams:2004yc, PHENIX Adler:2004rq and PHOBOS Back:2004ug. Results show good consistency in general and exhibit remarkably little change over this very large collision energy range. At all energies, hydrodynamic models were found to be able to consistently describe many aspects of the reactions, including the transverse momentum dependence of BE correlations Heinz:2001xi. The exception remains the over-prediction of the experimentally determined pion source radii by several fermi. This could be due to a too simplistic treatment of the freeze-out stage Borysova:2005ng and/or a neglect of possible refractive effects in the fireball within the traditional interpretation of BE correlations Wong:2004gm; Kapusta:2004ju; Cramer:2004ih.
This paper is organized as follows. In section 2 the NA49 experimental setup is described followed by a brief introduction to BE correlations in section 3. Selection criteria for events, tracks, and pairs are presented in section 4. Corrections, systematic uncertainties, and the fitting procedure are described in section 5. Results are presented in section 6. The paper is closed by a discussion in section 7 and conclusions in section 8.
II Experimental setup
The layout of the essential components of the NA49 detector is displayed in Fig. 1.

Trajectories of incident beam particles are measured individually by beam position detectors
BPD 1-3. Collisions occur in a thin lead foil T of 224 mg/cm2 thickness. The main tracking devices
for charged particles are four large Time Projection Chambers (TPC),
labeled VTPC1, VTPC2, MTPCL, and MTPCR in Fig. 1.
Two of them, VTPC1 and VTPC2, are mounted in precisely mapped magnetic fields provided by two superconducting magnets with total
bending power of up to 9 Tm. The TPCs provide large acceptance, efficient reconstruction
and precise tracking for charged particles. The momentum of a charged particle can be determined
from its characteristic deflection in the magnetic field; with the NA49 setup a resolution
of is achieved.
A veto calorimeter VCAL behind a suitably adjusted collimator COLL measures the energy of the projectile
spectators. The event trigger consists of a valid beam track signal in coincidence with an energy deposition
in the veto calorimeter below a preset threshold. Further details of the detector and trigger system
can be found in Afanasev:1999iu.
The detection efficiency depends on particle momentum and varies from about 90% at midrapidity to near 100% in
the forward direction.

The strength of the magnetic field was scaled according to beam energy, i.e. at 20A GeV it was set to 1/8 of the maximum setting at 158A GeV. In this way, the geometric acceptance in the center-of-mass system is kept similar at different beam energies. Fig. 2 displays the raw yields of particle pairs at 20A GeV and at 158A GeV beam energy.
The forward hemisphere in the center of mass of the reaction is well covered allowing differential studies in pion-pair rapidity
| (1) |
calculated in the reaction c.m. system and averaged transverse momentum
| (2) |
where and represent energies and momenta of the pions. Track topology and momentum resolution change with transverse momentum, rapidity, and different settings of the magnetic field. The impact of the finite momentum resolution on the correlation function is discussed in detail in section V.1.
Along with their trajectory, the NA49 TPCs measure the specific energy loss of charged particles traversing the detector gas. Combined with the reconstructed momentum this information allows to identify the particle type. This selection is not applied in the present analysis since the procedure works only in a limited momentum range. The impact of the missing particle identification on the correlation function is discussed in section V.2.
The energy deposition in the veto calorimeter corresponds to the total energy of the projectile spectators and is closely related to the centrality of the collision. At lower beam energies the threshold of the online trigger was set to accept the 7.2% most central events. The dataset at 158A GeV was taken with a 10% online trigger setting, but to ease the comparison the event selection was restricted offline to the 7.2% most central events. The average number of wounded nucleons for the 7.2% most central collisions was estimated by Glauber model calculations and amounts to = 349 with a dispersion of 28.
In the course of the CERN SPS energy scan programme the NA49 experiment used beams with energies of 20A, 30A, 40A, 80A, and 158A GeV. A summary of the central Pb+Pb data sets used in this analysis is given in Table 1.
|
Beam Energy
(GeV) |
(GeV) |
Year of
data taking |
Number of
analyzed events |
Mag. field
Polarity |
| 20 | 6.3 | 2002 | 360k | + |
| 30 | 7.6 | 2002 | 420k | + |
| 40 | 8.7 | 2001 | 217k | - |
| 40 | 8.7 | 2000 | 360k | + |
| 80 | 12.5 | 2001 | 296k | + |
| 158 | 17.3 | 1996 | 386k | + |
| 158 | 17.3 | 2000 | 502k | - |
III Bose-Einstein correlation function
BE correlations are a consequence of the requirement that the quantum mechanical wave function of two identical bosons must be symmetric under particle exchange. This results in an increased probability of emitting pion pairs at small momentum difference relative to the product of probabilities to emit single pions of momentum . The enhancement is usually studied in terms of the correlation function:
| (3) |
Experimentally the correlation function is constructed as the ratio of the pair momentum difference distribution and a mixed-event pair distribution . This reference distribution is constructed by forming pairs of particles from different events. Except for genuine particle correlations, thus includes the features of particle detection with the NA49 apparatus as well as the characteristics of inclusive pion production from the source. The track selection criteria, described in the next section, are applied in the construction of the reference in the same way as in the construction of the signal distribution.
The distribution of spatial distances of the emission points of the two pions is related to the distribution of their momentum difference. In fact, the spatial extension of the pion emitting source is reflected in the width of the BE enhancement in the -dependent correlation function. In this paper, the inverse of the width of the enhancement is labelled the BE radius. Elsewhere it is sometimes also referred to as HBT radius, in reference to the pioneering work of Hanbury Brown and Twiss HanburyBrown:1954wr.
Since momenta and emission points of particles from the source are also correlated due to radial and longitudinal collective flow, the measured radii correspond to lengths of homogeneity Makhlin:1987gm rather than to the actual extension of the source. This feature allows to extract dynamic parameters of the source, if the correlation function is analyzed as a function of the kinematic variables and .
The momentum difference is decomposed into 3 independent components as suggested by Podgoretsky Podgoretsky:1982xu, Pratt Pratt:1986cc, and Bertsch Bertsch:1989vn. The first, , is the momentum difference along the direction of the beam, measured in the longitudinal co-moving system, i.e. in the frame of reference where . The two other components are defined in the plane transverse to the beam, with parallel to the pair transverse momentum vector and perpendicular to and .
The two-particle BE correlation function is in general well approximated by a three dimensional Gauss function
| (4) | |||||
A fit to the measured correlation function yields results for the variances , , , and , which can then be compared to results from model calculations. For several reasons the measured correlation functions have amplitudes smaller than the theoretically expected value of two for vanishing momentum difference. The known sources of the suppression, such as contamination by misidentified particles or by weak decay products, are taken into account by introducing a purity factor , described in section V.2. To allow for additional sources of suppression a coherence parameter is included in the fitting procedure.
IV Event, track, and pair selection
IV.1 Event cuts
Events were accepted if they had a successfully reconstructed beam particle and interaction vertex and an energy deposition in the veto calorimeter within the appropriate range. The position of the main vertex was determined from the set of reconstructed tracks. Its position had to be close to that of the beam track in the transverse plane and close to the known position of the target foil in the longitudinal direction. The deviations of the main vertex coordinates from the expected positions show Gaussian distributions in x (bending plane), y (vertical), and z (longitudinal) directions. Events are accepted if their reconstructed interaction points are not farther away than three standard deviations from the respective mean values.
IV.2 Track cuts
In this analysis, only negatively charged particles satisfying a set of quality criteria on measured track length and distance of closest approach to the event vertex were used.
Usually tracks with less than a minimum number of measured points are excluded from physics analyses of NA49 data. However, it was found that in the VTPC1 detector tracking quality depends on the occupancy of the TPCs which may vary even for fixed multiplicity in an event due to spiraling electrons generating large numbers of clusters in a TPC. These kinds of fluctuations of the performance of the detector cause a subtle dependence of the correlation function on the minimum number of required measured points. In order to avoid this problem the track quality was ensured by requiring a minimum number of 20 potential points simultaneously in one of the VTPCs and one of the MTPCs out of a possible maximum of 72 and 90 points respectively. The number of potential points is derived from a detailed simulation and reconstruction of particle tracks in the detector. It corresponds to the number of charge clusters detectable in the TPC under ideal conditions. Varying this cut over a reasonable interval had no influence on the finally extracted correlations.
To minimize contributions from products of weak decays and from secondary interactions with the detector material only those tracks were accepted that appeared to originate from the main vertex. Extrapolations of tracks to the nominal position of the target were required to deviate not more than 5.0 cm in x-direction and less than 3.0 cm in y-direction from the reconstructed position of the main vertex.
IV.3 Pair cuts
IV.3.1 Two track resolution cut
Since this study focuses on particle correlations at low momentum difference the two-track resolution capabilities of the detectors were investigated carefully. Tracks of particles with small momentum difference travel closely together in the TPCs. If two tracks approach each other the clusters may start to overlap. In this case their charge deposition distributions are not always resolved properly and the ionization points are not sufficiently well reconstructed. In extreme cases measured points might be assigned to the wrong track changing the measured values of momentum differences significantly. Particle pairs possibly affected by the limited two-track resolution are therefore excluded from the analysis.
In preliminary analyses of NA49 data a simple anti-merging cut was applied, based on an “averaged two-track distance”. The distance of two tracks in the transverse plane was calculated at two or more fixed planes, e.g. at entrance and exit of a TPC, and the average of these values was defined as the two-track distance. Only pairs were accepted, which had two-track distances larger than a certain minimum value. A detailed study revealed, that this kind of cut is not able to remove all corrupted pairs, resulting in a drop below unity in the projection of the component of the correlation function visible on the left hand side of Fig. 3. Therefore a more involved procedure was developed which will be described next.

First each particle trajectory is extrapolated through the TPCs and the transverse positions at the nominal longitudinal positions of the individual padrows are stored. Thus, for every pair the distance at each padrow is readily calculable. The trajectories are required to be separated by more than cm at more than 50 consecutive padrows, starting at the end of each TPC (see Fig. 4). If one of the tracks of a pair has less than 50 potential points, the criterion must be fulfilled at all padrows where both tracks have a potential point. Starting from VTPC1, this criterion is tested for each TPC in which both tracks have at least 20 potential points. If the requirement is not fulfilled in all TPCs, the pair is rejected. The impact of this cut on the finally extracted parameter is shown in Fig. 5. Varying this selection criterion can change the finally extracted parameters by up to 5%.


IV.3.2 Split track cut
If not all charge clusters induced by a particle traversing a TPC are assigned to the track during the reconstruction of the track, it is possible that the remaining clusters are reconstructed as a separate track. In this case of “split tracks”(see Fig. 6) additional pairs of low momentum difference are artificially created when constructing the signal distribution. They alter the correlation function at low momentum difference significantly.

The procedure to identify and remove pairs composed of the two segments of a split track is based on the following considerations: since both segments originate from the same particle they have approximately the same number of potential points . The sum of the measured points of both track segments is equal to or smaller than the number of the potential points. Therefore, a corrupted pair most probably has:
| (5) |
Due to possible fluctuations in the determination of the potential and measured number of points the cut value is increased from 1.0 to 1.1, to ensure the removal of all split-track pairs. The criterion is checked for each TPC separately.
IV.4 Examples of correlation functions
Correlation functions are constructed according to Eq. 3 as a three dimensional histogram with 10 MeV/c wide bins. The number of mixed events is chosen such that the background contains about eight times more entries than the signal, making the contribution from the background to the statistical error in the correlation function negligible. Due to the large number of real pairs, the relative statistical error attributed to numerical values of parameters is small. The whole sample of particle pairs is subdivided into kinematic bins for a differential analysis. A bin width of 0.5 units in pair rapidity is chosen, resulting in up to five bins in this direction, covering the range from central rapidity up to beam rapidity at the highest beam energy. In the transverse direction the -value of the pair is used for the binning; five bins are defined with the boundary values 0.0, 0.1, 0.2, 0.3, 0.4, and 0.6 GeV/c. With decreasing beam energy and increasing transverse momentum and pair rapidity the number of pair entries in the signal distribution drops rapidly preventing the fitting procedure from converging; hence fit results are not available in every kinematic bin at each beam energy.
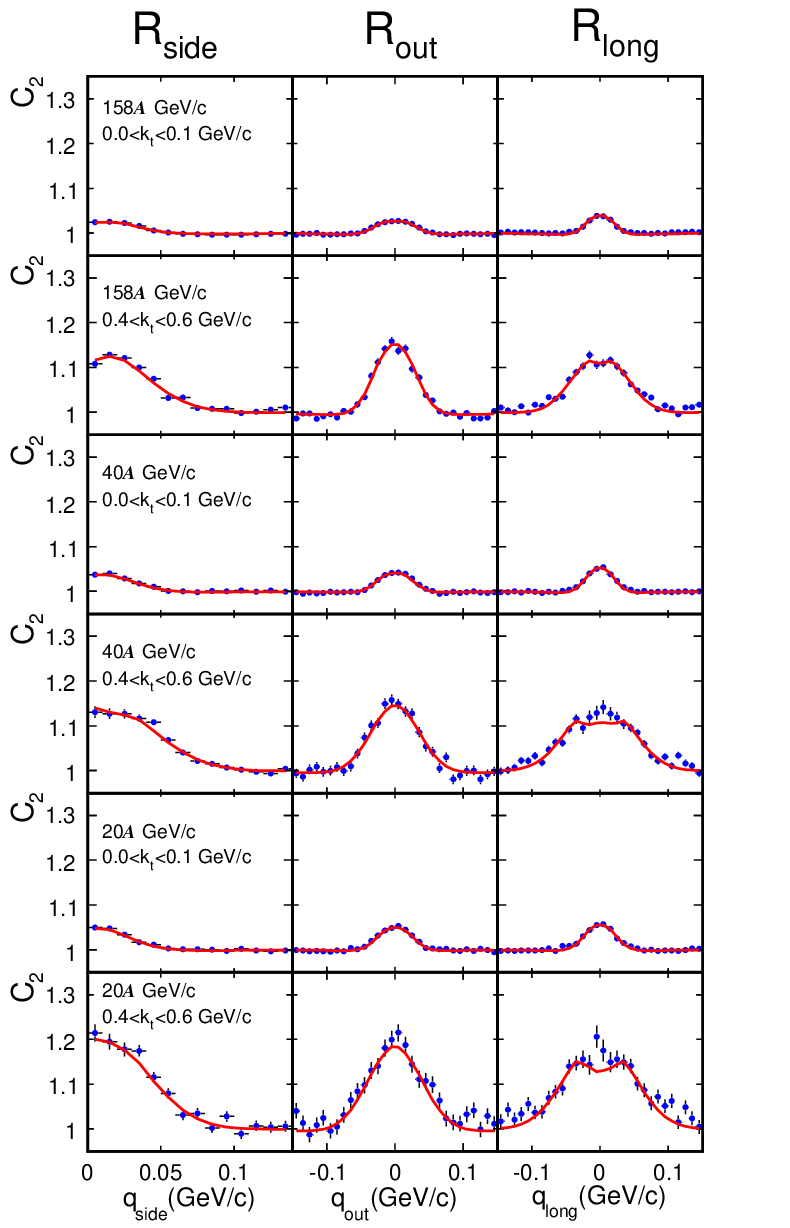
Fig. 7 shows expamles of projections of the measured correlation functions on the momentum difference components , , , with the integration range 0 - 50 MeV/c in both projected components. The examples were obtained for midrapidity, at 20A, 40A, and 158A GeV beam energy and at low ( GeV/c) and higher ( GeV/c) averaged pair transverse momenta. The solid lines represent the fits of Eq. 13 to the 3-dimensional histograms, projected in the same way as the measured correlation functions.
Strong fluctuations of global event characteristics, e.g. of multiplicity or mean pair transverse momentum, can distort the reference distributions. In this analysis no indications of this kind have been observed, hence all events are sampled equally when constructing the mixed pair distributions.
V Corrections, fit procedure and systematic uncertainties
The measured correlation function is a convolution of BE correlations with several physics and detector related effects.
The finite momentum resolution of the NA49 detector distorts the correlation function. The implications for the fitted parameters are discussed in section V.1. The Bose-Einstein enhancement in the measured correlation function is diluted by pairs consisting of at least one particle from a secondary interaction, from a weak decay, or a negatively charged particle of a different identity (K-, , e-). These effects are discussed in section V.2 and are corrected for by introducing a purity factor in the fitting procedure.
The two particle correlation function contains not only BE correlations, but also correlations due to the Coulomb repulsion between two negatively charged particles. Since the aim is to extract correlation lengths due to the Bose-Einstein effect, a correction procedure is applied, which is described in section V.3.
Further contributions to the correlation function, e.g. due to the strong interaction or due to conservation laws, are assumed to be negligible in this analysis. Technical aspects of the fitting procedure are discussed in section V.4.
V.1 Momentum resolution correction
The accuracy of the momentum determination is limited by the finite spatial resolution of the TPCs and by multiple Coulomb scattering of the particles with detector material. The combined result is an uncertainty in the momentum determination which increases with increasing transverse momentum of the particle. For measurements at higher beam energies the decreasing contribution from multiple scattering leads to a slight improvement of the momentum determination.
The finite momentum resolution causes a broadening of the correlation function and hence a reduction of the values of the fitted radius parameters. The size of the effect was determined from a detailed simulation in which the resolution of the momentum difference determination for each bin was derived from a Monte Carlo study modeling the whole particle detection process and the reconstruction algorithm.
The simulation allows to compare the generated momentum difference of a particle pair with the reconstructed value . The differences in each component, e.g. , are filled into frequency distributions. The width of the frequency distribution defines the relative resolution in the respective component, e.g. . Since the momentum resolution depends on the particle momenta (track curvature in the TPCs) the procedure has to be performed differentially for each bin in each (,) interval and has to be redone for each beam energy sample. In the worst case, i.e. at the lowest energy and for the component, the mean resolution is still 5 MeV/c.
The impact of the finite momentum resolution on the correlation function is estimated in the following way: two artificial correlation functions and are generated with their ratio equal to the ratio of the “true” correlation function to the measured one :
| (6) |
Multiplying the measured correlation function with the ratio allows to extract the BE parameters corrected for finite momentum resolution.
represents the correlation function measured by an ideal detector. It is derived from the BE-correlation function given by Eq. 4 assuming BE-parameters close to the fitted ones. Technically, the signal distribution is generated by weighting the measured mixed-pair entries according to Eq. 4: and the background distribution is simply defined as yielding .
In the construction of the correlation function , the weight is calculated in the same way, but the position , where the entry is filled, is obtained from a smearing procedure reflecting the uncertainty in the momentum determination. This procedure results in . The smearing algorithm takes as input the momentum difference of the pair and varies it slightly, using a random generator based on a Gaussian probability distribution with variance and mean equal to .
The effect of momentum smearing on the extraction of the parameters is demonstrated in Fig. 8. Radius parameters fitted with (triangles up) and without (triangles down) momentum smearing are compared. Clearly there is little impact on the fit parameters for the NA49 experiment due to its excellent momentum resolution. Hence a momentum resolution correction is not applied to the correlation functions used in the final fit.

V.2 Missing particle identification and purity factor
No particle type selection was applied since the particle identification capabilities of the NA49 TPCs allow a sufficiently clean particle by particle identification only for laboratory momenta between roughly 5 and 50 GeV/c. This restriction prevents particle identification especially at lower transverse momenta at midrapidity. In other NA49 analyses this deficiency is compensated by using additional information from Time of Flight detectors. However, because of their limited acceptance this information is not employed in this analysis. Instead the correlation functions are determined for all negatively charged particle pairs h-h- and corrected for contaminations.
The fraction of pions in the sample of accepted particles depends on the energy of the collision and on the kinematic region. Fig. 9 shows the rapidity distributions of pions and of the less abundant negatively charged kaons and antiprotons at different beam energies. The pions represent about 90% of the total number of negatively charged particles.

The dilution of the particle sample with non-pions reduces the correlation function. Since correlations between non-pions and any other particle, e.g. K-K- or K, can be neglected, the missing particle identification leads only to a reduction of the fraction of correlated pairs, which is taken into account by introducing the purity factor :
| (7) |
corresponds to the measured correlation function and to the correlation function exclusively containing correlated pairs in the signal distribution. The purity is defined as the ratio of the number of primary pairs to all negatively charged particle pairs in each bin of and .

This procedure has been validated by comparing extracted parameters for h-h- and identified pairs. To enable the particle identification by specific energy loss in the TPC the particle momenta in the laboratory were required to fall into the interval from 5 to 50 GeV/c. This selection allows a comparison only in certain kinematic regions. Where the comparison is possible good agreement was found. An example is given in Fig. 10, where the dependence of fit parameters at midrapidity is shown at 158A GeV beam energy from analyses with and without particle identification (PID), in the latter case with corrections according to Eq. 7.


The measured track sample is not only contaminated with non-pions. Also weak decays of heavier particles away from the vertex can generate pions which cannot be distinguished experimentally from primary particles. These decay products show no correlations with pions generated in the interaction volume. Their contribution to the total number of pion pairs is estimated from simulations and also included in the purity factor . Fig. 11 shows the purity in the analyzed , bins at 158A GeV beam energy.
V.3 Parametrization of the Coulomb interaction
Identical particle correlations occur not only due to the quantum character of the particles. In addition, electromagnetic repulsion between particles of like sign charge modifies the correlation function significantly at small momentum differences. In order to extract the correlations due to Bose-Einstein statistics, the Coulomb interaction is taken into account during the fitting procedure. According to Sinyukov:1998fc the electromagnetic repulsion effect can be parametrized as a function of the modulus of the momentum difference with and the mean pair separation , where the asterisk indicates values calculated in the c.m.s. of the particle pair. If the momentum difference is smaller than , defined as
| (8) |
with the Bohr radius fm and , the Coulomb weight is given by ():
| (9) |
with the Gamov term and . In case is larger than , the Coulomb weight is given by ():
| (10) |
with
| (11) |
Under the assumption that both and the BE parameters are fixed by the same freeze-out conditions and that and the mean pair separation is approximated in Sinyukov:1998fc by
| (12) |
where
During the fitting procedure is approximated by and is obtained iteratively from Eq. 12.
Fig. 13 shows fitted BE parameters using Coulomb weights based on derived from the fitted radii as well as results obtained with fixed values of . Systematic variations of less than 5 % are found in the radii for the different assumptions.

With the NA49 setup it is possible to measure the correlation function of oppositely charged particles. Based on this measurement a Coulomb correction procedure can be derived, not relying on any assumption about the mean pair separation. In this way the Coulomb interaction was taken into account in a previous NA49 publication Appelshauser:1997rr. Since in certain kinematic regions the fraction of positively charged particles which do not contribute to the correlation function is only poorly known but certainly relatively large, the analytical procedure is preferred in the present analysis.
V.4 Fitting procedure
The measured correlation function is fitted by the parametrization:
| (13) |
where represents a normalization factor introduced to account for the different number of entries in the signal and reference distributions. The normalization can be derived in different ways. In this analysis it is determined in the fitting procedure where it is treated as a free parameter. The remaining terms of Eq. 13, the purity , the Bose-Einstein correlation , and the Coulomb correlation have been introduced in the preceding paragraphs.
The free parameters, i.e. the radii , , , , the incoherence parameter and the normalisation constant are obtained from a minimization of
| (14) | |||||
using the MINUIT package James:1994. The fitting routine includes all bins with GeV/c. Varying the fitted range changed the resulting fit parameters by less than 5%. The MINUIT package attributes an error to each parameter, which is equal to the inverse of the second derivative of the function at its minimum with respect to this parameter. Along with the numerical value of each parameter at the minimum of the function its uncertainty is always given. A quantitative estimate of the fit quality is not given, since it depends strongly on the fitted range and details of the fitting procedure. However, comparing the projections of the fitted and measured correlation functions in Fig. 7, it can be concluded that Eq. 13 describes the data very well.
V.5 Systematic uncertainties
The uncertainty of the extracted BE parameters is characterized not only by the error estimated during the fitting procedure, but also by the systematic uncertainties in the whole analysis procedure. Indeed, due to the large statistics of the pair samples, the systematic errors are expected to be larger than the statistical ones.
In order to estimate the systematic errors, the crucial analysis cuts are varied over a reasonable range and the impact of different sets of cuts on the fit parameters is calculated. The following paragraphs discuss the individual cuts which were varied and the impact on the values of the radii.
A detailed comparison to the analysis presented in Adamova:2002wi revealed that the way of normalizing the correlation function may be relevant. In this analysis the normalization is treated as a free parameter in the fit procedure, but it can also be derived from the ratio of the number of entries in the signal distribution to the number of entries in the background distribution. The difference between the fit parameters determined using the two different approaches is taken as an estimate for the systematic uncertainty due to the normalization method. On average, the systematic uncertainty due to the unknown normalization amounts to about 0.1 fm in the radii.
The way the Coulomb interaction is taken into account influences the final results. The size of this effect is estimated by assuming different values for the mean pair separation in Eqs. 8 - 11. The fit is done assuming fm and fm and the resulting parameters are compared to the standard procedure where is determined iteratively from the radius parameters. The maximum difference between the standard procedure and the two extreme cases is taken as an estimate of the systematic uncertainty due to the treatment of the Coulomb interaction. Also this uncertainty may change the final values of the radii by the order of 0.1 fm.
The determination of the purity factor may also influence the final results in a systematic way. Hence the fit was done assuming a purity 20% larger and 20% smaller than the purity derived from the simulations. Again, the maximum difference between the standard approach and the extreme values is taken as an estimate or the uncertainty introduced by the purity determination and amounts in most cases to less than 0.1 fm.
One of the most sensitive pair cuts is the anti-merging cut described in paragraph IV.3.1. As can be seen from Fig. 5 the fit results change considerably with the number of required rows and the minimum separation. Varying the cut values in a reasonable range (45 number of rows 72 and 1.8 cm minimum separation 3.0 cm) and comparing the fit results to the standard cut (number of rows = 50 and minimum separation = 2.2 cm) the size of this systematic uncertainty is estimated. Since it is very time-consuming this procedure is only performed for the bin with the largest expected uncertainty, i.e. at high transverse momentum, at midrapidity and at 158A GeV beam energy. The systematic error due to this uncertainty in the reconstruction process reaches values up to 0.5 fm.
The overall systematic error assigned to the radius parameters is defined as the maximum value of the four errors described above. For the parameter the variation of the purity value was not considered, since these two parameters are directly correlated. In Table 2 both the error from statistics and the systematic error are given. The figures in section VI show statistical errors only.

VI Results
VI.1 Energy and dependence of fit parameters at midrapidity
Fig. 14 shows the dependence of the extracted BE parameters at midrapidity () at the top SPS beam energy of 158 GeV from this analysis (filled dots) along with previously published results from experiments NA44 Bearden:1998aq, WA97 Antinori:2001yi, WA98 Rosselet:2002ru, and NA45 Adamova:2002wi. The parameters , , and decrease with increasing transverse momentum. In heavy-ion collisions, this behaviour is commonly attributed to collective expansion, with the rate of decrease reflecting the strength of the expansion. In section VII, the dependence will be compared to model calculations. At vanishing transverse momentum and are expected to converge. Indeed the increase of flattens at low and the values of approach those of . The parameter remains small, independent of transverse momentum, as expected at midrapidity.
The parameter deviates from unity. Since the dilution of the primary pion pairs by secondary pions and non-pions is already included via the purity factor, the departure of the parameter from unity has to be attributed to physics effects. One often proposed explanation is the incomplete chaoticity of the source. The value of the parameter could also be related to features of the pion emission, e.g. Gavrilik:2005zi discusses the impact of the non-zero proper volume of the pions on the correlation function. It could also be partially caused by a non-Gaussian shape of the correlation function due to e.g. long-lived resonance states, or the approximation used to parametrize the Coulomb interaction Kisiel:2006is. Details of the functional form of the correlation function are currently studied using source imaging methods Chung:2007si introduced in Brown:1997ku; Brown:1997sn.
Fig. 14 also displays published results from other experiments Bearden:1998aq; Antinori:2001yi; Rosselet:2002ru; Adamova:2002wi for comparison. One should note that the analysis procedures applied by the collaborations differ in details, e.g. in the treatment of the Coulomb interaction. Moreover, some experiments did not use the mean transverse momentum variable , but some similar measure. In Fig. 14 differences between those kinematic variables are neglected. Absolute values as well as transverse momentum dependence of radii extracted by the various experiments are similar.

In Fig. 15 the dependence of the fit parameters is plotted at five different beam energies in the central rapidity bin. At all energies, the transverse momentum dependence of the fit parameters is similar. The radii decrease with increasing transverse momentum, neither absolute values nor gradients change significantly with increasing beam energy. The cross term shows small values independent of energy and transverse momentum. The parameter decreases weakly with increasing beam energy.
At 40 and 80 and 158 GeV beam energy, measurements of NA45 Adamova:2002wi are also shown. The radii agree in the side and long component, but NA45 reports systematically smaller values of . The largest discrepancy is observed at 40 GeV beam energy. A detailed comparison study excluded that the origin of the difference lies in the treatment of the Coulomb interaction or in the fitting procedure. Rather it is due to differences in the measured correlation functions themselves.


VI.2 Dependence of fit parameters on rapidity
The dependence of the fit parameters on rapidity is shown in Figs. 16 and 17 for the 5 beam energies of this analysis. At lower transverse momenta (see Fig. 16), the parameter decreases weakly with increasing rapidity, with a larger gradient at smaller beam energies. The parameter remains almost constant at all rapidities and at all energies. The rapidity dependence of the parameter shows no clear systematic trend. At small transverse momenta ( GeV/c) variations of the order of one fermi are observed. The parameter increases clearly with increasing rapidity, as expected for particle sources with non-vanishing longitudinal expansion Chapman:1995vq. The parameter shows no distinct rapidity dependence, but it decreases with increasing energy from values of about 0.8 at 20 GeV beam energy to about 0.6 at 158 GeV beam energy.
The rapidity dependence of the fit parameters at larger transverse momenta is displayed in Fig. 17. Since the pion yield decreases with increasing transverse momentum and with increasing rapidity, the statistics in several kinematic bins, especially at low beam energies at larger rapidities, is too small to obtain a reasonable fit result. The parameters , , and at larger transverse momenta also , depend only weakly on rapidity and on beam energy. The parameter increases with increasing rapidity also at larger transverse momenta. The parameter shows larger fluctuations in the case of higher transverse momenta, but there is no obvious pattern visible.
VI.3 Numerical values
Tables 2 and 3 list numerical values of all fit parameters. The first three columns indicate beam energy, rapidity bin and mean transverse momentum respectively. The next columns give the numerical values of the fitted parameters with their statistical and systematic error in parentheses. For completeness the last two columns give the estimated purity factor and the mean pair separation used for the Coulomb correction and calculated iteratively from the fitted radius parameters.
| (GeV/c) | (fm) | (fm) | (fm) | (fm) | (fm) | ||||
| 20 | 0.0-0.5 | 0.06 | 5.90(0.09)(0.16) | 6.25(0.09)(0.20) | 6.91(0.11)(0.09) | 1.22(0.38)(0.08) | 0.79(0.02)(0.15) | 0.39 | 14.76 |
| 20 | 0.0-0.5 | 0.15 | 5.46(0.08)(0.13) | 5.95(0.08)(0.22) | 5.80(0.08)(0.23) | 1.41(0.25)(0.08) | 0.68(0.01)(0.13) | 0.51 | 15.17 |
| 20 | 0.0-0.5 | 0.25 | 4.73(0.08)(0.14) | 4.98(0.10)(0.35) | 4.42(0.08)(0.24) | 0.00(1.34)(0.00) | 0.64(0.02)(0.09) | 0.63 | 15.12 |
| 20 | 0.0-0.5 | 0.34 | 4.51(0.12)(0.35) | 4.52(0.14)(0.49) | 3.53(0.10)(0.32) | 1.10(0.28)(0.11) | 0.68(0.03)(0.07) | 0.67 | 16.43 |
| 20 | 0.0-0.5 | 0.48 | 4.04(0.14)(0.79) | 3.56(0.16)(0.89) | 2.94(0.14)(0.83) | 0.37(0.65)(0.74) | 0.68(0.05)(0.18) | 0.65 | 16.50 |
| 20 | 0.5-1.0 | 0.06 | 5.70(0.08)(0.13) | 5.95(0.08)(0.20) | 6.56(0.10)(0.09) | 2.45(0.16)(0.16) | 0.79(0.01)(0.14) | 0.45 | 14.12 |
| 20 | 0.5-1.0 | 0.15 | 5.24(0.09)(0.13) | 6.17(0.11)(0.25) | 5.69(0.10)(0.23) | 2.51(0.18)(0.18) | 0.71(0.02)(0.11) | 0.53 | 15.23 |
| 20 | 0.5-1.0 | 0.25 | 4.36(0.10)(0.20) | 5.18(0.14)(0.35) | 4.19(0.11)(0.25) | 2.44(0.17)(0.17) | 0.56(0.02)(0.07) | 0.62 | 15.14 |
| 20 | 0.5-1.0 | 0.34 | 4.05(0.16)(0.59) | 3.87(0.18)(0.75) | 3.31(0.14)(0.50) | 1.38(0.24)(0.19) | 0.53(0.04)(0.09) | 0.66 | 14.32 |
| 20 | 1.0-1.5 | 0.06 | 5.37(0.08)(0.13) | 5.85(0.09)(0.20) | 7.10(0.12)(0.13) | 3.30(0.14)(0.22) | 0.81(0.02)(0.14) | 0.51 | 14.20 |
| 20 | 1.0-1.5 | 0.15 | 4.95(0.10)(0.15) | 6.14(0.13)(0.22) | 5.90(0.13)(0.23) | 3.76(0.16)(0.27) | 0.73(0.02)(0.12) | 0.57 | 15.11 |
| 20 | 1.0-1.5 | 0.24 | 4.20(0.15)(0.35) | 5.50(0.25)(0.75) | 4.32(0.17)(0.46) | 3.54(0.23)(0.52) | 0.63(0.04)(0.05) | 0.65 | 15.73 |
| 20 | 1.5-2.0 | 0.06 | 5.08(0.11)(0.15) | 5.85(0.13)(0.20) | 7.93(0.18)(0.28) | 4.54(0.17)(0.32) | 0.83(0.02)(0.13) | 0.58 | 14.41 |
| 20 | 1.5-2.0 | 0.14 | 4.73(0.11)(0.25) | 6.02(0.15)(0.37) | 6.24(0.16)(0.37) | 4.54(0.17)(0.31) | 0.77(0.03)(0.12) | 0.64 | 15.00 |
| 20 | 2.0-2.5 | 0.06 | 4.87(0.19)(0.52) | 5.46(0.23)(0.66) | 8.65(0.38)(1.21) | 4.86(0.32)(0.73) | 0.86(0.05)(0.11) | 0.67 | 13.40 |
| 30 | 0.0-0.5 | 0.06 | 5.88(0.08)(0.16) | 6.30(0.08)(0.20) | 7.47(0.10)(0.13) | 1.71(0.24)(0.15) | 0.76(0.01)(0.14) | 0.41 | 15.22 |
| 30 | 0.0-0.5 | 0.15 | 5.25(0.07)(0.13) | 6.07(0.08)(0.25) | 6.05(0.08)(0.23) | 1.86(0.18)(0.13) | 0.67(0.01)(0.12) | 0.51 | 15.37 |
| 30 | 0.0-0.5 | 0.25 | 4.65(0.08)(0.14) | 5.21(0.10)(0.35) | 4.51(0.08)(0.24) | 1.51(0.18)(0.08) | 0.58(0.02)(0.08) | 0.59 | 15.60 |
| 30 | 0.0-0.5 | 0.35 | 4.11(0.10)(0.27) | 4.72(0.12)(0.36) | 3.55(0.10)(0.30) | 1.18(0.23)(0.08) | 0.56(0.02)(0.06) | 0.66 | 16.77 |
| 30 | 0.0-0.5 | 0.48 | 3.66(0.11)(0.48) | 4.05(0.15)(0.75) | 2.85(0.09)(0.42) | 1.18(0.20)(2.35) | 0.58(0.03)(0.09) | 0.64 | 18.15 |
| 30 | 0.5-1.0 | 0.06 | 5.54(0.06)(0.13) | 6.03(0.07)(0.20) | 7.06(0.09)(0.10) | 2.21(0.16)(0.18) | 0.77(0.01)(0.14) | 0.45 | 14.45 |
| 30 | 0.5-1.0 | 0.15 | 5.00(0.07)(0.13) | 5.95(0.09)(0.24) | 5.69(0.08)(0.23) | 2.77(0.13)(0.23) | 0.66(0.01)(0.11) | 0.53 | 14.79 |
| 30 | 0.5-1.0 | 0.25 | 4.37(0.10)(0.14) | 5.17(0.13)(0.35) | 4.34(0.11)(0.24) | 2.52(0.16)(0.17) | 0.54(0.02)(0.06) | 0.60 | 15.23 |
| 30 | 0.5-1.0 | 0.35 | 3.93(0.13)(0.36) | 4.38(0.21)(0.78) | 3.45(0.13)(0.47) | 2.32(0.19)(0.47) | 0.52(0.04)(0.08) | 0.66 | 15.69 |
| 30 | 0.5-1.0 | 0.48 | 3.36(0.19)(1.00) | 3.68(0.26)(1.40) | 2.42(0.15)(1.05) | 1.36(0.24)(0.76) | 0.38(0.05)(0.52) | 0.66 | 16.41 |
| 30 | 1.0-1.5 | 0.06 | 5.43(0.06)(0.13) | 5.90(0.07)(0.20) | 7.21(0.09)(0.13) | 3.43(0.11)(0.26) | 0.78(0.01)(0.13) | 0.51 | 14.37 |
| 30 | 1.0-1.5 | 0.15 | 4.97(0.06)(0.13) | 5.94(0.08)(0.22) | 5.88(0.09)(0.23) | 3.61(0.10)(0.29) | 0.72(0.01)(0.12) | 0.55 | 14.86 |
| 30 | 1.0-1.5 | 0.24 | 4.59(0.12)(0.16) | 5.96(0.18)(0.35) | 4.66(0.14)(0.24) | 3.60(0.18)(0.24) | 0.69(0.03)(0.11) | 0.62 | 17.06 |
| 30 | 1.0-1.5 | 0.34 | 4.77(0.23)(0.61) | 3.59(0.34)(1.72) | 4.07(0.20)(0.45) | 1.95(0.31)(0.94) | 0.99(0.13)(0.05) | 0.66 | 14.43 |
| 30 | 1.5-2.0 | 0.06 | 5.21(0.08)(0.13) | 5.71(0.09)(0.20) | 7.71(0.13)(0.26) | 4.35(0.12)(0.32) | 0.76(0.02)(0.12) | 0.59 | 14.12 |
| 30 | 1.5-2.0 | 0.14 | 4.77(0.07)(0.13) | 6.30(0.10)(0.27) | 6.43(0.11)(0.23) | 4.86(0.11)(0.38) | 0.75(0.02)(0.11) | 0.63 | 15.51 |
| 30 | 1.5-2.0 | 0.24 | 4.48(0.13)(0.32) | 5.71(0.19)(0.58) | 5.07(0.16)(0.46) | 4.26(0.18)(0.44) | 0.78(0.04)(0.09) | 0.68 | 16.71 |
| 30 | 2.0-2.5 | 0.06 | 4.91(0.14)(0.24) | 5.45(0.17)(0.32) | 8.43(0.28)(0.59) | 4.72(0.23)(0.40) | 0.76(0.04)(0.09) | 0.69 | 13.42 |
| 30 | 2.0-2.5 | 0.14 | 4.34(0.13)(0.34) | 6.46(0.21)(0.58) | 6.91(0.25)(0.71) | 5.58(0.24)(0.57) | 0.77(0.04)(0.10) | 0.70 | 15.67 |
| 40 | 0.0-0.5 | 0.06 | 5.64(0.06)(0.15) | 6.32(0.07)(0.20) | 7.72(0.09)(0.25) | 1.88(0.20)(0.55) | 0.69(0.01)(0.13) | 0.43 | 15.26 |
| 40 | 0.0-0.5 | 0.15 | 5.43(0.06)(0.13) | 6.04(0.07)(0.25) | 6.41(0.07)(0.23) | 1.05(0.28)(0.07) | 0.67(0.01)(0.12) | 0.53 | 15.70 |
| 40 | 0.0-0.5 | 0.25 | 4.63(0.07)(0.14) | 5.37(0.09)(0.35) | 4.74(0.08)(0.24) | 0.73(0.37)(0.06) | 0.57(0.01)(0.08) | 0.58 | 16.03 |
| 40 | 0.0-0.5 | 0.35 | 4.16(0.09)(0.20) | 4.59(0.12)(0.30) | 3.73(0.09)(0.22) | 0.85(0.30)(0.13) | 0.56(0.02)(0.06) | 0.62 | 16.54 |
| 40 | 0.0-0.5 | 0.48 | 3.73(0.10)(0.36) | 4.02(0.14)(0.54) | 3.15(0.11)(0.36) | 0.00(0.92)(0.50) | 0.58(0.03)(0.08) | 0.62 | 18.20 |
| 40 | 0.5-1.0 | 0.06 | 5.60(0.06)(0.13) | 5.95(0.06)(0.20) | 7.19(0.08)(0.16) | 2.54(0.12)(0.22) | 0.69(0.01)(0.13) | 0.47 | 14.53 |
| 40 | 0.5-1.0 | 0.15 | 5.30(0.05)(0.13) | 6.08(0.07)(0.23) | 6.00(0.07)(0.23) | 2.67(0.11)(0.25) | 0.68(0.01)(0.12) | 0.54 | 15.37 |
| 40 | 0.5-1.0 | 0.25 | 4.25(0.09)(0.14) | 5.72(0.14)(0.40) | 4.42(0.09)(0.24) | 2.24(0.18)(0.22) | 0.54(0.02)(0.08) | 0.57 | 16.30 |
| 40 | 0.5-1.0 | 0.35 | 3.79(0.14)(0.27) | 4.60(0.27)(0.73) | 3.31(0.15)(0.30) | 1.32(0.32)(0.28) | 0.40(0.04)(0.05) | 0.61 | 16.16 |
| 40 | 0.5-1.0 | 0.48 | 3.60(0.20)(0.56) | 5.01(0.43)(1.68) | 2.73(0.17)(0.40) | 1.62(0.30)(0.45) | 0.48(0.07)(0.11) | 0.63 | 21.67 |
| 40 | 1.0-1.5 | 0.06 | 5.41(0.05)(0.13) | 5.88(0.06)(0.20) | 7.17(0.07)(0.14) | 3.18(0.09)(0.26) | 0.73(0.01)(0.13) | 0.52 | 14.32 |
| 40 | 1.0-1.5 | 0.15 | 5.06(0.05)(0.13) | 6.29(0.07)(0.26) | 6.15(0.07)(0.23) | 3.87(0.08)(0.34) | 0.73(0.01)(0.12) | 0.55 | 15.56 |
| 40 | 1.0-1.5 | 0.24 | 4.56(0.08)(0.14) | 5.77(0.11)(0.35) | 4.56(0.09)(0.24) | 3.43(0.11)(0.25) | 0.67(0.02)(0.11) | 0.57 | 16.61 |
| 40 | 1.0-1.5 | 0.34 | 4.26(0.16)(0.38) | 5.00(0.20)(0.58) | 3.69(0.13)(0.34) | 2.77(0.19)(0.37) | 0.70(0.04)(0.09) | 0.59 | 17.66 |
| 40 | 1.5-2.0 | 0.06 | 5.22(0.06)(0.13) | 5.83(0.07)(0.20) | 7.72(0.10)(0.27) | 4.19(0.10)(0.35) | 0.75(0.01)(0.12) | 0.59 | 14.44 |
| 40 | 1.5-2.0 | 0.15 | 4.80(0.06)(0.13) | 6.25(0.08)(0.30) | 6.53(0.08)(0.23) | 4.73(0.09)(0.40) | 0.73(0.01)(0.11) | 0.62 | 15.56 |
| 40 | 1.5-2.0 | 0.24 | 4.25(0.08)(0.16) | 5.97(0.12)(0.35) | 4.92(0.11)(0.24) | 4.24(0.12)(0.30) | 0.72(0.02)(0.09) | 0.65 | 16.98 |
| 40 | 1.5-2.0 | 0.34 | 3.93(0.16)(0.69) | 4.86(0.24)(1.48) | 4.18(0.18)(0.91) | 3.45(0.21)(1.05) | 0.77(0.06)(0.15) | 0.66 | 17.32 |
| 40 | 2.0-2.5 | 0.06 | 4.97(0.10)(0.13) | 5.72(0.12)(0.20) | 8.75(0.21)(0.59) | 5.13(0.17)(0.50) | 0.77(0.03)(0.09) | 0.65 | 14.13 |
| 40 | 2.0-2.5 | 0.14 | 4.48(0.10)(0.16) | 6.69(0.16)(0.39) | 7.23(0.17)(0.36) | 5.83(0.17)(0.50) | 0.72(0.03)(0.09) | 0.68 | 16.27 |
| 40 | 2.0-2.5 | 0.24 | 3.99(0.16)(0.53) | 5.14(0.26)(1.30) | 5.21(0.24)(0.93) | 4.16(0.23)(1.04) | 0.83(0.07)(0.07) | 0.69 | 15.32 |
| (GeV/c) | (fm) | (fm) | (fm) | (fm) | (fm) | ||||
| 80 | 0.0-0.5 | 0.06 | 5.73(0.08)(0.13) | 6.03(0.08)(0.20) | 7.95(0.12)(0.37) | 1.63(0.29)(0.22) | 0.67(0.01)(0.11) | 0.45 | 14.94 |
| 80 | 0.0-0.5 | 0.15 | 5.20(0.07)(0.13) | 6.03(0.09)(0.33) | 6.33(0.09)(0.23) | 1.84(0.21)(0.27) | 0.62(0.01)(0.10) | 0.56 | 15.52 |
| 80 | 0.0-0.5 | 0.25 | 4.74(0.08)(0.14) | 5.55(0.11)(0.35) | 5.17(0.10)(0.24) | 1.45(0.25)(0.12) | 0.66(0.02)(0.10) | 0.62 | 16.73 |
| 80 | 0.0-0.5 | 0.35 | 4.01(0.13)(0.21) | 4.91(0.18)(0.45) | 4.07(0.14)(0.29) | 1.01(0.48)(0.22) | 0.57(0.04)(0.07) | 0.62 | 17.51 |
| 80 | 0.0-0.5 | 0.48 | 3.50(0.23)(0.66) | 4.39(0.41)(1.49) | 3.34(0.24)(0.71) | 0.00(1.99)(0.51) | 0.50(0.09)(0.22) | 0.54 | 19.59 |
| 80 | 0.5-1.0 | 0.06 | 5.27(0.07)(0.13) | 5.67(0.08)(0.20) | 7.49(0.11)(0.34) | 2.20(0.19)(0.28) | 0.61(0.01)(0.10) | 0.51 | 14.06 |
| 80 | 0.5-1.0 | 0.15 | 4.97(0.06)(0.15) | 5.90(0.08)(0.28) | 6.07(0.08)(0.23) | 2.87(0.12)(0.32) | 0.62(0.01)(0.11) | 0.57 | 15.01 |
| 80 | 0.5-1.0 | 0.25 | 4.75(0.09)(0.15) | 5.72(0.11)(0.41) | 4.95(0.10)(0.24) | 2.73(0.15)(0.32) | 0.64(0.02)(0.11) | 0.60 | 16.92 |
| 80 | 0.5-1.0 | 0.35 | 4.38(0.13)(0.23) | 5.35(0.17)(0.37) | 4.14(0.14)(0.26) | 2.37(0.23)(0.25) | 0.69(0.04)(0.10) | 0.60 | 18.93 |
| 80 | 0.5-1.0 | 0.48 | 3.87(0.18)(0.63) | 5.05(0.24)(0.84) | 2.94(0.14)(0.54) | 1.69(0.29)(0.33) | 0.63(0.05)(0.09) | 0.49 | 21.99 |
| 80 | 1.0-1.5 | 0.06 | 5.30(0.07)(0.13) | 5.84(0.08)(0.20) | 7.04(0.10)(0.21) | 3.03(0.13)(0.32) | 0.65(0.01)(0.11) | 0.54 | 14.11 |
| 80 | 1.0-1.5 | 0.15 | 5.13(0.06)(0.13) | 6.13(0.08)(0.30) | 6.16(0.08)(0.23) | 3.46(0.10)(0.35) | 0.68(0.01)(0.12) | 0.59 | 15.47 |
| 80 | 1.0-1.5 | 0.25 | 4.75(0.08)(0.14) | 5.87(0.10)(0.39) | 4.83(0.09)(0.24) | 3.17(0.12)(0.29) | 0.69(0.02)(0.10) | 0.62 | 17.11 |
| 80 | 1.0-1.5 | 0.34 | 4.24(0.12)(0.25) | 5.23(0.15)(0.36) | 3.99(0.13)(0.28) | 2.81(0.16)(0.23) | 0.68(0.03)(0.09) | 0.60 | 18.42 |
| 80 | 1.0-1.5 | 0.47 | 3.41(0.13)(0.56) | 4.27(0.17)(0.88) | 2.73(0.12)(0.55) | 2.15(0.17)(0.43) | 0.55(0.03)(0.06) | 0.52 | 18.69 |
| 80 | 1.5-2.0 | 0.06 | 5.14(0.08)(0.13) | 5.83(0.09)(0.20) | 7.69(0.12)(0.31) | 3.99(0.12)(0.37) | 0.68(0.02)(0.11) | 0.61 | 14.47 |
| 80 | 1.5-2.0 | 0.15 | 4.81(0.07)(0.13) | 6.27(0.09)(0.37) | 6.19(0.10)(0.23) | 4.37(0.10)(0.45) | 0.65(0.02)(0.10) | 0.64 | 15.43 |
| 80 | 1.5-2.0 | 0.24 | 4.14(0.10)(0.14) | 5.90(0.15)(0.45) | 4.86(0.14)(0.24) | 3.97(0.15)(0.39) | 0.61(0.03)(0.07) | 0.66 | 16.80 |
| 80 | 1.5-2.0 | 0.34 | 4.03(0.15)(0.48) | 5.85(0.24)(0.78) | 3.83(0.15)(0.41) | 3.74(0.19)(0.40) | 0.66(0.05)(0.06) | 0.63 | 19.89 |
| 80 | 2.0-2.5 | 0.06 | 4.66(0.11)(0.13) | 5.60(0.14)(0.20) | 8.01(0.21)(0.47) | 4.53(0.18)(0.45) | 0.64(0.03)(0.09) | 0.69 | 13.86 |
| 80 | 2.0-2.5 | 0.15 | 4.28(0.13)(0.15) | 6.19(0.20)(0.48) | 6.27(0.22)(0.37) | 4.83(0.21)(0.59) | 0.52(0.03)(0.06) | 0.70 | 14.97 |
| 80 | 2.0-2.5 | 0.24 | 4.29(0.24)(0.42) | 6.91(0.48)(1.27) | 5.68(0.44)(0.72) | 5.30(0.44)(0.86) | 0.70(0.12)(0.06) | 0.70 | 19.23 |
| 158 | 0.0-0.5 | 0.06 | 5.59(0.05)(0.13) | 6.06(0.06)(0.20) | 7.95(0.09)(0.63) | 0.58(0.55)(0.39) | 0.54(0.01)(0.08) | 0.49 | 15.06 |
| 158 | 0.0-0.5 | 0.15 | 5.25(0.05)(0.13) | 5.90(0.06)(0.41) | 6.65(0.07)(0.28) | 0.85(0.29)(0.28) | 0.58(0.01)(0.07) | 0.58 | 15.64 |
| 158 | 0.0-0.5 | 0.25 | 4.66(0.06)(0.14) | 5.29(0.08)(0.42) | 5.19(0.08)(0.24) | 1.34(0.20)(0.10) | 0.52(0.01)(0.09) | 0.63 | 16.21 |
| 158 | 0.0-0.5 | 0.35 | 4.42(0.07)(0.15) | 4.99(0.10)(0.39) | 4.45(0.08)(0.16) | 1.04(0.28)(0.06) | 0.60(0.02)(0.10) | 0.62 | 18.20 |
| 158 | 0.0-0.5 | 0.48 | 4.17(0.09)(0.15) | 5.05(0.12)(0.39) | 3.85(0.09)(0.15) | 0.84(0.41)(0.05) | 0.73(0.03)(0.10) | 0.58 | 22.80 |
| 158 | 0.5-1.0 | 0.06 | 5.30(0.08)(0.13) | 5.50(0.08)(0.22) | 7.59(0.12)(0.74) | 1.44(0.27)(0.29) | 0.50(0.02)(0.05) | 0.53 | 13.67 |
| 158 | 0.5-1.0 | 0.15 | 5.06(0.05)(0.13) | 5.77(0.07)(0.37) | 6.44(0.07)(0.23) | 2.18(0.12)(0.26) | 0.58(0.01)(0.09) | 0.60 | 15.19 |
| 158 | 0.5-1.0 | 0.25 | 4.67(0.05)(0.18) | 5.66(0.07)(0.44) | 5.27(0.06)(0.24) | 1.87(0.14)(0.20) | 0.61(0.01)(0.11) | 0.61 | 16.97 |
| 158 | 0.5-1.0 | 0.35 | 4.29(0.07)(0.17) | 5.29(0.09)(0.41) | 4.22(0.07)(0.16) | 1.78(0.15)(0.10) | 0.63(0.02)(0.10) | 0.59 | 18.80 |
| 158 | 0.5-1.0 | 0.48 | 4.08(0.08)(0.12) | 5.03(0.11)(0.41) | 3.61(0.08)(0.14) | 1.17(0.24)(0.03) | 0.72(0.03)(0.09) | 0.55 | 22.46 |
| 158 | 1.0-1.5 | 0.06 | 5.03(0.06)(0.13) | 5.21(0.06)(0.20) | 6.63(0.08)(0.36) | 2.24(0.11)(0.29) | 0.47(0.01)(0.06) | 0.59 | 12.95 |
| 158 | 1.0-1.5 | 0.15 | 5.11(0.04)(0.13) | 6.00(0.05)(0.31) | 6.24(0.05)(0.23) | 2.94(0.08)(0.31) | 0.62(0.01)(0.11) | 0.61 | 15.37 |
| 158 | 1.0-1.5 | 0.25 | 4.78(0.05)(0.15) | 5.89(0.06)(0.44) | 4.98(0.05)(0.24) | 2.84(0.08)(0.27) | 0.66(0.01)(0.11) | 0.61 | 17.31 |
| 158 | 1.0-1.5 | 0.35 | 4.36(0.07)(0.14) | 5.37(0.08)(0.43) | 4.07(0.07)(0.13) | 2.14(0.12)(0.12) | 0.67(0.02)(0.09) | 0.60 | 18.96 |
| 158 | 1.0-1.5 | 0.48 | 4.10(0.10)(0.21) | 4.98(0.12)(0.47) | 3.21(0.08)(0.16) | 1.68(0.16)(0.03) | 0.67(0.03)(0.06) | 0.55 | 21.99 |
| 158 | 1.5-2.0 | 0.06 | 5.42(0.05)(0.13) | 5.77(0.05)(0.20) | 7.16(0.07)(0.23) | 3.06(0.09)(0.33) | 0.63(0.01)(0.11) | 0.63 | 14.24 |
| 158 | 1.5-2.0 | 0.15 | 4.98(0.04)(0.14) | 6.20(0.05)(0.33) | 6.12(0.06)(0.23) | 3.83(0.06)(0.39) | 0.64(0.01)(0.11) | 0.64 | 15.44 |
| 158 | 1.5-2.0 | 0.25 | 4.68(0.06)(0.14) | 5.95(0.08)(0.47) | 4.95(0.07)(0.24) | 3.38(0.09)(0.29) | 0.66(0.02)(0.10) | 0.65 | 17.33 |
| 158 | 1.5-2.0 | 0.34 | 4.15(0.11)(0.15) | 5.48(0.13)(0.54) | 3.80(0.12)(0.13) | 2.87(0.13)(0.18) | 0.61(0.03)(0.07) | 0.64 | 18.97 |
| 158 | 1.5-2.0 | 0.47 | 3.86(0.17)(0.47) | 5.59(0.24)(0.83) | 3.13(0.15)(0.31) | 2.36(0.22)(0.08) | 0.69(0.07)(0.10) | 0.55 | 24.00 |
| 158 | 2.0-2.5 | 0.06 | 5.00(0.07)(0.13) | 5.55(0.07)(0.20) | 7.55(0.10)(0.34) | 3.98(0.09)(0.39) | 0.62(0.01)(0.10) | 0.68 | 13.78 |
| 158 | 2.0-2.5 | 0.15 | 4.79(0.07)(0.13) | 6.18(0.08)(0.41) | 6.05(0.09)(0.23) | 4.32(0.09)(0.43) | 0.57(0.01)(0.09) | 0.70 | 15.20 |
| 158 | 2.0-2.5 | 0.24 | 4.46(0.14)(0.17) | 5.78(0.16)(0.60) | 4.60(0.14)(0.24) | 3.78(0.14)(0.33) | 0.54(0.03)(0.06) | 0.69 | 16.60 |
| 158 | 2.0-2.5 | 0.34 | 4.65(0.40)(1.26) | 5.10(0.34)(1.34) | 3.16(0.26)(0.73) | 2.38(0.30)(0.20) | 0.41(0.07)(0.19) | 0.73 | 17.78 |
VII Discussion
VII.1 Relation between radii and source parameters
The correlation function of identical pions measured in heavy-ion collisions is determined by the space-time structure of the system at kinetic freeze-out. The conditions of the kinetic freeze-out result from the expansion of the dense and strongly interacting matter created in the collision into the surrounding vacuum. The evolution of this expansion is defined by the properties of the matter itself; in this way the equation of state of nuclear matter is linked to the measured correlations.
The relation between the dynamic evolution of the system and the measured radii, characterizing the correlation function, cannot be given in a model-independent way. Nevertheless, making several general assumptions, a set of equations connecting key parameters of the expansion to the magnitude of the measured radii and their dependence on the transverse mass have been derived (see e.g. Wiedemann:1999qn and references therein). With the transverse mass defined as , where indicates the pion mass, and , the approximate relations are:
| (15) | |||||
| (16) | |||||
| (17) |
Here denotes the total lifetime of the system and the temperature, the transverse size of the pion source and the strength of the transverse expansion at freeze-out. represents the duration of particle emission. Although, Eqs. 15 - 17 only hold under a number of assumptions, they may serve to guide the interpretation of the measured correlation parameters.
The parameter is connected to the total lifetime of the system. In Figs. 15 - 17 the -dependence of changes only slightly with beam energy and rapidity interval. Assuming a fixed freeze-out temperature this observation means that the lifetime of the system is independent of pion pair rapidity and of incident beam energy.
Also the -dependence of and the intercept when extrapolated to vanishing transverse momentum change little with beam energy, consequently the transverse radius of the particle source at freeze-out and the strength of the transverse expansion vary only weakly with beam energy. Closer inspection of Fig. 16 shows a systematic decrease of the parameter at low transverse momenta with increasing rapidity, suggesting a smaller transverse radius at larger rapidities.
At lower , the parameter is always larger than , indicating a finite emission duration. In some cases at large transverse momenta, the radius parameter is smaller than , rendering relation 17 meaningless. At RHIC energies some analyses also found smaller values of compared to Adler:2001zd, triggering several detailed theoretical studies, e.g. Molnar:2002ax.
Relations 15 - 17 suffer from the fact, that only two-particle correlation functions are considered, while other observables related to the collective behaviour of the fireball are disregarded. Single particle spectra and anisotropic flow measurements also carry information on the expansion and freeze-out temperature and should therefore be addressed together with the BE correlations in order to get a consistent and complete picture of the evolution of the particle-emitting source. In fact, the ambiguity of transverse expansion and temperature in Eqs. 15 and 16 can only be overcome if additional information is provided, e.g. by a simultaneous fit of single particle spectra and the -dependence of the correlation radii, as performed for the first time in Appelshauser:1997rr. Below, the radii will be compared to more comprehensive model calculations, which indeed aim to describe not only the two-particle correlations but also other aspects of heavy-ion collisions.
VII.2 Energy dependence of BE parameters

The dependence of the parameters , , and on transverse momentum in central heavy-ion collisions at various center of mass energies is summarized in Fig. 18. All the data correspond to measured pion-pion correlations at midrapidity, though it should be noted that the analyses differ in details such as the choice of the transverse momentum variable and the treatment of the Coulomb interaction.

From Fig. 18 it is obvious that both the absolute values and the rate of decrease of the radii with increasing transverse momentum exhibit only a weak energy dependence. Since correlations are assumed to reflect the evolution of the system and its structure at freeze-out, these system properties therefore seem to depend only weakly on the initial conditions of the system. As only central collisions are considered, the initial overlap region is similar, but the energy density increases by an order of magnitude between AGS and RHIC energies. This increase of the initial energy density causes a pronounced change in other observables, e.g. a strong increase of the particle abundances and a change in the particle composition.
Fig. 19 shows the energy dependence of the BE radii at GeV/c. The plotted values have been calculated by linear interpolation of the data in Fig. 18. The parameter decreases at AGS energies and remains almost constant at higher energies, the parameter remains almost constant, only the parameter shows a trend to increase with the center of mass energy.
In many model calculations the parameter at is found to be closely related to the transverse size of the system. Under this assumption, the apparent independence of on the center of mass energy in Fig. 19 means that the system at freeze-out reaches roughly the same radial extension irrespective of the initial energy density.
Provided Eq. 15 is a valid approximation and the freeze-out temperature is constant, the slight increase of the parameter might be connected to a longer overall lifetime of the pion source created in central collisions at larger center of mass energies.
The ratio to has been related to the emission duration in the emission function. According to Fig. 19 this ratio is close to unity independent of the center of mass energy. This corresponds (see Eq. 17) to a small emission duration, i.e. to a sudden freeze-out.
In Adamova:2002ff it has been suggested that the freeze-out occurs when the mean free path of the pions,
| (18) |
reaches a value of about 1 fm. Here, denotes the number of particles in the freeze-out volume and the pion cross section. The freeze-out volume has been related to the radii by
| (19) |
Fig. 19 shows this quantity in the lowest panel. In Adamova:2002ff a minimum in the energy dependence of was observed at lower SPS energies, where the system transforms from a baryon- to a meson-dominated system. The radii determined in the present analysis do not confirm this result.
Another ansatz for the interpretation of the beam energy dependence of the extracted radii is given in Akkelin:2004he; Akkelin:2005ms. The product of the radii , , and is used to derive the phase space density of the system averaged over momentum and configuration space. Since this quantity is believed to be conserved at the later stages of the assumed isentropic evolution of the system, it is closely related to the conditions of the system at earlier times, when possibly a phase transition from deconfined matter to a hadronic system occurred. It was found Akkelin:2005ms that the averaged phase space density shows an energy dependence consistent with the appearance of a deconfined phase at lower SPS energies.
VII.3 Rapidity dependence at SPS

This section discusses possible implications of the rapidity dependence of the BE correlation function of pion pairs. With the choice of a particular rapidity interval, particle pairs are selected that are emitted from certain parts of the source: Assuming an emission function as described in Eq. 20, high pair rapidities correspond to large z-values of the last interaction (i.e. emission) point. Using relations 15 - 17, the small decrease with increasing rapidity of the parameter at low transverse momentum implies a smaller transverse extension of the source as well as a higher expansion strength for the forward region of the system. Since does not change with increasing rapidity, but decreases slightly, the emission duration parameter, proportional to the difference of the two, also increases slightly. The parameter varies with rapidity, especially at low , but not in a systematic way. Hence conclusions are hard to derive without consulting more refined model calculations. The cross term clearly rises with increasing rapidity, indicating the strong longitudinal expansion. A different reference frame and parametrization as applied in Appelshauser:1997rr is better suited to quantify the strength of the longitudinal expansion. The results in fact demonstrated approximate boost-invariance.
Experimentally a clear increase of the radii with decreasing impact parameters of the collision has been observed Adams:2004yc; Adamova:2002wi. Decreasing the impact parameter leads to larger rapidity densities. Therefore it has been speculated that there is an explicit relation between the rapidity density and the size of the radii. Since the rapidity density also depends on rapidity (see Fig. 9), this quantity can also be varied – at constant beam energy – by changing the rapidity interval. Fig. 20 displays the dependence of the radii on the rapidity density in central heavy-ion collisions. Though the parameter increases with increasing rapidity density, both and depend only little on rapidity density. This contrasts with the impact parameter dependence, where all three parameters increase from peripheral to central collisions.
VII.4 Blast-wave model
In this section an analytical parametrization (blast-wave (BW) model) by Lisa and Retiere Retiere:2003kf of the hadronic freeze-out is used to determine key characteristics of the evolution of the collision from the measured radii and transverse mass spectra. The parametrization is based on a hydrodynamical ansatz, in which the expansion of the particle source is quantified in the most simple case by only two parameters: The transverse expansion velocity and the temperature. This approach was introduced by Schnedermann et al. Schnedermann:1993ws and has been further developed by several groups, e.g. Csorgo:1995bi; Wiedemann:1998ta; Tomasik:2001uz; Huovinen:2001cy. Details of the parametrization applied here are given in Retiere:2003kf.
The model is based on the assumption of a classical emission function ,
| (20) | |||||
which represents the probability that a pion of momentum decouples at the space point from the particle source. The emission function in form of Eq. 20 is valid only in the longitudinal co-moving system. On the right hand side of Eq. 20 the transverse mass of the emitted particle is labeled , the space-time rapidity of the emission point , and the particle rapidity . If the particle obeys Bose-Einstein statistics is set to , if Fermi-Dirac statistics has to be applied it is set to .
The emission is assumed to occur according to a Gaussian distribution in longitudinal proper time with the mean value labeled and the standard deviation . The density distribution of the source is modeled as a uniform cylinder, i.e. is set to unity if and zero otherwise (so called ’box profile’).
The Boltzmann factor arises from the assumption of local thermal equilibrium at a temperature within a source element moving with four velocity . In the transverse plane, the flow rapidity is assumed to increase linearly with the distance from the origin (beam axis), and the maximum transverse rapidity at the cylinder surface is treated as a free parameter. The longitudinal flow velocity is set to as required by longitudinal boost-invariance. This assumption, introduced by Bjorken Bjorken:1982qr, simplifies the model, but the finite extension of the system and possible deviations from a boost-invariant expansion are neglected.
Fixing the values of the free parameters in Eq. 20 and integrating it yields the predictions for the single-particle spectra:
| (21) |
An optimal set of parameters can be obtained by comparing these predictions with measured transverse momentum spectra and employing a fit procedure. Here it should be pointed out, that the BW parametrization neglects the fact that a large fraction of the measured hadrons, particularly low- pions, stems from resonance decays. The measured spectra actually represent the sum of the spectra of the primary particles and the decay spectra of strongly decaying resonances. Experimentally, these two contributions can not be distinguished. Effects of resonance feeddown on fits with the BW model were minimized by using pion spectra only for GeV/c.
In the BW model Retiere:2003kf the radius parameters are obtained by calculating numerically the appropriate spatial and temporal moments of the emission function for a given set of BW parameter values in Eq. 20. Using an iterative fit procedure, the optimal parameters of the emission function can then be determined by comparison of the computed radius parameters with their measured values and -dependence.
The fitting procedure can treat single-particle spectra and radius parameters simultaneously, ensuring that the finally extracted emission function is better constrained than in studies which consider only one set of observables.
In the present application of the model an azimuthally symmetric source is assumed, since only central collisions are studied. With this restriction the model features five free parameters: the freeze-out temperature , the maximum transverse rapidity , the freeze-out transverse radius , the overall lifetime of the source and the emission duration . Elliptic flow measurements are not included in this study, since the analysis focuses on central collisions. In the following, this parametrization will be fitted to radius parameters and to transverse mass spectra at midrapidity using only statistical errors.
The data points in Fig. 21 show single-particle spectra measured by NA49 at five beam energies at midrapidity and the lines indicate the fit results. The dependence of the production of the various particle species is well described by the parametrization. Since the model only aims to reproduce the shape of the spectra, the normalisation, i.e. the particle yield, was treated as a free parameter in the fitting procedure. Solid lines in Fig. 21 are obtained from the fitting procedure when negative pions, protons and the radii are used as input. The predictions for K+, K- and antiproton spectra were then calculated using the fitted parameters and are shown by the dashed curves in Fig. 21. They are also in excellent agreement with the measurements.

Fig. 22 shows the dependence of the parameters , , and at different incident beam energies at midrapidity compared with the fit values. Both, the absolute values and the transverse momentum dependences are well reproduced. Only the gradient of the -dependence of the parameter tends to be smaller in the parametrization than in the measurement.

The energy dependence of the extracted BW model parameters is plotted in Fig. 23. In addition to results obtained from fits to NA49 data at SPS energies, the figure also includes parameters derived by the same fit procedure from data at lower energies at the AGS Klay:2002; Klay:2003; Lisa:2000hw and at higher energies at RHIC Adams:2004yc; Adams:2004pip; Adcox:2002hbt; Adcox:2002pip. From experiments at the AGS radii for pions and transverse momentum spectra of only pions and protons are available. For consistency, also the fits at higher energies used as input only radii and transverse momentum spectra of pions and protons. Open symbols in Fig. 23 represent the result when only pion and proton spectra are fitted and two-particle correlations are disregarded. In this special case only two parameters are determined, and .
The temperature parameter tends to increase with the available center of mass energy, whereas the surface expansion rapidity saturates at lower SPS energies. The kinetic freeze-out temperature of about 80-100 MeV is lower than the hadro-chemical freeze-out temperature at an earlier stage of the collision. The latter can be derived from the particle species composition resulting in values of about 140-160 MeV Becattini:2003wp. This observation complies with the assumption that the system cools down by rapid expansion first through chemical freeze-out (when inelastic collisions stop in the fireball) and then through kinetic freeze-out (when also elastic interactions cease).
The transverse radius at freeze-out is independent of the beam energy at about 12 fm, which is approximately twice the size of a lead nucleus, indicating the growth of the system. The lifetime of the source depends weakly on energy; it is about 4-6 fm/c at lower energies and increases to 8 fm/c at RHIC energies.
The emission duration takes a finite value at lower energies and increases up to the top SPS energy, then it saturates at a value of 3 fm/c.

VII.5 Comments on other models
The Buda-Lund collaboration uses a parametrization similar to the BW model described in the previous section to describe simultaneously single-particle spectra and radii. The parametrization is introduced in detail in Csorgo:1995bi; Ster:1998hu and has been successfully applied to SPS and RHIC data Ster:1999ib; Csanad:2003sz. The main extensions compared to the simpler blast-wave model are the assumption of a local temperature instead of a single global temperature , and the introduction of a local chemical potential . Preliminary results using this parametrization are similar to those obtained with the BW model discussed in the previous section. A detailed analysis of the data presented here is in progress.
A different approach is provided by pure hydrodynamic calculations, an idealized but well-defined limiting case scenario for the evolution of the system generated in central heavy-ion collisions. This kind of model relies only on the assumption of an equation of state, a set of initial conditions, and on a specific freeze-out criterion. The matter is treated as an ideal, locally thermalized fluid whose dynamics are governed by the relativistic hydrodynamic equations. The freeze-out is usually modeled to occur at a fixed temperature. If the local temperature of a fluid cell drops below the freeze-out temperature, the properties of this cell are converted into an ideal gas of hadrons and hadronic resonances (Cooper-Frye prescription) Tomasik:2002rx; Cooper:1974mv. This leads to an emission function which can be used to calculate the two-particle correlations. This class of models successfully describes bulk properties like the elliptic flow and the transverse momentum spectra of pions. However, the models often fail to reproduce the experimentally observed -dependence of the radii Zschiesche:2001dx; Morita:2002av. The overall lifetime in this class of models is usually found to be large, hence the parameter is often overpredicted. Depending on the assumed equation of state and initial conditions, the parameter is often underpredicted and is overpredicted. Consequently, the ratio of these two parameters, related to the emission duration, is not well reproduced. If the system passes through a first-order phase transition the parameter was predicted to become much larger than Rischke:1996em. Experimentally this signature has not been observed, as can be seen from Fig. 19. However, more refined models are able to describe the data. E.g., in Borysova:2005ng a protracted surface emission is introduced instead of the conventional Cooper-Frye prescription Cooper:1974mv. In this case the -dependence of the ratio is well reproduced. The failure of pure hydrodynamic models might also be due to the fact that the correlations are determined at the final stages of the evolution, when the mean free path of the particles is finite, possibly of the order of the size of the system. In contrast, the basic assumption of the hydrodynamic approach is a zero mean free path.
A different concept is pursued by microscopic models. These provide an approach complementary to the hydrodynamics inspired ansatz described above. In transport approaches, the heavy-ion collisions are modeled by initial particle production from string fragmentation followed by evolving these particles along straight-line trajectories punctuated by collisions according to free-space cross-sections. The result of this microscopic simulation is the state of the system at freeze-out, i.e. the momenta and space-time points of the last interaction. A well known implementation of this kind of models is UrQMD, which is described in detail in Bass:1998ca; Bleicher:1999xi; Bratkovskaya:2004kv. Quantum statistics particle correlations are in principle not included in transport models. Therefore, BE correlations have to be introduced in a second step, e.g. by using an afterburner like the CRAB algorithm Pratt:1994uf; Pratt:2006aa.
The UrQMD model combined with the CRAB algorithm was compared recently to the radius parameters measured at SPS energies Li:2006gb. The model is able to reproduce qualitatively the and rapidity dependence of the radii at all energies. In particlular it reproduces the weak rapidity dependence of the parameters , , and , and the strong increase of the cross term with increasing forward rapidity. The parameter is slightly underestimated and is overestimated at larger transverse momenta. Consequently, the ratio exceeds the measured values.
VIII Conclusion
This paper presents a detailed study of Bose-Einstein correlations in central heavy-ion collisions at five SPS energies. The and rapidity dependence of the fit parameters , , , , and is obtained. A decrease of the radius parameters with increasing transverse momentum is observed. This behaviour has been reported before and is usually attributed to the rapid expansion of the pion source.
Absolute values as well as the gradient of the transverse momentum dependence do not change with incident beam energy. A blast-wave parametrization of the evolution of the system motivated by hydrodynamics yields a freeze-out temperature of 80-100 MeV, a transverse expansion velocity of the order of 72 % of the speed of light at the surface, a transverse radius of the system of about 12 fm, a total lifetime of about 6 fm/c and a finite emission duration of about 3 fm/c. The energy dependence of the radius parameters as well as of the fitted blast-wave model parameters shows no particular structure.
The study of the rapidity dependence of BE correlations reveals that only the parameter depends significantly on the selected pair rapidity. This parameter decreases systematically from midrapidity to forward rapidity. depends only weakly on rapidity and shows some variations at low transverse momenta, but not in a systematic way. The weak rapidity dependence of the radii contrasts with the strong change of the rapidity density of produced particles.
The data set presented here provides stringent constraints for models trying to describe the evolution of central heavy-ion collisions at SPS energies. Experiment NA61, an upgrade and continuation of the NA49 experiment, will extend the systematics with measurements of smaller collision systems Antoniou:2006mh. Moreover, an analysis of BE correlations in NA49 using the source imaging technique Chung:2007si is in progress.
IX Acknowledgments
This work was supported by the US Department of Energy Grant DE-FG03-97ER41020/A000, the Bundesministerium fur Bildung und Forschung, Germany (06f137), the Virtual Institute VI-146 of Helmholtz Gemeinschaft, Germany, the Polish State Committee for Scientific Research (1 P03B 006 30, 1 P03B 097 29, 1 PO3B 121 29, 1 P03B 127 30), the Hungarian Scientific Research Foundation (T032648, T032293, T043514), the Hungarian National Science Foundation, OTKA, (F034707), the Polish-German Foundation, the Korea Science & Engineering Foundation (R01-2005-000-10334-0) and the Bulgarian National Science Fund (Ph-09/05).
References
- (1) U.W. Heinz and M. Jacob, (2000), nucl-th/0002042.
- (2) K. Adcox et al. (PHENIX), Nucl. Phys. A757 (2005) 184, nucl-ex/0410003.
- (3) B.B. Back et al., Nucl. Phys. A757 (2005) 28, nucl-ex/0410022.
- (4) J. Adams et al. (STAR), Nucl. Phys. A757 (2005) 102, nucl-ex/0501009.
- (5) I. Arsene et al. (BRAHMS), Nucl. Phys. A757 (2005) 1, nucl-ex/0410020.
- (6) M. Gazdzicki et al. (NA49), J. Phys. G30 (2004) S701, nucl-ex/0403023.
- (7) S. Pratt, Phys. Rev. D33 (1986) 1314.
- (8) G.F. Bertsch, Nucl. Phys. A498 (1989) 173c.
- (9) U.A. Wiedemann and U.W. Heinz, Phys. Rept. 319 (1999) 145, nucl-th/9901094.
- (10) M.A. Lisa et al., Ann. Rev. Nucl. Part. Sci. 55 (2005) 357, nucl-ex/0505014.
- (11) D.A. Brown and P. Danielewicz, Phys. Lett. B398 (1997) 252, nucl-th/9701010.
- (12) D.A. Brown and P. Danielewicz, Phys. Rev. C57 (1998) 2474, nucl-th/9712066.
- (13) S.S. Adler et al. (PHENIX), Phys. Rev. Lett. 98 (2007) 132301, nucl-ex/0605032.
- (14) H. Appelshäuser et al. (NA49), Eur. Phys. J. C2 (1998) 661, hep-ex/9711024.
- (15) M.I. Podgoretsky, Sov. J. Nucl. Phys. 37 (1983) 272.
- (16) G. Bertsch, M. Gong and M. Tohyama, Phys. Rev. C37 (1988) 1896.
- (17) F.B. Yano and S.E. Koonin, Phys. Lett. B78 (1978) 556.
- (18) S.V. Afanasiev et al., Phys. Lett. B557 (2003) 157, nucl-ex/0210018.
- (19) H. Appelshäuser et al. (NA49), Phys. Lett. B467 (1999) 21, nucl-ex/9905001.
- (20) M.A. Lisa et al. (E895), Phys. Rev. Lett. 84 (2000) 2798.
- (21) I.G. Bearden et al., Phys. Rev. C58 (1998) 1656.
- (22) F. Antinori et al. (WA97), J. Phys. G27 (2001) 2325, hep-ex/0108049.
- (23) L. Rosselet et al. (WA98), Nucl. Phys. A698 (2002) 647.
- (24) D. Adamova et al. (CERES), Nucl. Phys. A714 (2003) 124, nucl-ex/0207005.
- (25) C. Adler et al. (STAR), Phys. Rev. Lett. 87 (2001) 082301, nucl-ex/0107008.
- (26) J. Adams et al. (STAR), Phys. Rev. C71 (2005) 044906, nucl-ex/0411036.
- (27) S.S. Adler et al. (PHENIX), Phys. Rev. Lett. 93 (2004) 152302, nucl-ex/0401003.
- (28) B.B. Back et al. (PHOBOS), Phys. Rev. C73 (2006) 031901, nucl-ex/0409001.
- (29) U.W. Heinz and P.F. Kolb, Nucl. Phys. A702 (2002) 269, hep-ph/0111075.
- (30) M.S. Borysova et al., Phys. Rev. C73 (2006) 024903, nucl-th/0507057.
- (31) C.Y. Wong, J. Phys. G30 (2004) S1053, hep-ph/0403025.
- (32) J.I. Kapusta and Y. Li, J. Phys. G30 (2004) S1069.
- (33) J.G. Cramer et al., Phys. Rev. Lett. 94 (2005) 102302, nucl-th/0411031, Erratum: Phys. Rev. Lett. 95 (2005) 139901.
- (34) S. Afanasiev et al. (NA49), Nucl. Instrum. Meth. A430 (1999) 210.
- (35) R. Hanbury Brown and R.Q. Twiss, Phil. Mag. 45 (1954) 663.
- (36) A.N. Makhlin and Y.M. Sinyukov, Z. Phys. C39 (1988) 69.
- (37) A.M. Gavrilik, (2005), hep-ph/0512357.
- (38) A. Kisiel, W. Florkowski and W. Broniowski, Phys. Rev. C73 (2006) 064902, nucl-th/0602039.
- (39) P. Chung et al. J. Phys. G: Nucl. Part. Phys. 34 (2007) 1109-1112
- (40) S.V. Afanasiev et al. (NA49), Phys. Rev. C66 (2002) 054902, nucl-ex/0205002.
- (41) C. Alt et al. (NA49), Phys. Rev. C73 (2006) 044910.
- (42) Y. Sinyukov et al., Phys. Lett. B432 (1998) 248.
- (43) F. James, CERN Program Library Writeup D506.
- (44) S. Chapman, P. Scotto and U.W. Heinz, Nucl. Phys. A590 (1995) 449c, hep-ph/9506470.
- (45) D. Molnar and M. Gyulassy, Heavy Ion Phys. 18 (2003) 69, nucl-th/0204062.
- (46) D. Adamova et al. (CERES), Phys. Rev. Lett. 90 (2003) 022301, nucl-ex/0207008.
- (47) S.V. Akkelin and Y.M. Sinyukov, Phys. Rev. C70 (2004) 064901.
- (48) S.V. Akkelin and Y.M. Sinyukov, Phys. Rev. C73 (2006) 034908, nucl-th/0505045.
- (49) F. Retiere and M.A. Lisa, Phys. Rev. C70 (2004) 044907, nucl-th/0312024, we would like to thank the authors for providing their code.
- (50) E. Schnedermann, J. Sollfrank and U.W. Heinz, Phys. Rev. C48 (1993) 2462, nucl-th/9307020.
- (51) T. Csorgo and B. Lorstad, Phys. Rev. C54 (1996) 1390, hep-ph/9509213.
- (52) U.A. Wiedemann, Phys. Rev. C57 (1998) 3324, nucl-th/9801009.
- (53) B. Tomasik and U.W. Heinz, Phys. Rev. C65 (2002) 031902, nucl-th/0108051.
- (54) P. Huovinen et al., Phys. Lett. B503 (2001) 58, hep-ph/0101136.
- (55) J.D. Bjorken, Phys. Rev. D27 (1983) 140.
- (56) J.L. Klay et al. (E895), Phys. Rev. Lett. 88 (2002) 102301, nucl-ex/0111006
- (57) J.L. Klay et al. (E895), Phys. Rev. C68 (2003) 054905, nucl-ex 0306033
- (58) J. Adams et. al (STAR) Phys. Rev. Lett. 92 (2004) 112301, nucl-ex/0310004
- (59) K. Adcox et. al. (PHENIX), Phys. Rev. Lett. 88 (2002) 192302, nucl-ex/0201008
- (60) K. Adcox et. al. (PHENIX), Phys. Rev. Lett. 88 (2002) 242301, nucl-ex/0112006
- (61) F. Becattini et al., Phys. Rev. C69 (2004) 024905, hep-ph/0310049.
- (62) A. Ster, T. Csorgo and J. Beier, Heavy Ion Phys. 10 (1999) 85, hep-ph/9810341.
- (63) A. Ster, T. Csorgo and B. Lorstad, Nucl. Phys. A661 (1999) 419, hep-ph/9907338.
- (64) M. Csanad et al., Acta Phys. Polon. B35 (2004) 191, nucl-th/0311102.
- (65) Quark Gluon Plasma 3, eds. R.C.Hwa and X.-N. Wang, World Scientific, 715-777, hep-ph/0210250 (2002).
- (66) F. Cooper and G. Frye, Phys. Rev. D10 (1974) 186.
- (67) D. Zschiesche et al., Phys. Rev. C65 (2002) 064902, nucl-th/0107037.
- (68) K. Morita et al., Phys. Rev. C66 (2002) 054904, nucl-th/0205040.
- (69) D.H. Rischke and M. Gyulassy, Nucl. Phys. A608 (1996) 479, nucl-th/9606039.
- (70) S.A. Bass et al., Prog. Part. Nucl. Phys. 41 (1998) 255, nucl-th/9803035.
- (71) M. Bleicher et al., J. Phys. G25 (1999) 1859, hep-ph/9909407.
- (72) E.L. Bratkovskaya et al., Phys. Rev. C69 (2004) 054907, nucl-th/0402026.
- (73) S. Pratt et al., Nucl. Phys. A566 (1994) 103c.
- (74) S. Pratt, http://www.nscl.msu.edu/ pratt/freecodes/crab /home.html .
- (75) Q. Li et al., J. Phys. G33 (2006) 537, nucl-th/0612030.
- (76) NA61 collaboration, N. Antoniou et al.,Study of Hadron Production in Hadron-Nucleus and Nucleus-Nucleus Collisions at the CERN SPS, proposal CERN-SPSC-2006-034 and addenda CERN-SPSC-2007-004, CERN-SPSC-2007-019.