\ethnote{Authlist}P. Lecomte, D. Luckey, F. Nessi-Tedaldi, F. Pauss \InstfootethInstitute for Particle Physics, ETH Zurich, 8093 Zurich, Switzerland D. Renker \InstfootpsiPaul Scherrer Institute, Villigen PSI, 5232 Villigen, Switzerland
Comparison between high-energy proton and charged pion induced damage
in PbWO4 calorimeter crystals
A PbWO4 crystal produced for the electromagnetic calorimeter of the CMS experiment at the LHC was cut into three equal-length sections. The central one was irradiated with 290 MeV/c positive pions up to a fluence of , while the other two were exposed to a 24 GeV/c proton fluence of . The damage recovery in these crystals, stored in the dark at room temperature, has been followed over two years. The comparison of the radiation-induced changes in light transmission for these crystals shows that damage is proportional to the star densities produced by the irradiation.
submitted to Elsevier for publication in Nucl. Instr. and Meth. in Phys. Research A
1 Introduction
A recent study we performed on Lead Tungstate crystals has demonstrated that hadrons cause a specific, cumulative damage which only affects light transmission, while the scintillation mechanism remains unaffected [1, 2]. The results were obtained exposing the crystals to various fluences of 20 GeV/c or 24 GeV/c proton beams up to the full integrated fluence expected at the LHC. Complementary irradiations with a 60Co source allowed to disentangle the damage due to the associated ionising dose.
However, crystals used in high-energy physics detectors will typically be exposed to hadrons – mostly charged pions – with different energies. In the CMS experiment at the LHC for example [3], the large hadron fluxes are due to particles whose energies rarely exceed 1 GeV. Thus, it had to be established how results obtained with high-energy protons can be scaled to lower energies and different particle types.
2 The crystals
For this study, a crystal was used, labelled w in Refs. [1] and [2], produced by the Bogoroditzk Techno-Chemical Plant (BTCP) in Russia for the electromagnetic calorimeter (ECAL) of the CMS experiment [3]. This crystal had been already tested under irradiation with 60Co photons up to 9.59 kGy, showing a modest induced absorption at the peak of scintillation-emission wavelength, m-1. The damage from irradiation was annealed by heating the crystal to C for 4 h and full recovery was checked through light transmission measurements. Then, the crystal was cut into three equal-length sections, with nearly parallelepipedic dimensions of and lengths of 7.5 cm, which we labelled w1, w2 and w3. The first, w1, and last, w3, sections were irradiated with 24 GeV/c protons at the IRRAD1 facility [4] in the T7 beam line of the CERN PS accelerator, while the middle section, w2, was irradiated with 290 MeV/c pions in the beam line at the Paul Scherrer Institute (PSI) in Villigen, Switzerland.
3 The proton irradiation
Samples w1 and w3 were irradiated at the same time, with w3 placed right behind w1, so that the proton beam was entering through the small face of w1 and the hadronic cascade could develop through both crystals. The same irradiation procedure was followed as in [1], where all details can be found. The fluence was determined through the activation of an aluminium foil covering the crystal front face. The proton beam spot was broadened to cover the whole crystal front face with a flux cm-2h-1. The proton fluence reached was .
4 The pion irradiation
The pion irradiation was performed in the high-flux secondary pion beam line at the Paul Scherrer Institute 590 MeV Ring Cyclotron [5].
Pions are produced there by primary protons hitting a graphite target. They are then extracted from the target at an angle of 8o with respect to the incident protons and then transferred by a beam line containing a magnet-spectrometer in order to select them according to charge and momentum. The beam line was set to deliver positively charged pions to the irradiation zone at a nominal momentum of 300 MeV/c. The protons and positrons contamination was suppressed by inserting 6 mm and 15 mm Carbon foils respectively before and after the last bending magnet. The resulting beam momentum on the crystal was MeV/c, where the error is dominated by the uncertainty in the energy loss in carbon. The neutrons produced by proton interactions in the graphite foils yield a beam contamination below 1%[6], and the positron contamination is of the order of 0.5%[7].
To uniformly irradiate the crystal, it was longitudinally positioned at the waist of the beam in the irradiation zone, where the contribution of the divergence to the beam spot is minimal. Transversally, the beam spot was optimised to have a nearly Gaussian shape in both transverse directions, with a FWHM of mm both, in the vertical and in the horizontal directions. The beam profile was monitored with an X-Y wire chamber placed 11 cm upstream of the crystal, and whose wire signals were displayed on an oscilloscope. A ionization chamber, also placed in the beam, was used to monitor the beam fluence: its digitised induced current , which is proportional to the total beam intensity, was integrated throughout the irradiation.
The crystal was placed on a 20 cm thick Styrofoam support to minimise the amount of surrounding material. Before the start of irradiation, the beam spot profiles were checked in 3 planes by means of self-developing Gafchromic MD55 dosimetry foils [8]. The foils were placed longitudinally at the coordinates corresponding to the entrance face, middle and exit face of the crystal, supported by a Styrofoam holder. A 10 min long exposure of the foils to the beam provided a sufficient contrast to visualise uniform, equally sized beam spots in the three positions. The pion fluence measurements were performed using the activation of aluminium foils, as described in section 5. Further details about the beam line setup and beam control can be found in Ref. [5], [7] and [9]. The crystal was irradiated for 137.4 h, for a total fluence . The average flux on the crystal was .
5 Pion fluence determination
For the pion fluence determination we used the activation of aluminium foils by the beam [6], by determining, with a Germanium spectrometer [10], the amount of 22Na or 24Na isotopes present at the end of irradiation. For this purpose, we placed a 1.588 g aluminium foil, in cross-section, 1 cm upstream of the crystal. For the crystal irradiation, which lasted much longer than the 24Na lifetime h, 22Na was more suitable for a fluence determination. However, precise values of the production cross section for the considered pion energy range can be found in literature only for 24Na [11]. From the existing data we determined an interpolated value at our beam energy, which amounts to
| (1) |
In order to use the 22Na activation for a precise fluence determination for the crystal irradiation, we measured the 24Na/22Na cross section ratio through a 12 h long activation of a 6.3173 g aluminium foil, in cross-section, exposed to the pion beam without the presence of a crystal. Furthermore, during all the pion irradiations, the instantaneous primary beam intensity was recorded every 5 s [12] .
The pion fluence on the foil can be calculated from the number of created 24Na nuclei, using the known cross section (Eq.1), which we label :
| (2) |
with a proportionality constant and the beam intensity for a time interval , provided that .
However, due to the isotope decay, the measured activity for the foil at the time the irradiation ended, , is the one of the leftover isotopes, and it is given by:
| (3) |
Thus, from a measurement of and a precise knowledge of the instantaneous beam intensities throughout the irradiation, it was possible to calculate the true amount of created isotopes:
| (4) |
where
| (5) |
The uncertainty on was calculated as
| (6) |
where each was taken as the half excursion between two subsequent intensity values. The average primary beam intensity was calculated as
| (7) |
and its uncertainty similarly to the one for . For the irradiation of the foil, we obtained A and , while during the crystal irradiation we had A. The small uncertainties in average beam intensities show how stable the beam conditions were throughout the irradiation. The determination of the 22Na activity proceeded analogously, but no corrections for decays during the irradiation needed to be applied, since its duration was much shorter than the 22Na life time, y.
After corrections for beam intensity fluctuations and for the isotope decays since the time of production, the spectrometric analysis of the foil irradiated without a crystal yields a cross section ratio
| (8) |
and thus, using Eq. 1,
| (9) |
This cross section, together with the spectrometric 22Na activity analysis applied to the foil placed in front of the crystal yields, assuming that all 22Na is due to activation by pions, a total pion fluence for the crystal irradiation.
While beam contaminations by other particles are negligible [7, 13], 22Na production by neutrons originating from the hadron cascade in the crystal had to be considered. To quantify this systematic effect, we determined the ratio of the incoming beam fluences measured by the ionization chamber during the foil activation and during the crystal irradiation,
| (10) |
and compared it to the ratio of fluences, , determined from the 22Na activation of the foils assuming it was all due to beam particles. We obtain
| (11) |
to be compared with
| (12) |
The two ratios are consistent within the precision of the measurements, which means that the amount of 22Na isotopes created by neutrons coming from the crystal can be neglected. As an additional cross-check, the fluence ratios above can be compared to the fluence ratio of the primary beam for the two irradiations, which we obtain from Ref. [12] data using Eq. 7:
| (13) |
The consistency observed demonstrates that the beam has been very stable, and that the instantaneous primary beam intensities can be used to take into account the 24Na activity decay in foils during irradiation.
6 Measurements and Results
Hadrons in the range of energies and fluences considered, only change a crystal’s light transmission, while the scintillation mechanisms remain unaffected, as we have shown in Ref. [2]. Thus, this study of damage focuses on the hadron-induced light transmission changes, which have been measured with a Perkin Elmer Lambda 900 spectrophotometer over the range of wavelengths between 300 nm and 800 nm, in steps of 1 nm.
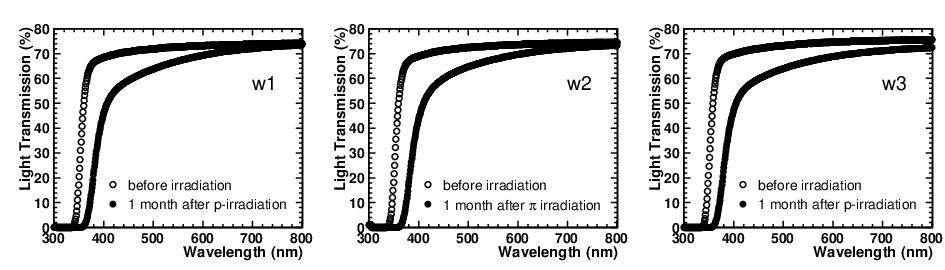


Details to the measuring technique and precision can be found in Ref. [1].The Longitudinal Light Transmission (LT) values measured one month after irradiation on all three crystals through their 7.5 cm length are shown in Fig. 1. It is evident that qualitatively, the LT changes for crystal w2 after pion irradiation are similar to the ones for crystals w1 and w3 after the proton irradiation. In particular, the shift in band-edge observed already in proton irradiations is present in the -irradiated w2 crystal as well, while it is absent in irradiated ones [1]. The comparable magnitude of damage was achieved on purpose by an appropriate choice of irradiation fluences.
Light transmission was measured over time, to provide recovery data. The damage is quantified through the induced absorption coefficient at the peak of the scintillation emission, defined according to [1] as:
| (14) |
where is the Longitudinal Transmission value measured before (after) irradiation through the length of the crystal.
The evolution of damage over time is shown in Fig. 2 for all three crystals. The data, taken over more than 2 years, are well fitted, as in the proton irradiation studies of Ref. [1], by a sum of a constant and two exponentials with time constants :
| (15) |
where is the time elapsed since the irradiation, while and are the amplitude fit parameters for crystal . Figure 2 shows the results of a fit where the recovery time constants have been kept fixed to the values obtained in Ref. [1], days and days. A similar quality can be obtained performing a fit of the form
| (16) |
Such a fit, where is forced to be the same for all three crystals, corresponds, for , to a constant damage amplitudes ratio between crystals, and makes further damage comparisons independent from the time where the measurement is performed. The best fit is obtained from Eq. 16, and it yields days, days and . Since corresponds to the ratio (see Eq. 15), the results indicate that 78% of the long-term damage does not recover, as it is also evident from Fig. 2.
To compare proton- and pion-damage, we performed measurements of the Transverse Light Transmission (TT) profiles along the length of the crystals, 150 days after irradiation, shining the spectrophotometer light beam across their cm transverse dimension. The date was chosen such that the component of the damage had practically disappeared. The damage is quantified through the transverse induced absorption coefficient at the peak of the scintillation emission, , defined analogously to in Eq. 14, with the transverse crystal dimension for each given longitudinal position. The measurements are shown in Fig. 3. The damage as a function of position has the same shape as the star11 1 A star is defined [1] as an inelastic hadronic interaction caused by a projectile above a given threshold energy. densities as a function of depth obtained from FLUKA simulations (Fig. 3 in Ref. [1] and Ref. [14]). This constitutes yet another confirmation of our understanding of the hadron damage mechanisms in Lead Tungstate: it turns out to be proportional to the star densities in the crystals, in that it is due to the very high local ionization from fragments created in nuclear collisions. The observed decrease of damage with depth for crystal w2 is due to the absorption in the crystal and agrees with the measured absorption cross-section in Lead Tungstate that can be extracted from Ref. [15].
The present study was advocated in Ref. [1], to experimentally determine the factor needed to quantitatively scale the damage measured for high-energy protons to the particle spectrum expected at the LHC, which is mostly composed by pions with energies GeV. For this purpose, in Fig. 4 we have normalised to the same particle fluence the transverse damage from pions measured for crystal w2 and the one from protons for crystal w1, and we have plotted their ratio as a function of depth. It should be noticed there, that the large error bars for the first 2 cm of depth are dominated by the uncertainties on the measurement of the very small damage values from protons in w1. In the same plot, we show the ratio of star densities obtained from FLUKA simulations for the two cases [1, 14]. The measured ratios and the star densities ratios are in agreement within the experimental uncertainties. This demonstrates that, at least for the considered particle types and energy range, the measured damage can simply be rescaled to given experimental conditions through the ratio of simulated star densities. Furthermore, in Ref. [1] it was argued that, in addition to star densities, the total track length of stars might play a role. The results shown in Fig. 4 rule out this hypothesis.
7 Conclusions
We have performed a 24 GeV/c proton irradiation of two PbWO4 crystal samples and a 290 MeV/c irradiation of a third one, and we have studied the damage caused to the crystal light transmission. The longitudinal profile of the damage is proportional to the star densities obtained from simulations, and the profile of induced absorption coefficient ratios is well reproduced by the profile of star densities ratios. We conclude that, in a fluence regime where the damage due to the associated ionising dose can be neglected, the damage to be expected from pions at energies around 1 GeV/c can be rescaled from the damage measured for 24 GeV/c protons by means of star densities ratios obtained from simulations.
Acknowledgements
We are indebted to R. Steerenberg, who provided us with the required CERN PS beam conditions for the proton irradiations. We are grateful to the PSI accelerator staff for the very stable beam, and in particular to A.-Ch. Mezger for providing us also with detailed beam intensity data. We are deeply grateful to M. Glaser and F. Ravotti, who helped us in operating the proton irradiation and dosimetry facilities at CERN. We also gratefully acknowledge the help of F. Jaquenod and F. Malacrida who performed the dosimetric measurements at PSI after the pion irradiation. M. Huhtinen’s contribution in the early phases of preparatory work is warmly acknowledged.
References
- [1] M. Huhtinen, P. Lecomte, D. Luckey, F. Nessi-Tedaldi, F. Pauss, Nucl. Instr. Meth. A 545 (2005) 63-87.
- [2] P. Lecomte, D. Luckey, F. Nessi-Tedaldi, F. Pauss, Nucl. Instr. Meth. A 564 (2006) 164-168.
- [3] The CMS Collaboration, The ECAL Technical Design Report, CERN/LHCC 97-33, CMS TDR 4, CERN, Geneva (Switzerland, 1997).
- [4] M. Glaser et al, Nucl. Instr. Meth. A 426 (1999) 72.
- [5] PSI Users Guide: Accelerators Facilities, Paul Scherrer Institute, Villigen PSI (Switzerland, 1994).
- [6] C. Furetta et al., Nucl. Phys. Proc. Suppl. 44 (1995) 503-509.
- [7] E. Frlež et al., Nucl. Instr. Meth. A 526 (2004) 300-347.
- [8] from ISP Technologies, 1361 Alps Road, Wayne, NJ 07470, USA.
- [9] SIN Users Handbook, SIN, Villigen (Switzerland, 1981).
- [10] F. Jaquenod and F. Malacrida, PSI report TM-96-05-12, PSI, Villigen (Switzerland, 2005).
- [11] B. J. Dropesky et al., Phys. Rev. C 32 (1995) 1305.
- [12] A.-Ch. Mezger, PSI (Villigen, Switzerland), private communication.
- [13] S. J. Bates et al., Nucl. Instr. Meth. A 379 (1996) 116-123.
- [14]
M. Huhtinen, CERN (Geneva, Switzerland), private communication and
http://indico.cern.ch/conferenceDisplay.py?confId=a03642 - [15] D. Ashery et al., Phys. Rev. C 23 (1981) 2173-2185.