Energy resolution improvement in room-temperature CZT detectors
Abstract
We present methods to improve the energy resolution of single channel, room-temperature Cadmium-Zinc-Telluride (CZT) detectors. A new preamplifier design enables the acquisition of the actual transient current from the crystals and straightforward data analysis methods yield unprecedented energy resolution for our test-detectors. These consist of an eV-CAPture Plus crystal as standard and 1 cm cube Frisch collar crystals created in-house from low-grade coplanar grid detectors. Energy resolutions of 1.9% for our collar detectors and 0.8% for the eV crystal at 662 keV were obtained. The latter compares favourably to the best existing energy resolution results from pixel detectors.
1 Introduction
The motivation to research CdZnTe (CZT) detectors originates from participation in the COBRA experiment [1], a proposed massive (several hundred kg) array of CZT crystals for double-beta decay research. Taking into account a typical mass of merely a few grams for each crystal, several tens of thousands of crystals will eventually have to be operated reliably over several years. Naturally, such a set-up would become vastly more practical by utilising simple ways to mount and operate individual crystals in the array.
Single-channel readout for each crystal as opposed to coplanar grid detectors is considered to be an attractive option. Already the reduction of wiring close to the crystals by a factor of two would be highly significant in this case. Frisch collar detectors [2] appeared to be the most practical way forward, so we modified three existing coplanar grid crystals, low-grade from eV-Products11 1 Purchased for the COBRA experiment and kindly provided by our collaboration partners.. In order to have a standard to compare with, we purchased one eV-CAPture Plus technology detector which is of much higher quality [3].
2 Experiment
Crystals and preamplifier are housed together in a standard diecast enclosure featuring connectors for preamplifier power, BNC output and High-voltage input (see figure 1). A single HV-power supply (Ortec 659, NIM module) delivers both polarities up to 5kV. Two linear DC power supplies deliver V to the preamplifier (see figure 2). The output signal is connected directly to the data acquisition system (DAQ) using a 50 BNC cable (RG58). The DAQ consists of a 100 MHz sampling digital oscilloscope in a 3U PXI module from National Instruments (NI PXI-5112) mounted in a PXI crate (NI PXI-1042) and is controlled by an embedded controller PC (NI PXI-8186) running custom-made LabView software for digital pulse acquisition. Pulses are streamed directly to disk in binary format for maximum sampling speed when using radioactive sources for detector calibration.
The dynamic range is limited to 7-bit (8-bit oscilloscope, both polarities measured), hence each acquisition needs a little fine-tuning for the vertical range to capture all important structures. We emphasize this point since this has become an issue when calibrating with a Ba-133 source, see figure 8. The 81 keV line resolution is limited by digitisation noise rather than our analysis method whilst the line voltage amplitude is simply too small when the system is set-up to acquire the 356 keV line simultaneously.
The core of the data acquisition system is the preamplifier design, see figure 2. It represents a rather unusual method for readout of semiconductor pulses since it is not a charge-sensitive amplification system. This preamplifier can be described as a straightforward source-follower. The motivation to try this type initially was to learn more about signal formation in the semiconductor, i.e. to specialise the analysis and measurement on pulse-shape in contrast to pulse-height.
The preamplifier is optimised for high-speed, consistent with the data acquisition bandwidth, and highest possible signal–to–noise ratio. Note that both properties are almost mutually exclusive, i.e. speeding up the amplifier worsens the signal and better signal–to–noise ratio slows the amplifier. However, for applications that require a higher signal gain, focussing on low-energy signals for example, it is possible to increase the gain without losing an equal factor in speed. Our application for this set-up, however, targets rather higher energy signals of up to several MeV, hence the circuit in figure 2 is expected to work optimally for us.
The existing three coplanar grid detectors were modified to work as Frisch collar detectors. All three are cubes of volume 1cm3 with gold-plated electrodes, a full area cathode and a coplanar grid anode structure. All faces (excluding the cathode face) are covered with insulating paint. Since we were not interested in operating the grid, paint covering the anode was partly removed (by dissolving it in ethanol) and the area used to contact the anode with a wire was attached by a generous drop of silver conductive paint. The preamplifier is AC-coupled to the crystal anode which is biased positively by the HV-power supply. The cathode is kept at ground potential. This mode was used to operate and test the crystals as simple planar detectors.
For the Frisch collar mode, each crystal was wrapped in two layers of thin teflon tape, covering the full height, leaving out anode and cathode, similar to devices fabricated in [2]. The teflon layer was wrapped in a metal foil (aluminium kitchen foil worked best for us) and the foil attached via a small ’lip’ to the cathode (using silver conductive paint). The metal foil height determines the performance of the Frisch collar detector [2]. We achieved best operating performance with 9mm - 9.5mm foil height. Any higher shield results in stability problems when biasing the anode since the grounded shield appears to be too close, particularly at the cube corners. Finally, prepared crystals can be mounted for operation on a ground plane. We used a small copper-clad piece of printed-circuit board connected to the preamplifier ground, see figure 1.

The eV-Products CAPture Plus technology crystal is essentially a Frisch collar detector using a resistively coupled shield instead of a capacitively one as outlined above. It has, however, one important feature in addition, a small anode, utilising the ’small pixel’ effect [6]. The ’best of both worlds’ has been combined with this type of detector in order to achieve an electron-signal-only operation with a single channel readout. The surface area of the rectangular crystal is 1cm2 and its height is quoted as 5mm. It arrived factory–certified with an energy resolution of 2.20% at the Cs-137 line at 662 keV and 4.40% at the Co-57 line at 122 keV. According to [3], an energy resolution of 1.5% at 662 keV has been achieved under favourable conditions. The crystal is contacted and biased identically to our modified crystals, except that this crystal can withstand higher bias than the Frisch collar crystals (recommended bias is 1.5 kV). Note that an alternative design, utilising the capacitively coupled shield and a small anode has been realised in [4] with excellent results.
In case anode as well as cathode signals are required to be measured with two preamplifiers, it is important to raise the ground plane (PCB) off the diecast box floor to minimise capacitance for the cathode signals. A 1cm insulating spacer should be sufficient. The two-channel readout serves to gain further insight into the signal formation by picking up anode and cathode signal simultaneously for a single event. The ratio of these signals is expected to yield depth information [5] and its sum could improve energy resolution by boosting the total amount of charge collected. So far, we utilised this type of readout only for the eV crystal. Further research into this mode of operation is in progress.

3 Results
Optimising energy resolution for Frisch collar detectors is fully documented in [2]. Performance of crystal operation in this mode was successfully re-produced. However, in this process we noticed that our absolute energy resolutions were surprisingly good compared to the literature. Note that our crystals are remarkably large for CZT crystals operating as Frisch collar detectors and the crystal quality was expected to be poor compared to spectroscopy-grade crystals. Additionally, our readout was custom-made for pulse-shape analysis and not specialised for spectroscopy operation. Obtaining energy information from integrated digitised pulses is always considered to be inferior to analogue operations (current integration on a charge-sensitive preamplifier and spectroscopy shaping). This ’common-knowledge’ can lead to interesting preamplifier designs combining charge and current sensitive readout [7]. Taking all of this into consideration, we were surprised to see our initial energy resolutions comparable to published results. In order to achieve further improvements the following data analysis method has been developed.
Frisch collar detector fabrication inevitably leads to high input capacitances relative to planar crystals. The metal shield wrapped around the bulk of the crystal functions by collecting induced charges from any current flowing inside the capacitively coupled crystal. Thereby, it prevents the majority of the signal appearing on the signal electrodes until the charge cloud comes close to the anode, hence achieving close to electron-only signal formation.


A high input capacitance coupled to the source-follower preamplifier effectively smears or low-pass–filters the image of the current flowing in the detector crystal (interpreted here as a current source). Therefore our signal (see figure 3) is not a true transient current measurement initially. However, a CR-RC filter applied to the digitised pulse can enhance the fast components in the signal by effectively transforming the pulse to its rate-of-change image. After shaping, the pulse more closely represents the actual transient current flowing in the crystal. We found that for the given preamplifier settings and the data acquisition bandwidth, time-constants of 200 ns for the high-pass and 4 s for the low-pass yield satisfactory results for all our cystals. The result of such a shaping is shown in figure 4 for a typical pulse.
Naturally, this shaping process enhances the high-frequency noise, so we decided to apply a second step to this two-stage software filtering in the form of a moving average filter (width 200 ns). Note that a moving average filter belongs to the class of optimal filters, where the moving average filter represents the optimal method to preserve any steep, fast-changing feature in a pulse while smoothing high-frequency noise22 2 All digital filter algorithms as described in the text have been taken from [8].. Figure 5 shows its effect on the pulse from figure 4.
The final analysis step involves calculating basic pulse parameters which serve to extract the integral and therefore the energy of the pulse. Those parameters also greatly help in discriminating against corrupt pulses from pulse pile-up or short-circuit events from over-biasing crystals. We calculate the following set of parameters: baseline, onset, peak position and amplitude, rise-time, decay-time and peak broadness (width at 80% of amplitude left and right from maximum) and finally the integral and the integration risetime. For the two-channel readout we also calculate the sum signal and the ratio.


Figure 6 and figure 8 display the energy spectra obtained from calibrations with a Cs-137 and a Ba-133 source, respectively, both acquired using our test standard, the CAPture Plus crystal. The energy resolutions are listed in table 1. They have been obtained from fits to full energy peaks as shown in figure 7 as an example. Due to the inevitable tailing in single-channel readout systems, we adopted the fitting function from [9], [10] in order to extract reliable energy resolution values.
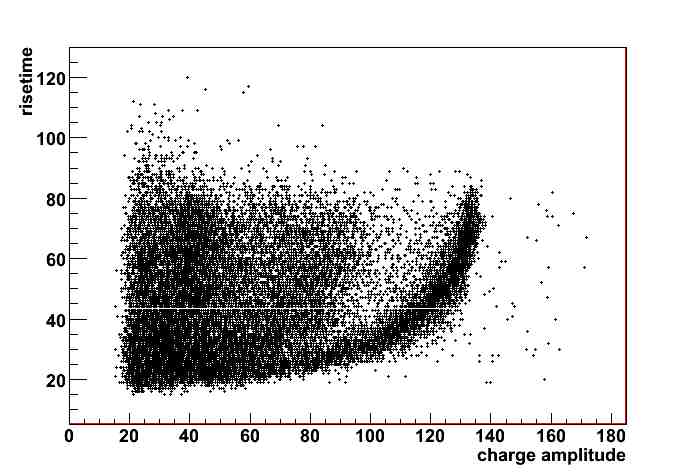
At this point it is worth emphasizing that no subsequent data corrections have been applied, i.e. no rise time to pulse height correlations or any other correlations have been utilised to improve energy resolution. As shown in figure 9, our Frisch collar crystals would benefit greatly from such an offline correction, whereas the CAPture Plus detector does not suffer from a similarly strong tailing, mainly due to the small pixel effect. Ref. [11] shows an impressive effect of such a bi-parametric correction, achieving a similar resolution (less than 1% at 662 keV) using a custom-made Frisch collar crystal, to what we achieve with the CAPture Plus crystal. However, we point out that our main application of CZT detectors in fundamental rare event research (see introduction) does not allow for unspecified event efficiencies. Any data cut would have to be known with highest possible precision, hence it is generally better in such an application not to apply any cut (or energy-dependent corrections) at all. Our analysis merely removes clearly invalid events such as empty baselines and pulses that saturate the data acquisition system.

| Detector and conditions | Peak energy (keV) | FWHM (%) |
|---|---|---|
| CAPture; sum signal | 661.6 | 0.82 |
| CAPture; anode-only | 661.6 | 1.04 |
| CAPture; cathode irradiation | 356 | 1.09 |
| CAPture; anode irradiation | 356 | 1.14 |
| Frisch collar #1, 800V, 9.5mm collar | 661.6 | 1.9 |
| #1, 800V, 9.5mm, cathode irradiation | 356 | 2.7 |
| #1, 800V, 9.5mm, anode irradiation | 356 | 3.0 |
| #1, 1.5kV, 9mm collar | 661.6 | 1.81 |
| #1, 1.0kV, 9mm collar | 661.6 | 1.33 |
| #2, 800V, 9mm collar | 661.6 | 2.2 |
| #3, 1kV, 9mm collar | 661.6 | 2.4 |
4 Conclusion
A new readout and data analysis method for single channel, room-temperature semiconductor detectors is introduced which significantly improves energy resolution despite its simplicity. The new preamplifer circuit and data analysis methods have been discussed in detail. The application to three potentially rather poor CZT crystals operated as Frisch collar detectors yields energy resolutions comparable to or better than existing values from literature either for Frisch collar detectors or coplanar grid detectors of similar size (but often, where mentioned, far superior crystal quality). Our chosen test standard for comparison, an eV-Products CAPture Plus detector, surpasses all expectations and shows energy resolutions, to the best of our knowledge, better than any measured with a similar device so far. Energy resolutions for such a large volume CZT detector of well under 1% at 662 keV without subsequent corrections, i.e. efficiency losses, have so far only been reported for much more complicated (in terms of fabrication and readout) pixelated crystals.
References
- [1] K. Zuber, Phys. Lett. B519 (2001) 1; T. Bloxham et al., COBRA collaboration, Phys. Rev. C76 (2007) 025501
- [2] D.S. McGregor et al., Appl. Phys. Lett. 72 (1998) 792; W.J. McNeil et al., Appl. Phys. Lett. 84 (2004) 1988; G. Montemont et al., IEEE Trans. Nucl. Sci. 48 (2001) 278; A. Kargar et al., Nucl. Instr. Meth. A558 (2006) 497; A. Kargar et al., Nucl. Instr. Meth. A562 (2006) 262; M. Harrison, A. Kargar and D.S. McGregor, Nucl. Instr. Meth. A579 (2007) 134
- [3] D.S. Bale and C. Szeles, Proc. SPIE Vol. 6319 (2006); C. Szeles et al., ibid. (2006) 191; see also White Papers at http://www.evproducts.com/czt_white_papers.html
- [4] L. Verger et al., IEEE Trans. Nucl. Sci. 52 (2005) 1733
- [5] Zhong He et al., Nucl. Instr. Meth. A380 (1996) 228; Nucl. Instr. Meth. A388 (1997) 180
- [6] H. Barrett, J. Eskin and H. Barber, Phys. Rev. Lett. 75 (1995) 156
- [7] A. Hamrita et al., Nucl. Instr. Meth. A531 (2004) 607
- [8] St. W. Smith, The Scientist and Engineer’s Guide to Digital Signal Processing, Cal. Tech. Publ. (1997) USA; see also http://www.DSPguide.com
- [9] Gunnink and Arlt, Nucl. Instr. Meth. A458 (2001) 196
- [10] R.M. Keyser, IEEE Nuclear Science Symposium Conf. Record (2001) 315
- [11] L. Verger et al., Nucl. Instr. Meth. A571 (2007) 33