PoGOLite – A High Sensitivity Balloon-Borne Soft Gamma-ray PolarimeterJournal: Astroparticle Physics
Abstract
We describe a new balloon-borne instrument (PoGOLite) capable of detecting 10% polarisation from 200 mCrab point-like sources between 25 keV and 80 keV in one 6 hour flight. Polarisation measurements in the soft gamma-ray band are expected to provide a powerful probe into high-energy emission mechanisms as well as the distribution of magnetic fields, radiation fields and interstellar matter. Synchrotron radiation, inverse Compton scattering and propagation through high magnetic fields are likely to produce high degrees of polarisation in the energy band of the instrument. We demonstrate, through tests at accelerators, with radioactive sources and through computer simulations, that PoGOLite will be able to detect degrees of polarisation as predicted by models for several classes of high-energy sources. At present, only exploratory polarisation measurements have been carried out in the soft gamma-ray band. Reduction of the large background produced by cosmic-ray particles while securing a large effective area has been the greatest challenge. PoGOLite uses Compton scattering and photo-absorption in an array of 217 well-type phoswich detector cells made of plastic and BGO scintillators surrounded by a BGO anticoincidence shield and a thick polyethylene neutron shield. The narrow field of view (FWHM = 1.25 msr, 2.0 degrees 2.0 degrees) obtained with detector cells and the use of thick background shields warrant a large effective area for polarisation measurements (228 cm2 at keV) without sacrificing the signal-to-noise ratio. Simulation studies for an atmospheric overburden of 3–4 g/cm2 indicate that neutrons and gamma-rays entering the PDC assembly through the shields are dominant backgrounds. Off-line event selection based on recorded phototube waveforms and Compton kinematics reduce the background to that expected for a 100 mCrab source between 25 keV and 50 keV. A 6 hour observation of the Crab pulsar will differentiate between the Polar Cap/Slot Gap, Outer Gap, and Caustic models with greater than 5 significance; and also cleanly identify the Compton reflection component in the Cygnus X–1 hard state. Long-duration flights will measure the dependence of the polarisation across the cyclotron absorption line in Hercules X–1. A scaled-down instrument will be flown as a pathfinder mission from the north of Sweden in 2010. The first science flight is planned to take place shortly thereafter.
Keywords:
Instrumentation: detectors , Techniques: polarimetric , Pulsars: general , X-ray: binaries , Stars: neutron , Galaxies: activePACS
95.30.Gv , 95.55.-n , 95.55.Ka , 95.55.Qf , 95.75.Hi , 95.85.Pw , 97.60Gv , 97.60.Lf , 97.80.Jp , 98.54.Cm, , , , , , , , , , , , , , , , , , , , , , , , , , , , , , , , , , , , , ,
1 Introduction
Celestial X-ray and gamma-ray sources have been studied using their spectrum, time variability and projected image since the early 1960s (see, for example, a review by Fabian et al. [1]). For many sources, such observations alone do not identify the dominant emission mechanism and polarisation measurements are expected to add decisive information. Polarimetry will be particularly important for studies of pulsars, accreting black holes and jet-dominated active galaxies. Strong X-ray and gamma-ray polarisation can arise from synchrotron emission in ordered magnetic fields, photon propagation in extremely strong magnetic fields (1012 Gauss) and anisotropic Compton scattering, as has been discussed in Siddons [2] and reviewed by Lei et al. [3]. The orientation of the polarisation plane probes the intensity and direction of the magnetic and radiation fields, as well as the matter distribution around sources.
Despite the potential importance of polarisation measurements, the Crab nebula is the only source outside the solar system from which polarisation has been significantly detected in this energy range. The first clear detection of polarisation was at 2.6 keV and 5.2 keV, with an instrument on board the OSO–8 satellite (Weisskopf et al. [4, 5]). Due to the limited effective area, the instrument could not detect polarisation from the Crab pulsar or other sources (Silver et al. [6]; Long et al. [7]).
A polarisation detection has been reported from a gamma-ray burst observed with an instrument on the RHESSI satellite in 2002 (Coburn & Boggs [8]). This claim has been seriously challenged and hence remains controversial (Rutledge & Fox [9]; Wigger et al. [10]). A new detection of polarisation in two gamma-ray bursts archived in the BATSE catalog has been published recently (Willis et al. [11]). The authors fitted the observed time-binned counting rates including polarisation-dependent Compton reflection off the atmosphere. The fit indicates a polarisation degree exceeding 35–50%.
Two techniques have been developed to measure hard X-ray (soft gamma-ray) polarisation from astrophysical sources. Below 10 keV, polarisation can be deduced by tracking the electron from photo-absorption in an imaging gas detector. From about 25 keV to 1 MeV, polarisation can be determined by measuring the azimuthal angle distribution of Compton scattered photons as has been exemplified in papers contained in the proceedings edited by Turner & Hasinger [12]. Due to atmospheric opacity, instruments have to be launched into a satellite orbit if the first technique is to be used. Instruments relying on the latter technique can be flown on high altitude balloons since photons with energies greater than keV reach the instrument through typical atmospheric overburdens of 3–4 g/cm2. In this energy band, however, the large background produced by cosmic-ray particles poses significant detector design challenges. Several instruments are under development to detect X-ray or gamma-ray polarisation from astronomical sources using the Compton scattering technique in balloon and satellite experiments. An important figure of merit for these instruments is the lowest degree of polarisation detectable at the 3 level, referred to as the minimum detectable polarisation. Most instruments have gamma-ray bursts as their primary target. Examples include POLAR (Produit et al. [13], 10–300 keV, satellite) and GRAPE (Legere et al. [14], 50–300 keV, long-duration balloon or satellite). PHENEX (Gunji et al. [15]) is designed to detect a 10% polarisation from the Crab nebula in the 40–300 keV range in a 3 hour balloon observation. CIPHER (Silva et al. [16]) will study steady-state objects between 10 keV and 1 MeV with the capability of detecting 5% polarisation from the Crab nebula in a 3 hour satellite orbit observation.
The Polarised Gamma-ray Observer – Light-weight version (PoGOLite) is a balloon-borne astronomical soft gamma-ray polarimeter optimised for point-like sources. It measures polarisation in the energy range 25–80 keV from sources as low as 200 mCrab by using the azimuthal angle anisotropy of Compton-scattered photons. Several features distinguish PoGOLite from other balloon-borne instruments proposed to observe astronomical sources using the Compton scattering technique such as PHENEX [15, 12]:
- •
The narrowest field of view: msr (FWHM).
- •
The largest effective area between 25 keV and 60 keV: 228 cm2 for polarisation measurements at 40 keV.
- •
Sensitivity extends as low as to 25 keV to address the sources and processes mentioned above.
- •
The lowest background rate: 100 mCrab for 25–50 keV.
- •
A slightly lower modulation factor, 33%.
The instrument is currently under construction and an engineering flight of a 61 unit “pathfinder” instrument is planned for 2010 from the Esrange facility in the North of Sweden. The instrument was originally designed to record Compton scattering and photo-absorption in an array of 397 phoswich detector cells made of plastic and BGO scintillators, surrounded by active BGO anticoincidence shields (called PoGO). Through trade-off studies including detector simulation and design, cost estimation and prototype testing, we converged on a lighter version of the original PoGO instrument (Andersson et al. [17]). This new design (PoGOLite) will be able to reach a higher altitude (41–42 km with a 1 million m3 balloon) and extend the lower energy limit down to 25 keV. The lighter design also simplifies implementation of the mechanism which permits the polarimeter to rotate around its longitudinal axis, which is essential in reducing systematic errors in polarisation measurements. The pointing system and gondola design are inspired by the flight-proven design of High Energy Focusing Telescope (HEFT, Gunderson et al. [18]) and Balloon-borne Large-Aperture Sub-millimeter Telescope (BLAST, Pascale et al. [19]). The overall design of the PoGOLite polarimeter and gondola has incorporated features needed to accomplish long-duration balloon flights from Sweden to North America in the future.
In this paper we describe the key PoGOLite polarimeter design features, summarise the results obtained during tests with prototype instruments, and present the scientific potential. Relevant theoretical models for high-energy emission from selected targets will be discussed together with simulated measurements thereof for one 6 hour balloon flight. We show that PoGOLite will open a new obervational window on high-energy astrophysics, with the promise of clarifying the emission mechanism of many sources.
2 PoGOLite Detector and Data Processing
2.1 PoGOLite Detector
The PoGOLite detector consists of a hexagonal close-packed array of 217 well-type phoswich detector cells (PDCs) and 54 side anticoincidence shield (SAS) detectors made of bismuth germanate oxide (BGO) scintillators. This detector assembly is housed in a rotating cylindrical structure (the inner cylinder), which is placed inside another cylindrical structure reinforced with ribs and filled with polyethylene (the outer cylinder) as shown in Fig. 1.
The arrangement of the PDCs is detailed in Fig. 2.

Each PDC, Fig. 3,

is composed of a thin-walled tube (well) of slow plastic scintillator at the top (Eljen Technology EJ–240, fluorescence decay time 285 ns), a solid rod of fast plastic scintillator (Eljen Technology EJ–204, decay time 2 ns), and a bottom BGO crystal (Nikolaev Institute of Inorganic Chemistry, decay time 300 ns), all viewed by one photomultiplier tube (Hamamatsu Photonics R7899EGKNP). The thin-walled well is wrapped with a reflective layer (3M VM2000) and 50 m thick foils of lead and tin, and the bottom BGO is coated with a reflective BaSO4 layer. In the PDCs, the wells serve as active collimators, the fast scintillator rods as active photon detectors, and the bottom BGOs as a lower active shield. The overall length of the active collimator, 600 mm, together with the 24 mm mean diameter well opening, sets the solid angle event acceptance, which is 1.25 msr (2.0 degrees 2.0 degrees). Signals from each PMT are continuously sampled, digitised and recorded at 36 MHz. Through on board examination of the recorded waveforms, signals consistent with being fast scintillator light are selected from those mixed with slow/BGO scintillator light. This well-type phoswich detector technology was developed and used to reduce the cosmic ray-induced backgrounds by more than one order of magnitude for the WELCOME balloon experiments (Kamae et al. [20, 21]; Takahashi et al. [22, 23]; Gunji et al. [24, 25]; Miyazaki et al. [26]; Yamasaki et al. [27]). Based on this success, the technology has been applied to the Suzaku Hard X-ray Detector (Kamae et al. [28]; Makishima et al. [29]; Kokubun et al. [30]). The Hard X-ray Detector is operating in orbit with the lowest background achieved in its energy band, 12–600 keV (Takahashi et al. [31]; Kokubun et al. [32]).
The side anticoincidence system (Marini Bettolo et al. [33]) consists of 54 modules of BGO crystals which cover two thirds of the height of the PDC elements. Each module is built from three crystals glued together, as shown in Fig. 4. The crystals have a pentagonal cross-section and are tightly packed around the PDC assembly. A module-to-module gap of 100 m is foreseen, mainly due to the reflective BaSO4 layer applied to each crystal. The BGO crystals are supplied by the Nikolaev Institute of Inorganic Chemistry and are read out with the same type of phototube that is used for the PDC units.

With an estimated total side anticoincidence rate of about 100 kHz at float altitude, a simple veto would reject about 6% of detected events by random coincidence. The segmentation allows the side anticounter and the PDC hits to be correlated, which will further reduce the number of valid events rejected. Segmentation also allows possible asymmetries in the backgrounds to be studied and corrections to be applied in off-line analysis. The anticoincidence threshold is around 75 keV.
In the PoGOLite design, the PDCs serve to detect and measure both Compton scattering(s) and photo-absorption of astronomical soft gamma-rays. Hence the design is scalable in size and facilitates end-to-end tests from developmental stage. If the two functions had been assigned to different components, it would not have been easy to attain a large effective area nor to perform end-to-end tests.
2.2 Data Processing
Signals from all 217 PDCs and 54 SAS PMTs are fed to individual flash ADCs on 38 Flash ADC (FADC) Boards (see Fig. 5) and digitised to 12 bit accuracy at 36 MHz.

Field programmable gate arrays (FPGAs) check for a transient signal compatible with an energy deposition in the fast scintillator (”clean fast signal”) between a minimum (15 keV) and a maximum (200 keV). A veto signal is issued when the FPGAs detect a transient signal exceeding the upper discrimination level to suppress cosmic ray backgrounds or signals compatible with the rise time characteristic of the slow scintillator or the bottom BGO. Digital I/O (DIO) boards (see Fig. 5) collect the trigger signals from eight FADC boards and process local trigger signals (both clean fast signals and veto signals). A global DIO board collects local trigger signals from DIO boards and processes a global trigger signal. If a clean fast signal is found without a veto signal in a time-window, a global trigger is issued and digitised waveforms are stored for a period of 1.6 s starting 0.4 s earlier than the trigger. Only PDC data with a transient signal greater than a value corresponding to around 0.3 photo-electron (0.5 keV) will be stored in the buffer of the FADC boards for data acquisition. Note that we conservatively assume the threshold to be 1.0 photo-electron in all computer simulations. The FADC boards also save information on what channels have stored waveforms for all triggered events (we call it the hit pattern). In order to minimize the dead time, the DIO boards start accepting triggers as soon as it has received signals from all FADC boards that all waveforms are buffered. The trigger rate is expected to be about 0.5 kHz resulting in a dead time fraction of about 0.6% and a data-rate of about 240 kB/s or 0.9 GB/hr with zero suppression. An onboard computer, the Space Cube (see Fig. 5), collects hit patterns and waveforms tagged by trigger identification numbers from FADC boards asynchronously for dead-time-less data acquisition and records them into flash memory drives. The Space Cube also collects the hit pattern from FADC boards to confirm that all waveforms are collected for every event.
The recorded data is processed in the following steps:
Step 1: Select the PDC where a photo-absorption took place by choosing the highest energy deposition compatible with being a clean fast signal in the fast scintillator. Fig. 6 shows how clean fast signals in the fast scintillator of gamma-rays from 241Am are selected in a high background environment created by electrons from 90Sr irradiating the slow scintillator. Each dot in the figure represents one recorded event: the horizontal and vertical coordinates are the charges integrated over the fast (120 ns) and slow (1 s) intervals respectively. The diagonal concentration of dots between the two dashed lines corresponds to clean fast signals in the fast scintillator.

Data in Fig. 6 indicate strong concentrations around the dominant line at 60 keV and the several weaker lines between 15 and 36 keV in the diagonal slice, all produced by 241Am gamma-rays in the fast scintilltor. Included in the lower-energy concentration are Compton scattered events where only a fraction of the gamma-ray energy is deposited in the fast scintillator. The site with the highest clean fast signal pulse-height is selected as the photo-absorption site.
Step 2: Waveforms from all neighboring PDCs (up to two layers or 18 PDCs) around the identified photo-absorption site are searched for a Compton scattering signal. We estimate the chance of finding 1 Compton scattering hit to be about 20.5%, 2 hits about 10.5% and more than 3 hits about 15.5% when averaged between 20 and 80 keV. We plan to accept the events with 1 and 2 Compton scattering sites. In the beam tests, the Compton site threshold was set to photoelectrons where 0.65 photoelectron corresponds to 1 keV in the fast scintillator. If more than one Compton site is found, the site with highest pulse-height is chosen. This strategy is justified by the fact that a low energy Compton recoil electron means that there is less effect on the azimuthal scattering angle. Our computer simulation shows that the modulation factor of two Compton site events is 23% while it is 35% for one Compton site event. We conservatively assumed a 1.0 photoelectron threshold for detecting Compton scattering in all simulations.
Step 3: Distributions of the sum of the two energy depositions (the photo-absorption site and the Compton scattering site) versus the energy deposition at the Compton scattering site are studied for the selection of valid events. Fig. 7 shows such a distribution obtained with a polarised photon beam at the KEK Photon Factory, Japan, in 2007.

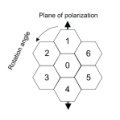
Seven flight-model PDCs were arranged as shown in Fig. 8. The area enclosed by the three dashed-line segments in Fig. 7 denotes the allowed kinematical region for Compton scattered and photo-absorbed events.
For these selected events, we define the azimuthal angle of scattering by a line connecting the centers of the two PDCs where Compton scattering and photo-absorption are detected. Since the polarimeter orientation drifts constantly in the celestial coordinate system during observations and since the polarimeter will be rotated around its axis, the azimuth angle fixed thereon has to be aligned against the position angle around the target object. The distribution of scattering position angles aligned in this way shows a sinusoidal modulation when the incident gamma-rays are polarised. This measured distribution is fitted with a sinusoidal curve with a constant offset, the modulation curve. The modulation factor is defined as the ratio between the amplitude of the sinusoidal part and the offset.
Fig. 9

shows three sets of modulation curves obtained for three coplanar pairs of PDCs in the KEK 2007 prototype. The abscissa is the rotation angle of the prototype relative to the plane of the beam polarisation. The PDC arrangement is shown in Fig. 8. The beam had an energy and polarisation of 25 keV and ()%, respectively. It was aimed at the center of PDC 0 and the 6 possible coincidence pairs (PDC 0–PDC 1, PDC 0–PDC 2, PDC 0–PDC 3, PDC 0–PDC 4, PDC 0–PDC 5 and PDC 0–PDC 6) were combined into three coplanar sets in the figure. The azimuthal angle of Compton scattering is offset by 0, 60 and 120 degrees for the three coplanar pairs PDC 1–PDC 4, PDC 2–PDC 5 and PDC 3–PDC 6, respectively. The measured modulation factor is ()%, in line with expectations. Note that our computer simulation predicts a lower modulation factor when gamma-rays are distributed over the entire cross-section of the PDC, as tabulated in Table 1.
| 25 keV | 30 keV | 40 keV | 50 keV | 60 keV | 80 keV | Total/Average | |
| Min Detectable Pol. in 6 hrs | |||||||
| for a 100 mCrab source | 10.5% | ||||||
| for a 200 mCrab source | 6.5% | ||||||
| Field of view | 1.25 msr (2.0 degrees 2.0 degrees) | ||||||
| Time resolution | 1.0 s | ||||||
| Geometric area | 994 cm2 | ||||||
| Eff. area for pol. measurement | 93 cm2 | 167 cm2 | 228 cm2 | 198 cm2 | 172 cm2 | 158 cm2 | |
| (Attenuation by air not included) | |||||||
| Signal rate for a 100 mCrab source | 0.039 /s/keV | 0.044 /s/keV | 0.039 /s/keV | 0.025 /s/keV | 0.015 /s/keV | 0.0056 /s/keV | 1.52 /s |
| Background rate | 0.043 /s/keV | 0.041 /s/keV | 0.030 /s/keV | 0.029 /s/keV | 0.022 /s/keV | 0.018 /s/keV | 1.77 /s |
| Modulation for 100 % polarised | 33% | 29% | 26% | 27% | 32% | 40% | 32.5% |
| beam with Crab spectrum | |||||||
2.3 Background Suppression
Potential backgrounds affecting the polarisation measurement can arise from extraneous gamma-ray sources within the field-of-view, gamma-rays and charged particles that leak through the side and bottom BGO anticoincidence systems, and neutrons produced in the atmosphere and the gondola structure. For high latitude flights, auroral X-ray emission due to bremsstrahlung emitted at altitudes of 100 km is also a potential background.
The bottom BGO crystals integrated into the 217 PDCs, in combination with the 54 BGO crystal assemblies in the side anticoincidence system (SAS), efficiently suppress the gamma-ray background together with the slow plastic scintillator tubes and the lead/tin foils around the tubes. Polyethylene walls surround the aluminum structures. The averaged thickness of the polyethylene is about 10 cm in the upper part and about 15 cm in the lower portion, as shown in Fig. 1. These walls, along with the slow plastic scintillator tubes, slow down fast (MeV) neutrons to keV energies, thereby making it less likely that a trigger is generated and the selection criteria described in the previous section satisfied.
The PoGOLite design adopts five new background suppression schemes compared to traditional phoswich technology: (1) an active collimator limits the field of view to 1.25 msr (2.0 degrees 2.0 degrees); (2) a thick polyethylene neutron shield is included; (3) all non-zero PDC waveforms are sampled at 36 MHz for about 1.6 s starting 0.4 s before the trigger to eliminate fake events produced by pulse pile-up; (4) additional suppression of neutron-induced background is possible using recorded PDC waveforms as shown in Fig. 10; (5) the counting rate and energy spectrum are recorded for all 54 BGO assemblies of the SAS to facilitate correction for possible azimuthal modulation in background events, as discussed further below.

2.3.1 Background Simulation
Background rates have been calculated using simulation programs based on the Geant4 package (Brun et al. [34]; Amako et al. [35]). The program incorporates background flux models, the PoGOLite detector geometry, the trigger logic, energy-loss due to scintillation light conversion, and the on board and off-line event filtering algorithm.
Background gamma-rays can reach the fast scintillators by crossing the BGO crystals unconverted as well as through gaps between the BGO crystals. The gamma-ray background flux model has been developed based on observational data (Mizuno et al. [36]) and generates diffuse cosmic and atmospheric gamma-rays representative of a balloon environment with 4 g/cm2 atmospheric overburden.
Neutrons can fake valid Compton scattering events through elastic scattering off protons in the fast scintillators. Two or more clean fast signals have to be produced with kinematics compatible with Compton scattering. Since the neutron mean-free-path in the plastic scintillator is less than 1 cm for kinetic energies below 3 MeV, fake events cannot come from neutrons with energies less than 1 MeV. Neutrons must also escape detection in the BGO scintillator. In this regard, we note that the gamma-ray emitting inelastic cross-sections exceed 1 barn in bismuth for neutrons with energies greater than 5 MeV. A combination of these two conditions limits background neutrons to the 1–100 MeV range. The scintillation light yield in one fast scintillator must be consistent with that for the photo-absorption site in the PoGOLite energy band, and the other one with that for the Compton scattering site. Scintillation light emitted by the low-energy recoil proton in n-p elastic scattering is suppressed as described by Verbinski et al. [37] and Uwamino et al. [38]. Our simulation program estimates these processes with dedicated programs within the Geant4 framework using the QGSP_BERT_HP physics list (Koi et al. [39]). We note that 96% of the neutron flux is attenuated by the combination of a 10 cm thick polyethylene wall and 6 cm slow scintillator array. More details can be found in Kazejev [40].
The neutron flux used in the simulation is from a model proposed by Armstrong et al. [41] for an atmospheric depth of 5 g/cm2. The angular distribution is assumed to be isotropic, but we note that according to Armstrong et al. [42], the upward and downward fluxes are typically 80% and 20% of the isotropic flux, respectively. This anistropy in background neutron distribution therefore affects the background rate at less than 20% level.
The neutron flux produced by cosmic rays in the passive components of the payload has been calculated to be negligible based upon an empirical formula developed by Cugnon et al. [43].
Background due to charged particle interactions has been determined to be negligible. This background is eliminated by requiring that the pulse-height lies between lower and upper discrimination levels, and by the anticoincidence function of the BGO shield embedded in the PDC assembly and the SAS.
The background presented by auroral X-rays in high latitude flights (e.g. from the Esrange facility in Northern Sweden) has been studied by Larsson et al. [44]. In a conservative scenario, significant auroral X-ray emission is predicted for less than 10% of the flight time during a long duration flight from Esrange. The resulting X-ray fluxes in the PoGOLite energy range are expected to be of a few tens of mCrab. Short duration spikes exceeding 100 mCrab are also possible. In order to identify periods with significant auroral activity, PoGOLite will be equipped with auroral monitoring instruments (narrow passband photometers and magnetometers). It is noted that although a background for PoGOLite, polarization measurements of auroral emission will provide unique results, allowing the pitch angle distribution of the incident electrons to be determined, thereby giving essential clues to the acceleration processes at play.
We also expect higher charged particle, neutron and gamma-ray backgrounds during flights from Northern Sweden than from Texas or New Mexico, USA. We plan to assess backgrounds during an engineering flight from Sweden and increase the thickness of the neutron shield before making long-duration flights if needed.
The total background rate is shown in Fig. 11 with filled circles, the neutron background rate with open circles, and the gamma background rate with filled squares. These rates can be compared with signal coincidence rates for a 1 Crab source (thick solid histogram) and a 100 mCrab source (thin solid histogram). The expected total background coincidence rate is equivalent to that of a 100 mCrab source between 25 and 50 keV. Our simulation program predicts about 60–70% of the total background to be produced by albedo neutrons and the rest by albedo gamma-rays. The contribution from charged cosmic rays will be less than 10%.

2.3.2 Minimizing Possible Systematic Bias
Backgrounds can affect polarisation measurements in two different ways. First, the minimum detectable polarisation deteriorates due to statistical fluctuations in the background counts. For most polarised astronomical sources, 10–20% polarisation is expected. This means an instrument must be able to detect a 3–6% modulation factor. Instrumental response must be axially symmetric to better than a few percent. Various sources of asymmetry are expected: anisotropy in background events, systematic offset in the pointing and asymmetry in the instrument response.
To reduce systematic bias, the PDC assembly will be rotated axially in 15 degree steps. Such a rotation mechanism has been implemented in the beam tests and the measured modulation factors for six combinations of photo-absorption and Compton scattering sites have agreed to within 2% in absolute value.
Second, the background due to albedo neutrons will be anisotropic when the polarimeter axis is tilted off the zenith. Such an anisotropy will be monitored by recording counting rates for all 54 BGO crystal assemblies of the SAS and for the outermost 48 PDC units. The measured anistropy will be used to remove modulation artifacts introduced by background events.
3 Performance Verification with Accelerator Beams and Computer Simulations
Various prototype PDCs have been tested in polarised gamma-ray beams to verify the simulation program – including physics processes implemented in Geant4 – and subsequently to guide optimisation of trigger thresholds and the event selection algorithm. In 2003, a beam test was conducted at the Argonne National Laboratory, in which the analysis on the azimuthal modulation demonstrated errors in the treatment of photon polarisation in the Compton/Rayleigh scattering processes implemented in Geant4 (Mizuno et al. [45]). The next test, conducted at KEK in Japan, was aimed at studying the low energy response of the PMT assemblies (Kataoka et al. [46]). One flight PDC and 6 prototype PDCs were then tested at KEK in 2004 and the revised Geant4 model was verified to 3% (absolute) in modulation factor (Kanai et al. [47]). The most recent test at KEK was completed in March 2007 with 7 flight-version PDCs and front-end electronics. The measured modulation for ()% polarised 25 keV gamma-rays is presented in Fig. 9 and the details will be described in a separate publication (Takahashi et al. [48]).
The response of the PDC fast plastic scintillator to neutrons in the MeV energy range has been studied in great detail. Tests with neutrons produced in the decay of 252Cf confirm that the neutron-induced background can be reduced by about 49% while sacrificing about 28% of gamma-ray events between 45 keV and 75 keV (see Fig. 10). This filtering can be applied during off-line analysis to the outer-most layer of PDCs where neutron background events concentrate. The PDC response in the 10 MeV range and the validity of the Geant4 simulations of the in-flight neutron background described in Section 2.3.1 were tested with 14 MeV neutrons from a D–T reaction. In these tests, a simplified detector geometry, consisting of four fast plastic scintillators and three SAS BGO crystals as shown in Fig. 12, was used. This detector array was surrounded by a 10 cm thick polyethylene shield, mimicking the PoGOLite detector construction.

The neutron count rate in the central scintillator (Fast0) was measured both with and without active vetoing in the surrounding scintillators. In both cases, the recorded spectrum was well reproduced in simulations. A example is given in Fig. 13, which shows the measured and the simulated spectrum obtained with the vetoing system in use.

The neutron count rate was reduced by (584)% after active vetoing, and the corresponding result from simulation is (57.01.4)%. This agreement indicates that Geant4 and the QGSP_BERT_HP physics list provide a reliable reconstruction of neutron interactions in the PoGOLite instrument. Further details of these measurements and simulations will appear in a separate publication (Kiss et al. [49]).
Simulation studies show that charged cosmic ray interactions in the PDC assembly can be filtered out to a negligible level because of their higher energy deposition. However, saturation effects due to large signal depositions could mimic low-level fast scintillator signals in subsequent events. Moreoever, in the SAS, cosmic ray crossing can introduce dead time and lower offline event filtering efficiency. Various tests were conducted with a proton beam (392 MeV) at the Reseach Center for Nuclear Physics in Osaka to study the behavior of the front-end electronics under cosmic ray bombardment. In a test run, a gamma-ray spectrum from 241Am irradiating the fast scintillator was recorded while protons bombarded either the slow scintillator tube or the bottom BGO of the PDC. We found that the spectrum is little affected down to about 20 keV for a proton rate of 5 kHz, which is more than an order of magnitude higher than the expected cosmic ray rate. The measurement described in section 2.2 and Fig. 6 also show that clean fast signals (gamma-rays from 241Am) are recovered even under an intense electron bombardment (10 kHz) of the slow scintillators.
The expected PoGOLite performance as given in Table 1 has been calculated based upon beam test results and simulations. By reducing backgrounds and having a large effective area (about 228 cm2 at 40 keV), PoGOLite is able to detect a 10% polarised signal from a 200 mCrab source in a 6 hour flight.
4 Science with PoGOLite
4.1 Crab Nebula
The Crab Nebula has been the prime target of polarisation measurements in several electromagnetic wave bands. The first detection of large polarisation in the optical band, by Vashakidze [50], Oort & Walraven [51] and Woltjer [52], led to the establishment of synchrotron radiation as the dominant emission mechanism in the optical band, similar to the process suggested as an explanation for the polarised radio emission by Shklovsky [53]. Stimulated by the implication that electrons are accelerated to high energies in the nebula, many X-ray observations followed, including high spatial resolution (15 arcsec) mapping of the nebula in the X-ray band (1–6 keV) by Oda et al. [54]. The authors concluded that the X-ray source is extended and that its intensity profile is consistent with its optical image. Several high spatial resolution maps were obtained in the soft gamma-ray band using lunar occultation of the Crab nebula (see references given in Aschenbach & Brinkmann [55]).
Aschenbach & Brinkmann [55] modeled the X-ray emitting structure of the Crab nebula based on observations available then and concluded that high energy electrons are trapped in a magnetic torus around the Crab pulsar and emitting synchrotron radiation. We note that Rees & Gunn [56] demonstrated theoretically that a magnetic torus will be built up by the relativistic outflow of the Crab pulsar. The plane defined by the magnetic torus was predicted to be perpendicular to the spin axis of the Crab pulsar. The radiation region can extend well beyond the torus and its size is determined by the magnetic field and involves both electron diffusion and bulk motion. The diameter was calculated to be around 1 arcmin at 20 keV and 2–4 arcmin in the optical band by Aschenbach & Brinkmann [55]. The authors noted that the observed elongation in the optical emission region was orthogonal to that in the X-ray emission region, probably due to propagation conditions of the electrons. For higher energy X-rays, the emission region was predicted to shrink to an extended elliptical configuration with a major axis of about 40 arcsec and a minor axis of 22 arcsec.
The entire Crab nebula was imaged in the soft gamma-ray band (22–64 keV) to about 15 arcsec resolution by Makishima et al. [57] and Pelling et al. [58]. The observed images were consistent with the emission being synchrotron radiation from high energy electrons trapped around a magnetic torus similar to that described above. The radiation region in the 43–64 keV band was significantly smaller than in the 22–43 keV band, consistent with the prediction by Aschenbach & Brinkmann [55].
Fine X-ray images taken with the Chandra X-ray Observatory have brought a renaissance to the structural study of the Crab nebula and other pulsar wind nebulae (see Weisskopf et al. [59] and references given in a review by Arons [60]). The discovery of two concentric torii is one of the many key observations brought forward by Chandra. Ng & Romani [61] used the Chandra image to determine the orientation of the magnetic torii accurately: the position angle of the Crab pulsar spin axis was determined to be degrees and degrees on the inner and outer torii, respectively. The angle relative to the line of sight was determined to be degrees and degrees for the inner and outer torii, respectively.
If high energy electrons are trapped in a macroscopic toroidal magnetic field, we expect the polarisation plane to be parallel to the spin axis. Nakamura & Shibata [62] built a 3D model of the Crab nebula and predicted the polarisation position angle dependence. A 3D relativistic MHD simulation of pulsar wind nebulae was presented by Zanna et al. [63]. Both models are axisymmetric and predict the polarisation plane to be parallel to the spin axis. Zanna et al. [63] predicts the surface brightness distribution be significantly different in the optical and X-ray bands.
The X-ray polarisation position angle measured by Weisskopf et al. [4] is degrees at 2.6 keV and degrees at 5.2 keV, i.e. about 30 degrees from the spin axis determined by Ng & Romani [61]. The polarisation angle is consistent with degrees measured in the optical band of the central region (diameter 30 arcsec) of the Crab nebula (Oort and Walraven [51]). A spatially resolved polarisation measurement of the entire Crab nebula by Woltjer [52] has revealed that the emission is extended to 4 arcmin by 3 arcmin and highly polarised (up to 50%) in the outer part of the nebula. In the central part, the measured degree of polarisation fluctuates highly at 10 arcsec scale, possibly associated with filamentary structures. Woltjer [52] has estimated the error in his position angle measurement to be 6 degrees.
As the emission region shrinks for higher energies, the polarisation position angle is expected to approach that of the spin axis (124–126 degrees). PoGOLite can isolate the Crab nebula from the Crab pulsar by removing gamma rays detected within 1.65 ms and 3.3 ms of the two peaks, P1 and P2 in Fig. 14, respectively. PoGOLite can detect 2.7 % polarisation (3 ) and determine the position angle with a precision of 3-4 degrees for the nebula component between 25–80 keV. Energy dependence of the polarisation position angle will either confirm the magnetic torus around the Crab pulsar or seriously challenge the standard model of high energy emission. Either way, it will make a critical contribution to the modeling of the Crab nebula.
4.2 Emission Mechanism in Isolated Pulsars
Rapidly-rotating neutron stars are a prime target for polarimetric studies. Their emission region is known to be different in different wavelength bands. Historically, phase-resolved polarimetry has had enormous diagnostic capability at radio and optical wavelengths. The expected signature of emission near the poles of a dipole field, an ’S’-shaped swing of the polarisation position angle through the pulse profile (Radhakrishnan & Cooke [64]), has been seen in many radio pulsars. This is generally accepted as proof that the radio emission originates from the open field lines of a magnetic dipole. In the X-ray and gamma-ray regimes, each pulse period reveals two peaks, called P1 and P2. A phase-resolved polarisation measurement of the corresponding soft gamma-ray flux will indicate where in the magnetosphere the emission occurs.
Models for the high-energy emission fall into two general classes. In the polar cap model and its various modifications (Sturner et al. [65] and Daugherty & Harding [66]), particle acceleration occurs near the neutron star surface and the high-energy emission results from curvature radiation and inverse-Compton induced pair cascades in the presence of a strong magnetic field. Outer gap models (Cheng et al. [67], Romani & Yadigaroglu [68] and Romani [69]) assume that acceleration occurs in vacuum gaps that develop in the outer magnetosphere along the last open field line between the null-charge surfaces and the light cylinder, and that high-energy emission results from electron-positron cascades induced by photon-photon pair-production. These mechanisms intrinsically produce highly polarised radiation (up to 70%, depending on the particle spectrum) beamed along the magnetic field lines, with electric vectors parallel or perpendicular to the local field direction.

The Crab pulsar is the primary target for PoGOLite. Fig. 14 shows the theoretical polarisation position angle and polarisation degree as a function of pulse phase for the polar cap, outer gap and slot gap or ‘caustic’ (Dyks & Rudak [70] and Dyks et al. [71]) models. In the caustic model, the Crab pulse profile is a combination of emission from both poles, whereas in both the polar cap and outer gap models, radiation is seen from only one pole or region. The signature of caustic emission is a dip in the polarisation degree and a rapid swing of the position angle at the pulse peak. The expected azimuthal modulation for P1, as defined in Fig. 14, has been calculated for a 6 hour observation and is shown in Fig. 15. In this calculation, we assumed that the nebula component is polarised with a polarisation degree and angle as measured by OSO–8 (Weisskopf et al. [4]).

The PoGOLite instrument will distinguish between these three models at the 5 level using P1 alone. Predictions of the polarisation characteristics at P2 for the three models are rather similar. Measurements of the region between the two peaks will also be important in understanding the pulsar emission mechanism in the gamma-ray band. Even if none of these models turns out to be correct, the PoGOLite data will provide strong constraints upon any future models.
4.3 Accereting Black Holes
Another class of intense galactic X-ray sources where soft gamma-ray polarisation is expected are X-ray binary (XRB) systems, such as Cygnus X–1, where a compact object accretes matter from a companion star (for reviews, see Tanaka & Lewin [72]; Charles [73]). Dramatic spectral differences suggest that the two major states seen in such sources are related to changes in the mass accretion rate, resulting in different structures of the accretion flow (see e.g. Zdziarski [74]). At high accretion rates, accretion takes place through a geometrically thin, optically thick accretion disc, extending into the innermost stable orbit around the black hole (Shakura & Sunyaev [75]). At lower accretion rates, the inner part of the disc is replaced by a geometrically thick, optically thin, hot inner flow, possibly advection-dominated (Esin et al. [76]). Most XRBs exhibit transitions between these two spectral states, commonly referred to as the soft and the hard state, respectively.
In the hard state, the primary X-ray emission arises via repeated Compton upscattering of thermal X-ray photons from the truncated outer disc by hot electrons in the inner flow. The resulting hard X-ray spectrum also shows signatures of a reprocessed component, arising from the primary hard X-ray photons reflecting off the cooler accretion disc. Evidence for this reflection component is provided by a fluorescent Fe-line at 6.4 keV, an Fe absoption edge at 7 keV, and a broad “hump” at 10–200 keV (Lightman & White [77]). While the primary emission is not expected to be significantly polarised as it arises via multiple Compton scatterings, the reflection component is expected to display significant intrinsic polarisation (Matt [78]; Poutanen et al. [79]). The observed degree of polarisation is also dependent on the inclination of the system, giving polarimetry the potential to derive inclinations of XRB systems, which is often difficult by other means.
Some viable, but not widely accepted, models suggest that a part of the high energy emission arises via synchrotron processes in a collimated outflow or jet (Markoff et al. [80]; see also Sect. 4.5). These models predict a much higher degree of polarisation.
In the soft spectral state, hard X-ray emission arises from Compton upscattering of photons by energetic non-thermal electrons distributed in active regions above the accretion disk. As both the geometry and electron distribution differ from that in the hard state, a different polarisation signature is expected. Apart from geometrical constraints, polarisation measurements in the soft state can provide information about such a non-thermal electron distribution. Measuring the polarisation at energies above 10 keV will thus provide independent constraints on the inferred accretion geometry, and constitutes a test for the models inferred from spectral and temporal studies.
A natural candidate for polarisation measurements is the persistent source Cygnus X–1, one of the brightest and best studied XRBs, where the compact object is a stellar-mass black hole. Since the albedo of the reprocessed component contributes 30%, a net polarisation of 10% is expected in the hard state, and a slightly lower degree in the soft state. Simulations show that even a low degree of polarisation (3–5%) is detectable with PoGOLite in either spectral state. In a long-duration flight, PoGOLite will also be able to measure energy dependence of the polarisation (see Axelsson et al. [81], Engdegård [82]).
The degree of polarisation may be even higher in other XRB sources, e.g., Cygnus X–3. Recent results show that it may exhibit a state totally dominated by Compton reflection (Hjalmarsdotter et al. [83]).
The spectral formation process in active galactic nuclei – mainly in Seyfert nuclei – is believed to be similar to that inferred for Galactic XRBs, although the mass of the accreting black hole is at least times higher. While a short PoGOLite flight is unlikely to be sufficiently sensitive to measure soft gamma-ray polarisation in such sources (e.g. for NGC 4151, the emission is much fainter, reaching 10–80 keV fluxes of 10 mCrab), they certainly are excellent candidates for future polarisation studies in the soft gamma-ray band.
4.4 Accreting Neutron Stars
Accretion onto highly magnetized neutron stars, such as Hercules X–1 and 4U0115+63, provides a unique opportunity to study physical processes under extreme conditions. The observed X-ray and gamma-ray radiation originates from accreted material flowing along magnetic field lines onto distinct regions near the polar caps (for a review, see Harding [84]). The localized emission region and neutron star rotation lead to a modulation of the observed flux. The timing of these pulsations can be used to determine the orbital parameters for the neutron star in the binary system. A harmonic absorption feature has been detected first from Hercules X–1 by Trümper et al. [85] and later from several other objects in the hard X-ray spectrum (Coburn et al. [86]). These absorption features are interpreted as cyclotron resonances in magnetic fields of order Gauss.
Due to the strong magnetic field, the radiation from the accretion column is expected to be linearly polarised. As the neutron star rotates, the orientation of the magnetic field with respect to our line of sight changes and so does the direction and strength of the polarisation. By observing these modulations, one can determine the orientation of both the rotation and the magnetic axis of the star. With observations separated in time, one can also search for neutron star precession, which should show up most clearly in polarimetry.
The beaming pattern of the emitted radiation depends strongly on how the accreting matter is decelerated as it hits the neutron star. If a stand-off shock is formed, the radiation will come from a vertically extended accretion column with the strongest emission normal to the magnetic field (fan beam). On the other hand, deceleration by Coulomb collisions will result in a thin hot plasma slab with strongest emission in the vertical direction (pencil beam), which is parallel to the magnetic field (Meszaros et al. [87]). The two geometries will have opposite correlations between flux and polarisation, so with polarisation measurements, it will finally be possible to distinguish between these two alternatives.
In both models above, the polarisation is expected to vary with energy. PoGOLite will not be able to study polarisation variations within a cyclotron feature but it has sufficient energy resolution to detect a strong variation of polarisation across the full spectral band of the instrument (Axelsson et al. [81]).
Hercules X–1 is the highest priority target among the persistently bright sources in this category. In addition to the persistent sources, the galaxy also contains a population of similar transient accreting X-ray pulsars. During outbursts, which may last for weeks or months, some of these sources are among the brightest X-ray sources on the sky. One example is V0332+53, which at the end of 2004 had its fourth outburst since the early 1970s. At maximum, the source flux exceeded 1 Crab and showed 3 strong cyclotron features in its hard X-ray spectrum (see, e.g., Mowlavi et al. [88]). The high flux and strong cyclotron features would make this an extremely interesting target for hard X-ray polarimetry.
4.5 Jets in Active Galaxies and Galactic Binaries
Imaging and variability observations in many wavelength bands indicate that a fraction of all active galactic nuclei are associated with relativistic jets pointing close to our line of sight. Emission is highly variable, and extends over all accessible bands. EGRET has revealed that many active galaxies possessing jets are powerful gamma-ray emitters, and that the observed gamma-ray flux originating in the jet by far dominates that measured in other bands (see, e.g., von Montigny et al. [89]); such jet-dominated active galaxies are commonly known as blazars. Jets are thus common and energetically important ingredients for such classes of active galaxies. However, the formation, acceleration, collimation, and contents of a jet are poorly understood, although the most promising models invoke magneto-hydrodynamic processes as the mechanism for the jet production (see a review by Sikora et al. [90]).
From an observational standpoint, the broad-band emission spectra of blazars generally show two pronounced humps: one in the radio to soft-gamma-ray range, most likely produced by the synchrotron process; and another, peaking in the MeV/GeV band and extending in some objects up to TeV energies, most likely due to inverse-Compton processes via the same electrons that produce the synchrotron emission. The inference that emission from the low-energy hump in blazars is produced by synchrotron radiation is based on the observed high degree of polarisation in the radio through UV bands. However, we know nothing about the level of polarisation in the X-ray/soft gamma-ray band, although the polarisation properties are a powerful tool to discriminate between emission models (see, e.g., Poutanen [91], Sikora et al. [92], Lazzati [93]). In one sub-class of blazars, the so-called High frequency-peaked BL Lac (HBL) objects, the synchrotron hump definitely extends to the soft gamma-ray band, and the level of polarisation as a function of the energy can be a powerful tool to study the details of the distribution of particle energy and the intensity of magnetic field in the jet. PoGOLite is expected to detect high polarisation (10%) in these objects; non-detection of polarisation, on the other hand, would put many current models of blazars into question.
Blazars are variable, with high states (occurring every few years) lasting for months. There are two primary Northern targets for PoGOLite balloon flights, Mkn 501 (see Kataoka et al. [94]), and 1E1959+65 (see Giebels et al. [95]). The brighter one will be selected, depending on the current flare state. In the Southern hemisphere, the most promising target is PKS 2155–304 (see, e.g., Kataoka et al. [96]).
The Galactic analogues to quasars, X-ray binary systems, also sometimes show powerful jets, and are then referred to as microquasars, as reviewed by Fender et al. [97]. The jets in microquasars are studied in the radio band, as the emission region is too compact to be resolved in X-rays. A detection of a high degree of polarisation in the soft gamma-ray band would support the jet origin of gamma-rays, a model that is viable but not at all widely accepted (see Fender et al. [97]). Since the radiation is from high-energy electrons trapped in jets, a measurement of the plane of polarisation will reveal the direction of the magnetic field. The prime microquasar target is GRS 1915+105, which is the most spectacular of such sources, often reaching soft gamma-ray fluxes twice that of the Crab system (for a recent overview, see Zdziarski [98]).
| Target | Coincidence rate | Min. Det. Pol. |
|---|---|---|
| Crab (total) | 15.2/s | 2.4% |
| Cyg X-1 (Hard state) | 14.9/s | 2.4% |
| Cyg X-1 (Soft state) | 5.3/s | 4.6% |
| Hercules X-1 | 2.7/s | 8% |
| Mkn 501 (Flare) | 0.82/s | 17% |
| V0332+53 (burst) | s | 5.3% |
| 4U0115+63 (burst) | s | 5.3% |
| GRS 1915 (burst) | s | 5.3% |
5 Summary and Conclusions
PoGOLite is a balloon-borne soft gamma-ray polarimeter designed to enhance the signal-to-noise ratio and secure a large effective area for polarisation measurement (228 cm2 at 40 keV) by limiting the field of view of individual pixels to 1.25 msr (FWHM) based on well-type phoswich detector technology. Thick neutron and gamma-ray shields have been added to reduce background to a level equivalent to 100 mCrab between 25–50 keV. Through extensive detector characterisation at polarised synchrotron beams and tests with neutrons, radioactive sources and accelerator protons, we have confirmed the predicted instrument to perform in accordance with Geant4-based simulation programs. PoGOLite can detect a 10% polarisation from a 200 mCrab object in a 6 hour balloon flight and will open a new observational window in high energy astrophysics.
6 Acknowledgments
We wish to thank Jonathan Arons, Makoto Asai, Roger Blandford, Blas Cabrera, Pisin Chen, Persis Drell, Steven Kahn, Tatsumi Koi, Kazuo Makishima, Takashi Ohsugi, Masashi Takata, and Marek Sikora for their continuing support and encouragement. We are grateful to Alice Harding for providing pulsar model predictions in numerical form. We acknowledge Charles Hurlbut and Eljen Technology for developing the slow scintillator tube, Hamamatsu Photonics for improving the performance of R7899EGKNP, and the Nikolaev Institute of Inorganic Chemistry for supplying BGO crystals of excellent quality. T.K. has benefitted greatly from discussions with Jonathan Arons on emission mechanisms in pulsar wind nebulae. During the early developmental phase, the PoGOLite Collaboration benefitted from discussions with John Mitchell, Robert Streitmatter and Daniel Marlow.
We gratefully acknowledge support from the Knut and Alice Wallenberg Foundation, the Swedish National Space Board, the Swedish Research Council, the Göran Gustafsson Foundation, the U.S. Department of Energy contract to SLAC no. DE–AC3–76SF00515, the Kavli Institute for Particle Astrophysics and Cosmology (KIPAC) at Stanford University through an Enterprise Fund, and the Ministry of Education, Science, Sports and Culture (Japan) Grant-in-Aid in Science No. 18340052. J.K. and N.K. acknowledge support by JSPS Kakenhi No. 16340055. J.K. was also supported by a grant for the international mission research provided by the Institute for Space and Astronautical Science (ISAS/JAXA). T.M. acknowledges support by Grants-in-Aid for Young Scientists (B) from JSPS (No. 18740154).
References
- [1] Fabian, A. C., Pounds, K. A., and Blandford, R. D., 2004,“Frontiers of X-ray Astronomy” (Cambridge University Press)
- [2] Siddons, D. P. (ed) 1991 SPIE Proc., 1548 ”Production and Analysis of Polarized X Rays”
- [3] Lei, F. et al., 1997, Space Sci. Rev., 82, 309
- [4] Weisskopf, M. C. et al., 1976, ApJ, 208, L125
- [5] Weisskopf, M. C. et al., 1978, ApJ, 220, L117
- [6] Silver, E. H., et al., 1978, ApJ, 225, 221
- [7] Long, K. S. et al., 1980, ApJ, 238, 710
- [8] Coburn, W. & Boggs, S., 2003, Nature, 423, 415
- [9] Rutledge, R. E. & Fox, D. B., 2004, MNRAS, 350, 1272
- [10] Wigger, C., et al., 2004, ApJ, 613, 1088
- [11] Willis, D. R., et al., 2005, A&A, 439, 245
- [12] Turner, M. J. L. & Hasinger, G. (eds.), 2006, SPIE Proc., 6266
- [13] Produit, N., et al., 2005, Nucl. Instr. Meth. A, 550, 616
- [14] Legere, J., et al., 2005, SPIE Proc., 5898, 413
- [15] Gunji, S., et al., 2003, Proc. International Cosmic Ray Conference, 2779
- [16] Silva, R., et al., 2003, SPIE Proc., 4843, 543
- [17]
Andersson, V. et al., 2004, Proc. 22nd Texas
Symp. at Stanford Univ. posted at
http://www.slac.stanford.edu/econf/C041213/proc/
- [18] Gunderson, K., et al., 2004, SPIE, 5165, 159
- [19] Pascale, E., et al., 2008, arXiv:0711.3465v2
- [20] Kamae, T., et al., 1992, SPIE Proc., Vol. 1734, 2
- [21] Kamae, T., et al., 1993, IEEE Trans. Nucl. Sci., 40, 204
- [22] Takahashi, T. et al., 1992, SPIE Proc., 1734, 44
- [23] Takahashi, T. et al., 1993, IEEE Tran. Nucl. Sci., 40,890
- [24] Gunji, S., et al., 1992, ApJ, 397, L83
- [25] Gunji, S., et al., 1994, ApJ, 428, 284
- [26] Miyazaki, S., et al., 1996, PASJ, 48, 801
- [27] Yamasaki, N., et al., 1997, ApJ, 481, 821
- [28] Kamae, T. et al., 1996 SPIE Proc., 2806, 314
- [29] Makishima, K., et al. 2001, in H. Inoue and H. Kunieda (eds) ASP Conf. Proc. 251, p564
- [30] Kokubun, M., et al., 2004, IEEE Tran. Nucl. Sci., 51, 1991
- [31] Takahashi, T., et al. 2007, PASJ, 59, 35
- [32] Kokubun, M. et al., 2007, PASJ, 59, 53
- [33] Marini Bettolo, C. et al., 2007, Proc. International Cosmic Ray Conference, Merida, Mexico, 2007.
- [34] Brun, R. et al., 1987, CERN Data handling Division Report DD/EE/84-1
- [35] Amako, K., et al., 1994, Proc. of CHEP94, LBL-35822 CONF-94049
- [36] Mizuno, T., et al., 2004, ApJ, 614, 1113
- [37] Verbinski, V. V., et al, 1968, Nucl. Instr. Meth. 65, 8.
- [38] Uwamino, Y., et al., 1982, Nucl. Instr. Meth., 204, 179
- [39] Koi, T., et al., 2007, Proc. of Hadronic Shower Simulations Workshop (Sept. 2006 Batavia, USA) published as AIP Conf. Proc. 89, 216
- [40] Kazejev, J., 2007, Master’s thesis, Royal Inst. of Technology (KTH)
- [41] Armstrong, T. W., Chandler, K. C., & Barish, J. 1973, J. Geophys. Res., 78, 2715
- [42] Armstrong, T. W. et al., 1997, 1997 Conf. on High Energy Radiation Background in Space (Snowmass, USA) available from IEEE Xplore
- [43] Cugnon, J., Volant, C., & Vuillier, S., 1997, Nucl. Phys. A, 625, 729
- [44] Larsson, S. et al., 2007, Proc. 18th ESA Symposium on European Rocket and Balloon Programmes and Related Research, Visby, Sweden (3–7 June, 2007) ESA SP-647
- [45] Mizuno, T., et al., 2005, Nucl. Instr. Meth. A, 540, 158
- [46] Kataoka, J., et al., 2005, SPIE Proc., 5898, 133
- [47] Kanai, Y., et al., 2007, Nucl. Instr. Meth. A, 570, 61
- [48] Takahashi, H., et al. 2008 in preparation.
- [49] Kiss, M., et al., 2008 in preparation
- [50] Vashakidze, I. S., 1954, Doklady Ak. Nauk USSR, 94, 1021 cited in Oort & Walraven (1956)
- [51] Oort, J. H., & Walraven, T., 1956, Bull. Astron. Inst. Netherlands, 12, 285
- [52] Woltjer, L., 1957, Bull. Astron. Inst. Netherlands, 13, 301
- [53] Shklovsky, I. 1953, Dokl. Akad. Nauk USSR, 90, 983
- [54] Oda, M., et al., 1967, ApJ, 148, L5
- [55] Aschenbach, B., & Brinkmann, W. 1975, A&A, 41, 147
- [56] Rees, M. J., & Gunn, J. E., 1974, MNRAS, 167, 1
- [57] Makishima, K., et al. 1981, Space Science Review, 30, 259
- [58] Pelling, R. M., et al., 1987, ApJ, 319, 416
- [59] Weisskopf, M. C. et al., 2000, ApJ, 536, L81
- [60] Arons, J. 2004, Advances in Space Research, 33, 466
- [61] Ng, C.-Y., & Romani, R. W., 2004, ApJ, 601, 479
- [62] Nakamura, Y. & Shibata, S., 2007, MNRAS, in press and astro-ph/0702512
- [63] Zanna, Del L., et al., 2007, A&A, in press and astro-ph/0603080
- [64] Radhakrishnan, V. & Cooke, D. J., 1969, Astrophys. Lett., 3, 225
- [65] Sturner, S., Dermer, C., and Michel, C., 1995, ApJ, 445, 736
- [66] Daugherty, J. & Harding, A., 1996, ApJ, 458, 278
- [67] Cheng, K. S., Ho, C., and Ruderman, M. A., 1986, ApJ, 300, 500
- [68] Romani, R. & Yadigaroglu, I., 1995, ApJ, 438, 314
- [69] Romani, R., 1996, ApJ, 470, 469
- [70] Dyks, J. & Rudak, B., 2003, ApJ, 598, 1201.
- [71] Dyks, J., Harding, A. K. and Rudak, B., 2004, ApJ, 606, 1125
- [72] Tanaka, Y. & Lewin, W., 1995, in W. Lewin et al. (eds.) “X-ray Binaries”, (Cambridge Univ. Press) p.126
- [73] Charles, P., 1998, in Theory of Black Hole Accretion Disks, eds. M. Abramowicz et al. (Cambridge University Press) p.1
- [74] Zdziarski, A. A. & Gierlinski, M., 2004, Prog. Theor. Phys. Suppl., 155, 99
- [75] Shakura, N. I., & Sunyaev, R. A. 1973, A&A, 24, 337
- [76] Esin, A. A., McClintock, J. E., & Narayan, R. 1997, ApJ, 489, 865
- [77] Lightman, A. P., & White, T. R. 1988, ApJ, 335, 57
- [78] Matt, G. 1993, MNRAS, 260, 663
- [79] Poutanen, J., Nagendra, K., and Svensson, R. 1996, MNRAS, 283, 892
- [80] Markoff, S., Nowak, M., & Wilms, J. 2005, ApJ, 635, 1203
- [81] Axelsson, M., et al., 2007, Astroparticle Physics, 28, 327 (arXiv:0704.1603)
- [82] Engdegård, O., 2006, Master’s thesis, Royal Inst. of Technology (KTH)
- [83] Hjalmarsdotter, L., et al., 2007, submitted to MNRAS(arXiv:0707.2032)
- [84] Harding, A., 1994, in S. S. Holt and C. S. Day (eds.), Proc. of Maryland Conf. on Evolution of X-Ray Binaries (AIP: New York) p.429
- [85] Trümper, J. et al., 1978, ApJ, 219, L105
- [86] Coburn, W. et al., 2002, ApJ, 580, 394
- [87] Meszaros, P., et al., 1988, ApJ, 324, 1056
- [88] Mowlavi, N., et al., 2006, A&A, 451, 187
- [89] von Montigny, C., et al., 1995, ApJ, 440, 525
- [90] Sikora, M., et al., 2005, ApJ, 625, 72
- [91] Poutanen, J. 1994, ApJS, 92, 607
- [92] Sikora, M., Begelman, M., and Rees, M., 1994, ApJ, 421, 153
- [93] Lazzati, D. 2005, in T. Bulik, B. Rudak, and G. Madejski (eds.) “Astrophysical Sources of High Energy Particles and Radiation” (AIP: New York) p. 179.
- [94] Kataoka, J., et al., 1999, ApJ, 514, 138
- [95] Giebels, B., et al., 2002, ApJ, 571, 763
- [96] Kataoka, J., et al., 2000, ApJ, 528, 243
- [97] Fender, R., Belloni. T., and Gallo, E., 2004, MNRAS, 355, 1105
- [98] Zdziarski, A. A., 2005, MNRAS, 360, 825