Phonons in Superconducting CaC6 Studied via Inelastic X-ray Scattering
Abstract
We investigate the dispersion and temperature dependence of a number of phonons in the recently discovered superconductor CaC utilizing inelastic x-ray scattering. Four [00L] and two ab-plane phonon modes are observed, and measured at temperatures both above and below T. In general, our measurements of phonon dispersions are in good agreement with existing theoretical calculations of the phonon dispersion. This is significant in light of several discrepancies between experimental measurements of phonon-derived quantities and theoretical calculations. The present work suggests that the origin of these discrepancies lies in the understanding of the electron-phonon coupling in this material, rather than in the phonons themselves.
pacs
74.25.Kc,74.70.-b,78.70.CkCaC6 has attracted a great deal of interest since the recent discovery of its superconductivity below 11.4 K Weller et al. 2005; Emery et al. 2005. The transition temperature is unprecedented in graphite intercalation compounds, where transition temperatures are, with one exception, an order of magnitude lower. (The second highest known transition temperature, of YbC6, is still nearly 50% lower, 6.5 K.) Despite an intriguing initial suggestion of a novel pairing mechanism Csányi et al. 2005 much of the early experimental experimental evidence indicates that CaC6 is a conventional weakly-coupled superconductor Kim et al. 2006a; Lamura et al. 2006. Still, the unusually high transition temperature has prompted a great deal of speculation as to which phonons play a part in pairing and why the transition temperature is so high Calandra and Mauri 2005; Lamura et al. 2006; Kim et al. 2006b; Kim et al. 2006a; Mazin 2005; Boeri et al. 2007.
Calandra and Mauri Calandra and Mauri 2005 and Kim et al. Kim et al. 2006a have calculated the phonon spectra and the electron-phonon coupling, using density functional theory (DFT). Both predict electron-phonon coupling with the Cac (out-of-plane) and Cab (in-plane) modes. While these two calculations of the phonon dispersions are similar, their predictions of the coupling differ, with Calandra and Mauri assigning additional coupling to the Cab modes.
There are a number of discrepancies between the theoretically calculated phonon spectra and electron-phonon coupling and a variety of phonon-derived experimental quantities for this system - as outlined in a recent paper by Mazin et al. Mazin et al. 2006. For example, recent measurements of the isotope effect, (where is the superconducting transition temperature and is the mass of atom ) have found Hinks et al. 2007, in disagreement with the calculated value of Calandra and Mauri 2005. This suggests that the coupling to soft Ca modes is greater than predicted by calculation. Furthermore, the measured temperature dependence of the specific heat does not show the large coupling effects derived from the calculated electron-phonon spectral function, Kim et al. 2006a; Mazin et al. 2006. (Also called the Eliashberg function, is a measure of the electron-phonon coupling. is the phonon density of states Carbotte 1990.) Thus, in contrast to the isotope effect measurements discussed above, specific heat experiments suggest that the coupling to acoustic Ca modes is significantly weaker than is predicted by theory.
Additionally, the upper critical field of CaC6 has been shown to have a linear temperature dependence down to 1 K while calculations of the upper critical field, based on LDA calculations of , have predicted non-linear behavior below 4 K Jobiliong et al. 2007; Kim et al. 2006b; Mazin et al. 2006. Finally, DFT calculations of the phonon spectra understate the increase of Tc under pressure by an order of magnitude Calandra and Mauri 2006; Kim et al. 2006a; Gauzzi et al. 2007.
The measurements of the isotope effect and the specific heat appear to lead to contradictory conclusions, since the isotope measurement implies larger-than-calculated coupling to soft Ca modes while the specific heat measurements suggests less-than-calculated coupling to soft Ca modes. This apparent conflict rests on a comparison of experimental results to theoretical predictions which yield Calandra and Mauri 2005; Kim et al. 2006a. However, a recent measurement suggests that the superconducting gap is 2.3 meV, 40% larger than previously measured Kurter et al. 2007. Such a large gap suggests that CaC6 is a strongly coupled superconductor.
It is clear that the theoretical understanding of CaC6 is by no means complete, and in particular a number of experimental observations of quantities that are either directly or indirectly related to the phonon spectra are inconsistent with the present theoretical description. Given this situation it is clearly of great interest to measure the phonon spectra and compare it to the existing theoretical predictions Calandra and Mauri 2005; Kim et al. 2006a.
In this paper we report measurements of the phonon dispersions in CaC6, utilizing inelastic x-ray scattering (IXS) to do so. In particular, we have measured the dispersion, and temperature dependence of the dispersion, for a number of the low energy modes, including soft Caab modes and part of the Cab mode, that are believed to be important in the superconductivity of the CaC6 Calandra and Mauri 2005; Kim et al. 2006b. In general, we find good agreement with the extant predictions for the phonon dispersion curves. These results apparently confirm the validity of the DFT approach used in such calculations and suggest that the origin of the various discrepancies with experiment discussed above lie in the understanding of the electron-phonon coupling not of the phonon modes themselves.
The samples were prepared via immersion of a Highly Orientated Pyrolytic Graphite (HOPG) platelet in a lithium/calcium alloy for 10 days, as described in detail by Pruvost et al. Pruvost et al. 2004. The HOPG was ZYA grade purchased from GE Advanced Ceramics with an initial (non-intercalated) highly-aligned c-axis mosaic of . It is powder-like in the ab-plane. The lithium and calcium were purchased from Sigma-Aldrich at 99.99% purity. X-ray diffraction of the resulting shiny silver CaC6 platelet is shown in Fig. 1c. Diffraction showed very high sample purity with the intensity of the (002) Bragg peaks of the LiC6 phase and the graphite phase having less than 0.25% the intensity of the CaC6 (006) Bragg peak.
The sample dimensions were with a post-intercalation c-axis mosaic of . The crystal structure and Brillouin zone of CaC6 (space group , a=5.17 Å, ) are shown in Figs. 1a and b Emery et al. 2005.
After synthesis, the samples were mounted in a beryllium dome in an argon or helium atmosphere. The region around the beryllium dome was subsequently pumped out to rough vacuum. The diffraction pattern of the sample was checked before, after and several times during the experiment. Both the out-of-plane diffraction patterns and the rocking curves of the (003) and (006) reflections were monitored during the experiments and did not show any signs of degradation Dif. A post-experiment diffraction pattern is shown in Fig. 1c.


The IXS experiments were performed at sector 3 at the Advanced Photon Source of Argonne National Laboratory Sinn 2001a; Sinn 2001b. Data were collected using Si(18 6 3) analyzer reflections. The instrument had an overall resolution of 2.3 to 2.5 meV. Photon flux was photons/second. Four analyzer crystals and four independent detectors allowed data collection at four momentum transfers simultaneously. The momentum resolution was 0.072 in the scattering plane and 0.18 perpendicular to it. The beam size at the sample was . The spectra were normalized by a beam intensity monitor immediately before the sample. Spectra with in the [00L] direction were measured in reflection geometry while spectra with in the ab-plane were measured in transmission geometry. Finally, we note that identical results were obtained from two samples, prepared at different times and measured in separate runs.


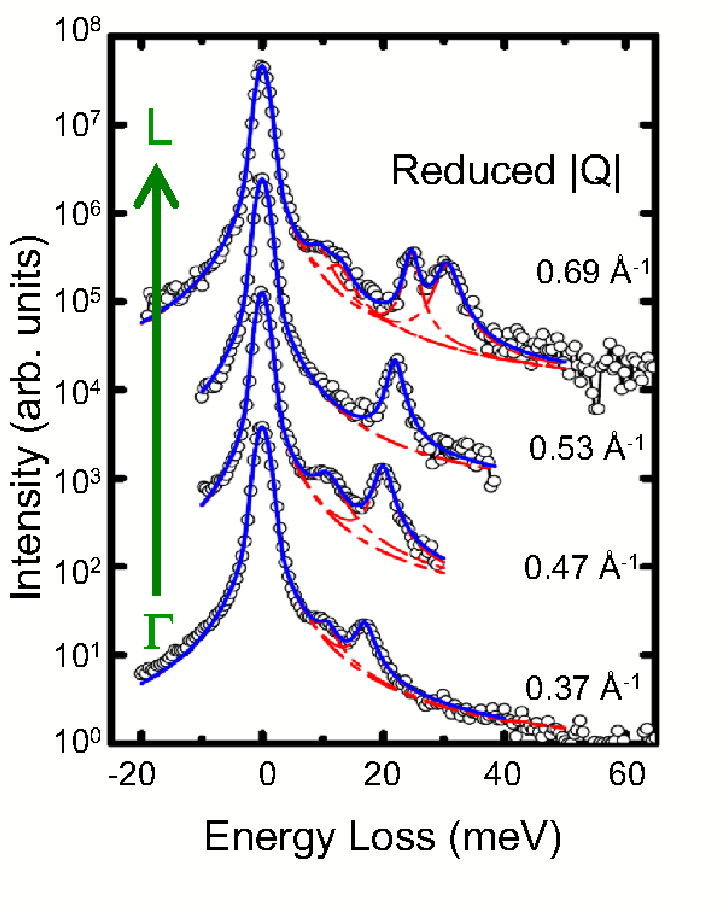
A series of spectra taken at 5K with in the [00L] direction and in the fourth Brillouin zone, with between and where is one reciprocal lattice vector, are shown in Fig. 2. Typical phonon intensities are count/second. Example fits are shown in the figure. The elastic line is fit with a psuedo-voigt while the phonon peaks are fit with Lorentzians. Near the L point zone boundary, the feature at 10 meV is seen to broaden and a better fit is obtained if the data are fit to two modes.
A summary plot showing the resulting peak positions is shown in Fig. 3. Note that not all of the phonon observations reported in Fig. 3 are visible in Fig. 2 because the cross-section of different phonons varies with momentum transfer. Specifically, the phonon intensity is proportional to , where is the atomic displacement, is the momentum transfer and is the energy of the phonon mode. Some phonons shown in Fig. 3 are visible only in higher Brillouin zones or at longer counting times. The data in Fig. 3a are shown in a reduced zone scheme with spectra from different Brillouin zones folded back into the first Brillouin zone.
We discuss first the dispersion (Fig. 3a). Four phonon bands are observed in this direction. The lowest energy band, labelled A, is almost dispersionless over the measured region and has an energy near 10 meV. The second band, labelled B, disperses from 0 meV to 25 meV. A small portion of a third band, labelled C, can be seen near L near 10 meV. The final observed band, labelled D, disperses between 25 meV and 40 meV.
It is difficult to assign an exact cross-section to a particular mode because the data were collected in different geometries. The elastic intensity is a reasonable, but imperfect, measure of the amount of material in the scattering volume, and additional factors complicate the comparison of data taken in the reflection ([00L]) and transmission (ab-plane) geometries. However, we can report the relative cross-sections of various modes at a particular momentum transfer in the [00L] direction. At =2.08 , which corresponds to a reduced =0.69, modes C and D have roughly equal intensities of 0.5 counts/second while mode A has an intensity of roughly 0.1 counts/second at 5K. These count rates represent the raw data and are not scaled by the IXS polarization factor, .
Also shown in Fig. 3a are calculations of the phonon bands Calandra and Mauri 2005. The two calculations agree to within a few meV in the measured energy range with the exception of the dispersion of the lowest energy optical band in the ab-plane Calandra and Mauri 2005; Kim et al. 2006a. The calculation of Calandra and Mauri Calandra and Mauri 2005 agrees with the data somewhat better than the calculation of Kim et al. Kim et al. 2006a, so it is shown here. Moreover, Calandra and Mauri identify the phonon mode associated with each calculated band Calandra and Mauri 2005. By comparison of our experimental data with this calculation, we identify mode A as a primarily Caab oscillation with some Cc character, mode B as a mixed Cac and Cc mode, and mode D as a mixed Cac and Cc mode Calandra and Mauri 2005.
In general, the agreement between theory and experiment is good, though we note that the calculations of modes A and D understate the energy of the measured band throughout the dispersion. In addition, there are predicted modes which are largely or entirely absent in our data: modes C and E. This apparent absence does not necessarily mean that the mode does not occur. In particular, mode C is predicted to have primarily Caab character, which, because of the phonon polarization factor in the IXS cross-section, means it should not be observed. This mode also has a small amount of Cc character, in addition to the majority Caab component. A small Cc amplitude may be why these measurements observe the C mode in only a small portion of reciprocal space. In fact, mode A is also predicted to have primarily Caab character and a small amount of Cc character, consistent with this. Near =1.24 the measured intensity of this mode is 45 times larger in the ab-plane than it is in the [00L] direction (after scaling by the elastic intensity). Thus, the polarization factor also explains the asymmetry in the intensity of this mode.
Despite measuring a wide range around 50 meV we are not able to observe 50 meV Cc phonons modes. Spectra were counted for between 80 and 120 seconds per 0.25 meV step. We believe that a 10 count peak would have been observable, which places an upper bound on any such mode of 0.1 counts/second at 300K, less than 10% of the dispersing phonon band at similar momentum transfers. A related Cc phonon mode was also not observed in an IXS measurement on graphite Mohr et al. 2007. We speculate that the amplitude of these modes is very small or the lifetime is very short (resulting in a broad peak). Either of these effects, when combined with the high predicted energy of mode E, would result in a very small IXS intensity.
Next we turn to the ab-plane phonons (Fig. 3b). The interpretation of the ab-plane phonons is somewhat complicated because the data are not taken at a point in reciprocal space. Rather, because the sample is not oriented in-plane, each spectra is taken at fixed , which represents an average over a circle in the ab-plane in reciprocal space of radius , centered at . Therefore, phonons which have a significant anisotropic dispersion in the ab-plane are not visible in these experiments because this anisotropy will translate into an energy broadening of the measured mode and consequently a reduction in the peak intensity. Of course, if the ab-plane dispersion is isotropic (identical in all ab-plane directions) the average is irrelevant and the mode may be observed. Finally, all the data must be taken in the first Brillouin zone because the powder structure of the ab-plane and the unequal distances of different ab-plane directions in the Brillouin zone mean that phonon positions cannot be folded back to the first Brillouin zone. Despite these difficulties two phonon bands are observed. The flat band near 10 meV and a highly dispersive band which we measure between 15 meV and 50 meV. At =0.58and 5K, the two measured ab-plane phonon modes have roughly equal intensities of 0.1 counts/ second.
Comparison with Calandra and Mauri (Fig. 3) identifies the low energy band as a principally Caab mode and the dispersing band as a Cab mode Calandra and Mauri 2005. This latter mode, which is the ab-plane extension of mode C measured in the [00L] direction, discussed above, disperses to higher energy than predicted Kim et al. 2006a. A second highly dispersing Cab mode is predicted by Calandra and Mauri, but is not observed Calandra and Mauri 2005. This may be because the band is not isotropic. In fact, the principal difference (below 60 meV) of the calculations of Calandra and Mauri and Kim et al. is that Calandra and Mauri predict two isotropic Cab bands dispersing from at 15 meV while Kim et al. predicts that only one of them is isotropic.
Calandra and Mauri Calandra and Mauri 2005 and Kim et al. Kim et al. 2006a both predict a flat, isotropic band near 38 meV. This mode is not observed in experiments, which cannot be due to the ab-plane averaging effects discussed above. Thus, its absence in the experimental data is explained by its assignment as a mixed Cac and Cc mode: the IXS polarization factor would suppress any such mode in this geometry.
Finally, the phonon dispersion is measured at three temperatures 5 K, which is below the 11.4 K transition temperature; 50 K and 300 K. No differences in the phonon spectra at different temperatures are observed, within the limits of our measurements. Additionally, there are no significant changes in the widths. Also, the intensity of the peaks appears to follow the temperature dependence predicted by Bose statistics, as expected.
In summary, we find good agreement between experiment and theory, although calculation underestimates the energy of two modes in the [00L] direction. This agreement has a number of implications for the general understanding of the system. One immediate consequence is that the predicted , the phonon density of states, appears to be largely correct Calandra and Mauri 2005; Kim et al. 2006a.
Nevertheless, as discussed in the introduction, serious disagreements exist between experiment and the theoretical understanding of the system. The slight disparity between the calculated and measured is probably not sufficient to reconcile these results. The disagreements are largely a result of predictions made using the calculated Calandra and Mauri 2005; Kim et al. 2006a. Thus, by confirming our understanding of the phonon dispersion, and hence the calculated , the present work raises serious questions about the calculation of the electron-phonon coupling. We hope that this work inspires theoretical studies to reconcile the existing discrepancies with experimental data.
We acknowledge helpful discussions with T. Berlijn. Work performed at BNL was supported by US DOE, Division of Materials Science and Engineering, under contract No. DE-AC02-98CH10886 and partially by DOE-CMSN. Use of the Advanced Photon Source was supported by the US DOE, Office of Science, Basic Energy Sciences, under Contract No. DE-AC0Z-06CH11357. Work performed at UCL was supported by the UK Engineering and Physical Science Research Council and by a Wolfson Royal Society Research Merit Award.
References
- Weller et al. (2005) T. E. Weller, M. Ellerby, S. S. Saxena, R. P. Smith, and N. T. Skipper, Nature Physics 1, 39 (2005).
- Emery et al. (2005) N. Emery, C. Hérold, M. d’Astuto, V. Garcia, C. Bellin, J. F. Marêché, P. Lagrange, and G. Loupias, Phys. Rev. Lett. 95, 087003 (2005).
- Csányi et al. (2005) G. Csányi, P. B. Littlewood, A. H. Nevidomskyy, C. J. Pickard, and B. D. Simons, Nature Physics 1, 42 (2005).
- Kim et al. (2006a) J. S. Kim, L. Boeri, R. K. Kremer, and F. S. Razavi, Phys. Rev. B 74, 214513 (2006a).
- Lamura et al. (2006) G. Lamura, M. Aurino, G. Cifariello, E. Di Gennaro, A. Andreone, N. Emery, C. Hérold, J.-F. Marêché, and P. Lagrange, Phys. Rev. Lett. 96, 107008 (2006).
- Calandra and Mauri (2005) M. Calandra and F. Mauri, Phys. Rev. Lett. 95, 237002 (2005).
- Kim et al. (2006b) J. S. Kim, R. K. Kremer, L. Boeri, and F. S. Razavi, Phys. Rev. Lett. 96, 217002 (2006b).
- Mazin (2005) I. I. Mazin, Phys. Rev. Lett. 95, 227001 (2005).
- Boeri et al. (2007) L. Boeri, G. B. Bachelet, M. Giantomassi, and O. K. Anderson, Phys. Rev. B 76, 064510 (2007).
- Mazin et al. (2006) I. I. Mazin, L. Boeri, O. V. Dolgov, A. A. Golubov, G. B. Bachelet, M. Giantomassi, and O. K. Andersen (2006), eprint cond-mat/0606404.
- Hinks et al. (2007) D. G. Hinks, D. Rosenmann, H. Claus, M. S. Bailey, and J. D. Jorgensen, Phys. Rev. B 75, 014509 (2007).
- Carbotte (1990) J. P. Carbotte, Reviews of Modern Physics 62, 1027 (1990).
- Jobiliong et al. (2007) E. Jobiliong, H. D. Zhou, J. A. Janik, Y.-J. Jo, L. Balicas, J. S. Brooks, and C. R. Wiebe, Phys. Rev. B 76, 052511 (2007).
- Calandra and Mauri (2006) M. Calandra and F. Mauri, Phys. Rev. B 74, 094507 (2006).
- Gauzzi et al. (2007) A. Gauzzi, S. Takashima, N. Takeeshita, C. Terakura, H. Takagi, N. Emery, C. Hérold, P. Lagrange, and G. Loupias, Phys. Rev. Lett. 98, 067002 (2007).
- Kurter et al. (2007) C. Kurter, L. Ozyuzer, D. Mazur, J. F. Zasadzinski, D. Rosenmann, H. Claus, D. G. Hinks, and K. E. Gray (2007), eprint cond-mat/0612581v2.
- Pruvost et al. (2004) S. Pruvost, C. Hérold, A. Hérold, and P. Lagrange, Carbon 42, 1825 (2004).
- (18) One of the first diffraction signs of degredation in air exposure is the increase in width of the (006) rocking curve relative to the (003) rocking curve.
- (19) This figure was generated using a software program from Accelrys.
- Sinn (2001a) H. Sinn, NIMA 467-468, 1545 (2001a).
- Sinn (2001b) H. Sinn, J. Phys.: Condens. Matter 13, 7525 (2001b).
- Mohr et al. (2007) M. Mohr, J. Maultzsch, E. Dobardžić, S. Reich, I. Milošević, M. Damnjanović, A. Bosak, M. Krisch, and C. Thomsen, Phys. Rev. B 76, 035439 (2007).