Microwave surface resistance of pristine and neutron-irradiated MgB2 samples in magnetic field
Abstract
We report on the microwave surface resistance of two polycrystalline samples; one consists of pristine material, the other has been irradiated at very high neutron fluence. It has already been reported that in the strongly irradiated sample the two gaps merge into a single value. The mw surface resistance has been measured in the linear regime as a function of the temperature and the DC magnetic field, at increasing and decreasing fields. The results obtained in the strongly irradiated sample are quite well justified in the framework of a generalized Coffey and Clem model, in which we take into account the field distribution inside the sample due to the critical state. The results obtained in the pristine sample show several anomalies, especially at low temperatures, which cannot be justified in the framework of standard models for the fluxon dynamics. Only at temperatures near and for magnetic fields greater than the experimental data can quantitatively be accounted for by the Coffey and Clem model, provided that the upper-critical-field anisotropy is taken into due account.
pacs
74.25.HaMagnetic properties and 74.25.NfResponse to electromagnetic fields (nuclear magnetic resonance, surface impedance, etc.) and 74.25.OpMixed states, critical fields, and surface sheaths1 Introduction
It has widely been shown that the superconducting properties of MgB2 are strongly related to the two-gap structure of its electronic states sologu; Jin-lambda; bouquet-H; gurevich; golubovHc2; golubov. The smaller superconducting gap, , arises from the quite isotropic bands and the larger one, , from the strongly anisotropic bands liu. Due to the different parity of the and bands, inter-band scattering of quasiparticles is much smaller than the intra-band one, making the two superconducting gaps quite different though they close at the same Mazin.
According to the theory of multi-band superconductivity liu, the inclusion of defects would increase the inter-band scattering and, consequently, change the relative magnitude of the different gaps. In order to carry out investigation on this topic, essentially two methods have been used to insert defects and/or disorder in MgB2: chemical substitution and damage by irradiation sostituzioni; wilke; gandikota; ghigo; tarantini1. In any cases, the inclusion of defects, besides to change the inter-band scattering, might increase the upper critical field and the critical current, strongly affecting the fluxon dynamics. Very recently, the effects of neutron irradiation have extensively been investigated on polycrystalline tarantini1; pallecchi; gonnelli2; putti2; puttiSUST2008. It has been shown that irradiation leads to an improvement in both critical field and critical current density for an exposure level in the range . On further increasing the neutron fluence, all the superconducting properties, such as , , , are strongly suppressed. Furthermore, measurements of specific heat, as well as point-contact spectroscopy, have shown that in the sample irradiated at the highest fluence () the two gaps merge into a single value gonnelli2; putti2.
Despite the large amount of experimental and theoretical work done on MgB2, some arguments are still under discussion, such as the effects of the magnetic field on the superconducting properties Magnetiz; Jia; Yang. The main difficulty to quantitatively discuss the mixed-state properties of MgB2 arises from the unusual flux-line properties due to the different coherence lengths, and , associated with and koshelev. Scanning tunnelling spectroscopy on MgB2 single crystals along the c-axis, which probes mainly the band, has highlighted a core size much larger than the estimates based on the measured values, as well as a significant core overlap at fields much lower than the macroscopic eskil. Furthermore, measurements of neutron scattering from the vortex lattice have highlighted a spatial rotation of the vortex lattice for applied magnetic fields in the range T cubit. According to point-contact-spectroscopy experiments samuely; gonnelli1; diffusivita, these unusual properties have been ascribed to the strong suppression of the superconductivity in the band, occurring in that field range. At low fields, each vortex has a composite structure, with -band quasiparticles localized in a region of radius and -band quasiparticles in a wider region of radius . In the field range T (at low ), the giant cores start to overlap; when the magnetic field is large enough to suppress the -band gap, the vortex cores shrink and the -band quasiparticles are widespread in the whole sample Jia; eskil. This field-induced evolution of the vortex lattice is expected to affect the vortex-vortex and vortex-pinning interactions, making the description of the properties involving the presence and motion of fluxons very difficult.
The investigation of the microwave (mw) surface imped-ance, , in superconductors is a useful tool for determining several properties of the superconducting state. In the absence of static magnetic fields, the variation with the temperature of the condensed-fluid density determines the temperature dependence of . On the other hand, the field dependence of in superconductors in the mixed state is determined by the presence of fluxons, which bring along normal fluid in their cores, as well as the fluxon motion golo; TALVA; noiBKBO; CC; brandt; dulcicvecchio. So, investigation of the magnetic-field-induced variations of the surface resistance provides important information on the fluxon dynamics.
Several studies of the mw response of MgB2 reported in the literature have shown that the experimental results cannot be accounted for in the framework of standard theories Lee; emiliano; shibata; dulcic; nova; isteresiMgB2; Sarti. The temperature dependence of the mw conductivity, at zero DC magnetic field, has been justified considering the coexistence of two different superconducting fluids, one related to carriers living on the band and the other to carriers living on the band Lee; emiliano. The magnetic field dependence of the surface resistance has shown an anomalous behavior especially at low temperatures; several authors have highlighted unusually enhanced field-induced mw losses at applied magnetic fields much lower than the upper critical field shibata; dulcic; nova; isteresiMgB2. Sarti et al. Sarti, investigating the mw surface impedance of MgB2 film, have shown that at low fields, when the contribution of the -band superfluid cannot be neglected, the magnetic-field dependence of the real and imaginary components of the surface impedance exhibits several anomalies. Furthermore, a magnetic hysteresis of unconventional shape has been detected in the curves isteresiMgB2; EUCAS2007. All these results have suggested that in a wide magnetic-field range the standard models for fluxon dynamics fail when applied to MgB2.
In this paper, we report on the microwave surface resistance of two of the polycrystalline samples studied in Refs. tarantini1; pallecchi; gonnelli2; putti2; puttiSUST2008. We have investigated the unirradiated sample, which clearly shows two-gap superconductivity, and the sample irradiated at the highest neutron fluence, in which the two gaps merge into a single value. The investigation has been carried out with the aim to compare the results obtained in two-gap and one-gap MgB2 superconductors. To our knowledge, the mw response of neutron-irradiated MgB2 samples has not yet been investigated. The mw surface resistance has been measured as a function of the temperature, in the range K, and the DC magnetic field, from 0 to 1 T, at increasing and decreasing values. We show that the results obtained in the strongly irradiated sample can quite well be justified in the framework of standard models, in the whole ranges of temperatures and magnetic fields investigated. On the contrary, the results obtained in the pristine sample cannot thoroughly be justified. In particular, the behavior at zero field has been accounted for, in the framework of the two-fluid model, assuming a linear temperature dependence of the normal and condensed fluid densities. At low temperatures, the field dependence of has shown several anomalies, among which a magnetic hysteresis having a unexpected shape. At temperatures near and applied magnetic fields greater than , the results are well accounted for in the framework of the Coffey and Clem model CC, with fluxons moving in the flux-flow regime, taking into account the anisotropy of the upper critical field.
2 Experimental apparatus and samples
The microwave surface resistance, , has been investigated in two bulk MgB2 samples. The procedure for the preparation and irradiation of the samples is reported in detail elsewhere tarantini1; putti2. The samples have been prepared by direct synthesis from Mg (99.999% purity) and crystalline isotopically enriched 11B (99.95% purity), with a residual 10B concentration lower than 0.5%. The use of isotopically enriched 11B makes the penetration depth of the thermal neutrons greater than the sample thickness, guarantying the irradiation effect almost homogeneous over the sample. Several superconducting properties of the samples have been reported in Refs. tarantini1; pallecchi; gonnelli2; putti2; puttiSUST2008. For simplicity and ease of comparison, we label the two samples as in Ref. tarantini1, i.e. P0 (pristine ) and P6 (irradiated at the highest neutron fluence). According to point-contact spectroscopy gonnelli2 and specific-heat measurements putti2, sample P0 shows a clear two-gap superconductivity; in sample P6 the irradiation process at very high fluence ( cm-2) determined a merging of the two gaps into a single value.
Sample P0 has a nearly parallelepiped shape with , mm and mm; it undergoes a narrow superconducting transition with K and K (from 90% to 10% of the normal-state resistivity); its residual normal-state resistivity is and the residual resistivity ratio RRR 11, the critical current density at zero magnetic field is A/cm2, and ; the anisotropy factor of the upper critical field at K is tarantini1; pallecchi.
Sample P6 has a nearly parallelepiped shape with mm, mm and mm. The main characteristic parameters of sample P6 are: K, K, RRR 1.1, . The critical current density at K and at zero magnetic field is A/cm2; it exhibits a monotonic decrease with the magnetic field, following roughly an exponential law. The upper critical field is isotropic and its value at K is .
The effects of the neutron irradiation on both superconducting and normal-state properties of a large series of Mg bulk samples, including sample P0 and P6, have extensively been investigated in Refs. tarantini1; pallecchi; puttiSUST2008. On increasing the neutron fluence, it has been observed a monotonic decrease of and an increase of the residual normal-state resistivity . Nevertheless, it has been shown that the irradiation does not affect the variation of the normal-state resistivity . As suggested by Rowell Rowell, just is a parameter that gives information on the grain connectivity. The results reported in Ref. tarantini1 show that remains of the order of cm over the whole range of irradiation level; in particular, in sample P0 cm and in sample P6 cm, indicating that thermal-neutron irradiation does not affect the grain-boundary properties. On the other hand, it has been shown that either neutron irradiation or He-ion irradiation gandikota do not affect the grain connectivity, even at high irradiation levels, contrary to what occurs using heavy-ion irradiation ghigo. Recent studies by transmission electron microscopy have highlighted that neutron irradiation in these samples creates nanometric amorphous regions (mean diameter nm) in the crystal lattice, whose density scales with the neutron dose puttiSUST2008. Studies on the field dependence of the critical current density have shown that at moderate neutron-fluence levels () such defects introduce new pinning centers, leading to an improvement of the critical current density; on the contrary, for neutron fluence higher than (as for sample P6) these nanometric defects do not act as pinning centers because they are smaller than the coherence length puttiSUST2008. Moreover, these studies have shown that in the pristine and the heavily irradiated samples the pinning mechanism is ruled by grain boundaries. The defects induced by neutron irradiation act as inter- and intra-band scattering centers; the intra-band scattering causes a reduction of the electron mean free path and is responsible for the growth of the normal-state resistivity. The reduction of has been ascribed to both the scattering processes and the smearing of the electron density of states near the Fermi surface gandikota; tarantini1.
Although in the two samples is roughly the same, in sample P6, due to the reduced value, , affecting noticeably the temperature dependence of the mw surface resistance near . On the other hand, from AC susceptibility measurements at 100 kHz, we have found that the first derivative of the real part of the AC susceptibility can be described by a Gaussian distribution function of , centered at K with K. In the following, we will use this distribution function to quantitatively discuss the results obtained in sample P6. On the contrary, for sample P0, is one order of magnitude smaller, not noticeably affecting the curve.
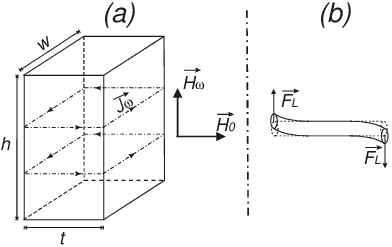
The mw surface resistance has been measured using the cavity-perturbation technique golo. A copper cavity, of cylindrical shape with golden-plated walls, is tuned in the mode resonating at GHz. The sample is located in the center of the cavity, by a sapphire rod, where the mw magnetic field is maximum. The cavity is placed between the poles of an electromagnet which generates DC magnetic fields up to T. Two additional coils, independently fed, allow compensating the residual field and working at low magnetic fields. A liquid-helium cryostat and a temperature controller allow working either at fixed temperatures or at temperature varying with a constant rate. The sample and the field geometries are shown in Fig. 1a; the DC magnetic field is perpendicular to the mw magnetic field, . When the sample is in the mixed state, the induced mw current causes a tilt motion of the whole vortex lattice brandt; Fig. 1b schematically shows the motion of a flux line.
The surface resistance of the sample is given by
where is the quality factor of the cavity loaded with the
sample, that of the empty cavity and the geometry
factor of the sample.
The quality factor of the cavity has been
measured by an hp-8719D Network Analyzer. The surface resistance
has been measured as a function of the temperature, at fixed
values of the DC magnetic field, and as a function of the field,
at fixed temperatures. All the measurements have been performed at very low input power; the estimated amplitude of the mw magnetic field in the region in which the sample is located is of the order of T.
3 Experimental results
Figure 2 shows the temperature dependence of the surface resistance in the pristine (a) and irradiated (b) MgB2 samples, at different values of the DC magnetic field. In order to disregard the geometry factor, and compare the results in samples of different dimensions, we have normalized the data to the value of the surface resistance in the normal state, , at . The results have been obtained according to the following procedure: the sample was zero-field cooled (ZFC) down to low temperature, then was set at a given value and kept constant during the time the measurement has been performed.
On increasing , the curves broaden and shift towards lower temperatures; however, the effects of the applied magnetic field is different in the two samples. Although the value of of sample P0 at low temperatures is one order of magnitude larger than that of P6, the field-induced variations of in the two samples have roughly the same magnitude. In sample P0, one can observe an anomalously enhanced field-induced broadening of the curve, which extends down to the lowest temperature. On the contrary, in sample P6 the larger shift of the curve induced by is expected because of the lower value.

The field-induced variations of have been investigated for different values of the temperature. For each measurement, the sample was ZFC down to the desired temperature; the DC magnetic field was increased up to a certain value and, successively, decreased down to zero. Figures 3, 4 and 5 show the field-induced variations of for the two samples, at different temperatures. In all the figures, , where is the residual mw surface resistance at K and ; moreover, the data are normalized to the maximum variation, . The continuous lines reported in the figures are the best-fit curves obtained by the model reported in Sec. 4.
In both samples, does not show any variation as long as the magnetic field reaches a certain value, depending on , that identifies the first-penetration field, . For , vortices start to penetrate the sample and, consequently, increases.
Figure 3 refers to the results obtained at K. At this temperature, in both samples the curves exhibit a magnetic hysteresis, which disappears for higher than a certain value, indicated in the figure as . The inset in panel (b) shows a minor hysteresis loop obtained by sweeping from 0 to 0.25 T and back. The field-induced variations of in sample P0 show some anomalies. Firstly, the application of a magnetic field of T, which is about , causes a variation of of the maximum variation. These field-induced variations of are much greater than those expected from the models reported in the literature CC; brandt; dulcicvecchio and detected in other superconductors TALVA; noiBKBO. A comparison with the results of panel (b) shows that in sample P6 a variation of the same order is obtained for the same value of , even though, in this case, 1 T is about . Results similar to those obtained in P0 have been observed in other MgB2 samples, produced by different methods and, therefore, seems to be a peculiarity of MgB2 shibata; nova; isteresiMgB2; EUCAS2007. The finding that in sample P6 we have not observed this anomalous result strongly suggests that the enhanced variation is due to the two-gap superconductivity.

A magnetic hysteresis of is expected in superconducting samples in the critical state; it is ascribable to the different magnetic induction at increasing and decreasing DC fields noiisteresi. Most likely, the different amplitude of the hysteresis loop obtained in the two samples is due to the different values of the critical current density; a smaller hysteresis is observed in sample P6 because of the smaller value. However, as it is visible in Fig. 3, also the shape of the hysteresis loop is different in the two samples. The decreasing-field branch of the curve in sample P6 has a negative concavity down to , as expected noiisteresi. On the contrary, in sample P0 one can observe a plateau, in the field range T, which cannot be justified in the framework of the critical-state models, considering the measured field dependence of tarantini1. We would like to remark that this result has been obtained in all of the MgB2 samples we have investigated isteresiMgB2; EUCAS2007.
Figure 4 shows the field-induced variations of , for sample P0 (a), at K, and for sample P6 (b), at K; for both samples, . In the curve of sample P0 the hysteresis is still present, probably due to the high value of at this temperature, and still has an anomalous shape. We remark that in sample P0 we have observed magnetic hysteresis of up to , while in sample P6 the hysteresis becomes undetectable at .

Figure 5 shows the field-induced variations of at temperatures near , where in both samples the curve is reversible. As will be shown in Sec. 5, at temperatures near the field dependence of the mw surface resistance can be accounted for by standard models also for sample P0, provided that the anisotropy of the upper critical field is taken into account.

From isothermal curves, obtained at different temperatures, we have deduced the temperature dependence of the characteristic fields, , and . In Fig. 6 we report the values of , and as a function of the reduced temperature, , for the two samples. The inset in panel (b) shows of sample P6 in an enlarged scale.

From Fig. 6a, one can see that of sample P0 exhibits a linear temperature dependence down to low temperatures, consistently with results reported by different authors in bulk Li; sharoni and crystalline caplin; Lyard MgB2 samples. The extrapolated value at is about 55 mT; so, considering the demagnetization effect, the estimated value of the lower critical field is mT. This value, although consistent with the lower critical field reported for MgB2 crystals by some authors Lyard, is slightly larger than that reported for bulk samples, which ranges from 15 to 45 mT. We suggest that this is ascribable to weak surface-barrier effects.
In sample P6 we have obtained values smaller, but of the same order, than those of sample P0; this may be due to the irradiation effects. Indeed, the authors of Ref. Magnetiz, from magnetization measurements in neutron-irradiated MgB2 crystals, have observed that the lower critical field reduces monotonically on increasing the fluence.
The values of indicated in Fig. 6b as open triangles have been deduced measuring the magnetic field at which reaches the normal state value, . At the temperatures in which the upper critical field of sample P6 is higher than the maximum magnetic field achievable with our experimental apparatus ( T), the values (full triangles in the figure) have been obtained as best-fit parameters, using the model reported in Sec. 4. On the contrary, since the results obtained in sample P0 cannot be accounted for by the model (except at temperature close to ), we report only the values we have directly deduced from the experimental results. For K, the values we obtained for , in both samples, agree with those reported in Ref. tarantini1 (the authors do not report at lower temperatures). Our results give complementary information about the temperature dependence of of sample P6 at low temperatures. The continuous line in Fig. 6b has been obtained by fitting the data of sample P6 with ; we have obtained, as best-fit parameters, T, and K. This temperature dependence of the upper critical field is consistent with that expected in conventional superconductors. On the contrary, for sample P0 we observed an upward curvature of , clearly visible in the inset, characteristic of two-gap MgB2 materials sologu; gurevich; golubovHc2.
of Fig. 6c corresponds to the value of the DC magnetic field at which the decreasing-field branch of the curves deviates from the increasing-field branch. The zero values (without error bar) mean that the hysteresis is not detectable at the corresponding temperatures. Consistently with the lower value of the critical current density, is smaller in sample P6 than in P0. We would like to remark that the values of could differ from the irreversibility field deduced from magnetization measurements. Indeed, it has been shown that, in samples of finite dimensions, the application of an AC magnetic field normal to the DC field can induce the fluxon lattice to relax toward an uniform distribution brandt3. Furthermore, measurements we have performed in different superconducting samples have pointed out that, for samples of millimetric size, the sensitivity of our experimental apparatus does not allow resolving magnetic hysteresis of when . By considering the values of reported in Ref. tarantini1, at K we should obtain T for sample P6 and T for sample P0. From Fig. 6c, one can see that this expectation is verified in sample P6; on the contrary, the value of in sample P0 is about one order of magnitude smaller than the expected one.
4 The model
Microwave losses induced by static magnetic fields have been investigated by several authors golo; TALVA; noiBKBO; CC; brandt; dulcicvecchio; noiisteresi; noistatocritico. At low temperatures and for applied magnetic fields lower enough than the upper critical field, the main contribution arises from the fluxon motion; however, it has been pointed out that a noticeable contribution can arise from the presence of normal fluid, especially at temperatures near and for magnetic fields of the same order of . The majority of the models assume an uniform distribution of fluxons inside the sample; so, they disregard the effects of the critical state. Very recently, we have investigated the field-induced variations of the mw surface resistance in superconductors in the critical state noiisteresi; noistatocritico, and have accounted for the magnetic hysteresis in the curves.
In the London local limit, the surface resistance is proportional
to the imaginary part of the complex penetration depth,
, of the em field:
| (1) |
The complex penetration depth has been calculated in different approximations CC; brandt. Coffey and Clem (CC) have elaborated a comprehensive theory for the electromagnetic response of superconductors in the mixed state, in the framework of the two-fluid model of superconductivity CC. The theory has been developed under two basic assumptions: i) inter-vortex spacing much less than the field penetration depth; ii) uniform vortex distribution in the sample. With these assumptions vortices generate a magnetic induction field, , uniform in the sample. This approximation is valid for whenever the fluxon distribution can be considered uniform within the AC penetration depth.
In the linear approximation, , expected from the CC model is given by
| (2) |
with
| (3) |
| (4) |
where is the London penetration depth at ,
is the normal-fluid skin depth at ,
is the fraction of normal electrons at ; in
the Gorter and Casimir two-fluid model .
is the effective complex skin depth
arising from the vortex motion; it depends on the relative
magnitude of the viscous and restoring-pinning forces, which identities the depinning
frequency .
can be written as
| (5) |
where
| (6) |
with the viscous-drag coefficient and the quantum of flux.
When the frequency of the em wave, , is much lower than
, the fluxon motion is ruled by the restoring-pinning
force. On the contrary, for , the fluxon
motion takes place around the minimum of the pinning-potential
well and, consequently, the restoring-pinning force is nearly
ineffective. So, the contribution of the viscous-drag force
predominates and the induced em current makes fluxons move in the
flux-flow regime. In this case, enhanced field-induced energy
losses are expected.
As it is clear from Eqs. (1–4), it is expected that the features of the curves strongly depend on the applied-field dependence of . On the other hand, the CC theory is strictly valid when is uniform inside the sample; in particular for , the curves can be described setting . When fluxons are in the critical state, the assumption of uniform is no longer valid and the CC theory does not correctly describe the field-induced variations of . As a consequence, the hysteresis in the curve cannot be justified by Eqs. (1–4). In our field geometry (see Fig. 1a), the effects of the non-uniform distribution on are particularly enhanced because in the two surfaces of the sample normal to the external magnetic field the mw current and fields penetrate along the fluxon axis and, consequently, the mw losses involve the whole vortex lattice. However, in this case, one can easily take into account the non-uniform distribution by calculating a proper averaged value of over the whole sample as follows noiisteresi; noistatocritico
| (7) |
where is the sample surface, is its area and
r identifies the surface element.
The pinning effects are particularly enhanced
at temperatures smaller enough than , where the dissipations
are essentially due to vortex motion. So, the main contribution to
comes from the sample regions in which fluxons experience
the Lorentz force due to the mw current, i.e. where
.
Furthermore, in order to take into due account the critical-state
effects by Eq. (7), it is essential to know the
profile inside the sample, determined by .
Recently, using this method, we have investigated the effects of the critical state on the field-induced variation of , at increasing and decreasing fields noiisteresi; noistatocritico. We have shown that the parameter that mainly determines the peculiarities of the curve is the full penetration field, . Firstly, the width of the hysteresis is directly related to the value of ; samples of small size and/or small are expected to exhibit weak hysteretic behavior. Furthermore, determines the shape of the hysteresis loop as well. On increasing the external field from zero up to , more and more sample regions contribute to the mw losses; this gives rise to a positive curvature of the increasing-field branch of the curve. For , in the whole sample the local magnetic induction depends about linearly on the external field and the increasing-field branch is expected to have a negative concavity. The shape of the decreasing-field branch is strictly related to the shape of the magnetization curve; it should exhibit a negative concavity, with a monotonic reduction of in the whole field range swept.
5 Discussion
As we have shown in Sec. 3, the curves exhibit different peculiarities in the unirradiated sample (P0) and the strongly irradiated sample (P6). The model described in Sec. 4 fully justifies the experimental results obtained in sample P6, which exhibits a single-gap superconductivity gonnelli2; putti2. On the contrary, the results obtained in sample P0 cannot be justified in the framework of the same model, either for the magnetic-field dependence or for the temperature dependence of the surface resistance, even at zero DC field. Only the results obtained at temperatures close to can be justified, provided that the anisotropy of the upper critical field is taken into due account. In the following, firstly we will discuss the temperature dependence of the mw surface resistance in the absence of DC magnetic fields; successively, we will discuss the field-induced variations of .
5.1 Temperature dependence of in zero magnetic field
Figure 7 shows the normalized values of the surface resistance at as a function of the reduced temperature for both samples. The curve of sample P6 shows a wide transition, broadened in a roughly symmetric way with respect to the middle point at . This behavior can be ascribed to the distribution over the sample. On the contrary, in sample P0 one can notice a sharp variation of , at temperatures near , and a wide tail, extending from down to , which cannot be ascribed to the distribution. The lines in the figure are best-fit curves; they have been obtained with different procedures for the two samples.

The results obtained from the model discussed in Sec. 4 setting in Eqs. (1–4) converge to those of the em response of superconductors in the Meissner state, in the framework of the two-fluid model. In this case, the temperature dependence of is determined, apart from the distribution over the sample, by the temperature dependence of the normal-fluid density, , and the ratio . In order to fit the experimental data obtained in sample P6, we have assumed , consistently with the Gorter and Casimir two-fluid model, and have used Eqs. (1–4) with . We have averaged the expected curve over a gaussian distribution function of with K and K (see Sec. 2) and have used as fitting parameter. The best-fit curve, dashed line in Fig. 7, has been obtained with ; however, we have found that the expected curve is little sensitive to variations of , except at low temperatures, where the measured is limited by the sensitivity of our experimental apparatus. In particular, by varying and within the experimental uncertainty, good agreement is obtained with values ranging from 0.04 to 0.15. This occurs because the distribution broadens the curve, hiding the effects.
Unlike for sample P6, the results of Fig. 7 obtained in P0 cannot be justified in the framework of the Gorter and Casimir two-fluid model, using reasonable values of . On the other hand, different authors Jin-lambda; golubov; moca have shown that the temperature dependence of the field penetration depth in MgB2 cannot be accounted for by either the Gorter and Casimir two-fluid model or the standard BCS theory. A linear temperature dependence of the condensed fluid density, in a wide range of temperatures below , has been reported, which has been justified in the framework of two-gap models for the MgB2 superconductor golubov; moca. Prompted by these considerations, we have hypothesized a linear temperature dependence of . The continuous line in Fig. 7 is the best-fit curve; it has been obtained by Eqs. (1–4) with , and . The wide low- tail is essentially determined by the linear temperature dependence of . The sensitivity achievable by our experimental apparatus does not allow determining the small variations of for ; so, from measurements no indication about the temperature dependence of the densities of the normal and condensed fluids at low temperatures can be obtained. However, the linear temperature dependence of the lower critical field we obtained (see Fig. 6a) strongly suggests that linearly depends on down to low temperatures.
5.2 Field dependence of in sample P6
In conventional (single-gap) superconductors, it is expected that the field dependence of the mw surface impedance is described by the model reported in Sec. 4. In this framework, in order to calculate the expected field-induced variations, by Eqs. (1–4), the essential parameters are the value of , , the depinning frequency, , and its field dependence. It is not necessary to consider the upper-critical-field anisotropy, , because it has been shown that in the P6 sample pallecchi. When the critical-state effects cannot be neglected, in order to use Eq. (7), it is also essential to know the profile of the induction field determined by the field dependence of the critical current density. The value of has been determined by fitting the curve at ; the critical current density and its field dependence are reported in Ref. tarantini1. The values of at K are reported in Ref. tarantini1, and/or deduced from our experimental data; at K, has to be considered as parameter. It is worth noting that the large uncertainty of , we obtained for this sample, does not affect the best-fit curves because this parameter essentially determines the normalized value at .
As one can see from Fig. 3, at K the curve exhibits a magnetic hysteresis, indicating that the effects of the critical state are not negligible. In order to use Eq. (7), we have calculated the profile in the sample using the field dependence of the critical current, , reported in Ref. tarantini1 and we have set the induction field at the edges of the sample as ; we have taken and as fitting parameters. The line of Fig. 3b is the best-fit curve; it has been obtained with T and independent of . For the sake of clarity, in Fig. 8 we report the results obtained by sweeping the DC magnetic field from 0 to 0.25 T and back, along with the expected curve. The inset shows the profile along the width of the sample at half height, determined by ; the continuous lines are the increasing-field profiles, the dashed ones are the decreasing-field profiles at the same external-field values. As one can see, taking into account the field distribution inside the sample, the experimental results are quite well justified in the framework of the model discussed in Sec. 4. In the increasing-field branch, a change of concavity is well visible at T, consistently with the expected value of the full penetration field; the decreasing-field branch exhibits a negative concavity in the whole range of fields.

Following the procedure above described, from the best fit of the experimental data of the isothermal curves at K we have obtained the values indicated as full triangles in Fig. 6b.
When the curves do not show hysteresis, the effects of
the critical state are negligible and the induction field, ,
can be considered uniform. In this case,
we have used the following approximate expression for the magnetization:
and, consequently
Several calculations have shown that, in order to fit the experimental data at K, it is essential to consider the distribution over the sample. So, we have averaged the expected curves [calculated by Eqs. (1–4)] over the distribution (see Sec. 2). We have used for and the values deduced from the experimental data, letting them vary within the experimental uncertainty, and have considered the depinning frequency as parameter. The lines of Figs. 4 and 5 have been obtained by this procedure.
By fitting the results at K, we have obtained the field dependence of reported in Fig. 9. The roughly constant value of we obtained up to T indicates that in this field range individual vortex pinning occurs; on further increasing the magnetic field, the interaction between fluxons becomes important, collective vortex pinning sets in and, consequently, the depinning frequency decreases. The data obtained at T are well fitted setting in Eq. (5); this means that, at K and T, the induced mw current makes fluxons move in the flux-flow regime.

The best-fit curve of Fig. 5 has been obtained with , as expected. Indeed, at temperature very close to , the pinning effects are weak and the induced mw current makes fluxons move in the flux-flow regime.
5.3 Field dependence of in sample P0
It has been shown by several authors that the properties of the two-gap MgB2 superconductor in the mixed state cannot be accounted for by standard theories sologu; bouquet-H; Magnetiz; Jia; Yang; shibata; dulcic; Sarti. It is by now accepted that this is related to the double-gap nature of MgB2 that is responsible for an unusual vortex structure. Indeed, it has been highlighted, both experimentally and theoretically, that the vortex cores are characterized by two different spatial and magnetic-field scales koshelev; eskil. Because of the different magnetic-field dependence of the two gaps, on varying the field, the structure of the vortex lattice changes in an unusual way. At low magnetic fields, quasiparticles by and bands are trapped within the vortex core, even if on different spatial scales because of the different coherence lengths and ; in the field range T, though -band quasiparticles remain localized, the -band quasiparticles spread over the sample eskil; on further increasing the field, is strongly reduced, the -quasiparticle contribution remains almost unchanged while the -quasiparticle contribution continues to increase with about the same rate up to the macroscopic . So, a further characteristic field is needed for determining the fluxon-lattice properties of MgB2; the existence of this crossover field, often indicated as , has been highlighted in several experiments sologu; bouquet-H; eskil; cubit; samuely; gonnelli1. The field-induced evolution of the vortex lattice is expected to affect the vortex-vortex and vortex-pinning interactions, making the standard models most likely inadequate to describe the fluxon dynamics.
Results on the field-induced variations of in MgB2 have been reported by some authors shibata; dulcic; nova; isteresiMgB2; Sarti; EUCAS2007; zait; most of them have highlighted several anomalies, which cannot be explained in the framework of standard models for fluxon dynamics. In particular, it has been highlighted unusually enhanced field-induced mw losses at applied magnetic field much lower than . Only Zaitsev et al. zait have explained the frequency and field dependence of the mw surface resistance of MgB2 films in the framework of standard models. The results we have obtained in sample P0 are similar to those reported by Shibata et al. shibata, who investigated the field dependence of the surface impedance in MgB2 single crystal in a wide range of DC magnetic fields (up to 14 T). At low temperatures, the authors have observed an initial fast variation of the field-induced mw dissipation up to fields of the order of 1 T, followed by a slower one at higher fields. Consistently with the sharp field-induced variation of the heat capacity and thermal conductivity, the enhanced low-field variation of the mw losses has been ascribed to the high increase of quasiparticles in the vortex cores. At higher fields, the variation is slower because of the saturation of the -quasiparticle contribution.
According to Shibata et al., the enhanced field-induced variation we observed in sample P0 can be qualitatively ascribed to the strong reduction of in the field range we have investigated. However, the observed curves differ from the expected ones in both the intensity and the shape. Here, we discuss the shape of the curves.
In a wide range of temperatures below , we have observed a magnetic hysteresis, which should be related to the different magnetic induction at increasing and decreasing fields, due to the critical state. As discussed in Sec. 4, the increasing-field branch of the curve should exhibit a change of concavity, from positive to negative, when the external magnetic field reaches the full penetration field, . By considering the sample width and the value of at K reported for sample P0 tarantini1, the expected value of is T. Nevertheless, we observe a negative concavity of the increasing-field branch in the whole range of fields investigated (see Fig. 3a), even if the maximum value of the applied field is well below . The decreasing-field branch should show a monotonic reduction of down to low fields. In contrast, for , we observe an initial weak reduction followed by a plateau, from T down to zero. The presence of this plateau is puzzling because it would suggest that the trapped flux does not change anymore on decreasing the field below T, although this value is four times larger that .
Another anomalous result concerns the range of magnetic fields in which we observe the hysteretic behavior. As we have already mentioned, we have experienced that for samples of millimetric size the sensitivity of our experimental apparatus allows detecting hysteresis in for . From Fig. 9 of Ref. tarantini1, one can deduce that, in sample P0, such condition occurs at T; so, we should detect hysteresis in the whole range of fields we have investigated. On the contrary, we obtained T, one order of magnitude lower than the expected value.
We would like to remark that these anomalies have been observed in all the bulk MgB2 samples (unirradiated) we have investigated, no matter the preparation method and the components (11B or 10B) used in the synthesis process isteresiMgB2; EUCAS2007. The finding that in sample P6 the experimental results are fully justified by the used model, strongly suggests that these anomalies are strictly related to the presence of the two superconducting gaps.
At temperatures close to and for , the experimental results can be accounted for by the model discussed in Sec. 4, provided that the anisotropy of the upper critical field is taken into due account. Following Ref. pallecchi, to take into account the anisotropy, we have assumed that the polycrystalline sample is constituted by grains with the -axis randomly oriented with respect to the DC-magnetic-field direction; so, the distribution of their orientations follows a law, being the angle between and . Furthermore, we have used for the angular dependence of the upper critical field the anisotropic Ginzburg-Landau relation
where is the anisotropy factor.
The field-induced variations of observed at K (reported in Fig. 5a) do not exhibit hysteresis; so, in this case, can be considered uniform. Furthermore, at temperatures near , one can reasonably suppose fluxons move in the flux-flow regime. In this condition, the expected curve depends on (obtained by fitting the curve at ), and . On the other hand, the values deduced from the isothermal curves (see Fig. 6b) coincide with the magnetic field at which the whole sample goes to the normal state, i.e. . In order to fit the results at K, we have averaged the expected curve [calculated by Eqs. (1–4)] over a distribution, have used for the value of the magnetic field at which , letting it vary within the experimental uncertainty, have taken as free parameter. At this value of temperature, the experimental results can be accounted for using . In particular, the best-fit curve reported in Fig. 5a has been obtained with and mT. As one can see, the field-induced variation of is well described by the model of Sec. 4. We think that this occurs because at this temperature the superfluid fraction of the band is strongly suppressed at low magnetic fields, the flux line gets a conventional structure and the fluxon dynamics can be described by standard models.

Prompted by the results obtained at K, we have tried to fit the experimental data obtained in the temperature range K by the same method (for these temperatures, the upper critical field has been directly deduced from the curves). Since in this temperature range we have detected magnetic hysteresis, we have considered only the reversible part of the curve. In order to fit the data, we have hypothesized fluxons move in the flux-flow regime, have considered for the values reported in the inset of Fig. 6b, letting them vary within the experimental uncertainty, and have taken as fitting parameter. We have found that at high fields the experimental results can be fitted using . Fig. 10 shows a comparison between the expected curves, obtained with , and the experimental data for K; open symbols are the results obtained at increasing , full symbols those at decreasing . As one can see, the expected curve at K so obtained poorly agrees with the experimental data at low fields; on the contrary, the line of Fig. 5a, which has been obtained with , fits the data in the whole range of magnetic fields. However, the value is closer to the upper-critical-field anisotropy reported in the literature for MgB2 at temperatures near golubovHc2; cubit; caplin; Lyard.
The results of Fig. 10 show that for greater than a certain threshold value, depending on , the data can be justified in the framework of the model describing the fluxon dynamics of conventional vortex lattice. The temperature dependence of the threshold field, , is reported in the inset. For the field-induced mw losses are larger than those expected for single-gap superconductors in the mixed state. We suggest that this surplus of mw losses is due to the additional contribution of -band quasiparticles within the vortex cores with respect to that of one-gap superconductors; the finding that decreases on increasing seems to support this hypothesis. It is easy to see that the values coincide, within the experimental uncertainty, with (see the inset of Fig. 6). Presently, it is not clear why just above the results can be justified by a standard model, which does not consider the two-gap nature of MgB2. Furthermore, we remark that cannot be identified with the magnetic field at which the -band superfluid is suppressed; indeed several authors have reported sologu; bouquet-H; eskil; cubit; samuely; gonnelli1.
6 Conclusions
We have investigated the microwave surface resistance at 9.6 GHz of two polycrystalline samples prepared by direct synthesis from Mg (99.999% purity) and crystalline isotopically enriched 11B (99.95% purity). That labelled as P0 consists of pristine material; the other, labelled as P6, has been exposed to neutron irradiation at very high fluence. Several superconducting properties of these samples have been reported in Refs. tarantini1; pallecchi; gonnelli2; putti2; puttiSUST2008. Point-contact spectroscopy and specific-heat measurements, have shown that sample P0 exhibits a clear two-gap-supercon-ductivity behavior; in sample P6 the irradiation process determined a merging of the two gaps into a single value. To our knowledge, the mw response of neutron irradiated MgB2 samples has not yet been investigated.
The mw surface resistance has been measured as a function of the temperature and the DC magnetic field. By measuring the field-induced variations of at increasing and decreasing fields we have detected a magnetic hysteresis ascribable to the critical state of the fluxons lattice. The range of temperatures in which the hysteretic behavior has been observed is different for the two samples; in the irradiated sample the hysteresis is undetectable at while in the unirradiated sample it is detectable up to .
The results obtained in the irradiated sample have been quite well justified in the framework of the Coffey and Clem model with the normal fluid density following the Gorter and Casimir two-fluid model. In order to account for the hysteretic behavior, we have used a generalized Coffey and Clem model in which we take into account the non-uniform fluxon distribution due to the critical state.
The peculiarities of the mw surface resistance of sample P0 differ from those observed in sample P6, in both the temperature and the field dependencies. The curve obtained at zero field shows a wide tail, from down to , which cannot be justified in the framework of the Gorter and Casimir two-fluid model. We have shown that, in order to account for this behavior, it is essential to hypothesize a linear temperature dependence of the normal and condensed fluid densities. Such finding agrees with the experimental temperature dependence of the penetration depth reported in the literature, which have been justified in the framework of two-gap models for the MgB2 superconductor.
The curves in sample P0 have shown several anomalies, especially at low temperatures, among which an enhanced field-induced variation and a magnetic hysteresis of unconventional shape. At low temperatures, a magnetic field causes a variation of of the normal-state value. We remark that in sample P6 a variation of the same order of magnitude is obtained for . The shape of the magnetic hysteresis, which has been observed in a wide range of temperatures below , cannot be justified in the framework of the critical-state models; the most unexpected behavior concerns the decreasing-field branch, in which we observed a plateau extending from T down to zero. The presence of this plateau is puzzling because it would suggest that the trapped flux does not change anymore on decreasing the field below 0.2 T, although this value is four times larger than the first penetration field.
The investigation at temperatures near has highlighted that, in the range K, the results obtained in sample P0 for can be justified in the framework of the Coffey and Clem model taking into account the anisotropy of the upper critical field. We suggest that this occurs because at these field values the superfluid fraction of the band is strongly suppressed, the flux line gets a conventional structure and the fluxon dynamics can be described by standard models.
The enhanced field-induced variation of , observed at low in the whole range of fields investigated as well as at for , may be qualitatively ascribed to the presence and motion of the giant cores due to the -band quasiparticles. On the contrary, the origin of the anomalous shape of the curve is so far not understood. We would like to remark that the results we obtained in sample P0 are very similar to those, not reported here, we have obtained in several MgB2 samples (unirradiated), no matter the preparation method and the components ( or ) used in the synthesis process. The comparison between the results obtained in the two samples here investigated strongly suggest that the anomalies in the curves are related to the unusual structure of fluxons due to the two superconducting gaps. According to what suggested by different authors, our results confirm that the standard models are inadequate to describe the fluxon dynamics in two-gap MgB2. Further investigation is necessary for understanding how to take into account the complex vortex structure in describing the fluxon dynamics in MgB2.
Acknowledgements
The authors are very glad to thank D. Daghero, G. Ghigo, R. S. Gonnelli and M. Putti for their interest to this work and helpful suggestions; G. Lapis and G. Napoli for technical assistance.
References
- (1) A. V. Sologubenko, J. Jun, S. N. Kazakov, J. Karpinski, H. R. Ott, Phys. Rev. B 65, 180505 (2002); ibid. 66, 014504 (2002).
- (2) B. B. Jin, N. Klein, W. N. Kang, H.-J. Kim, E.-M. Choi, S.-I. Lee, T. Dahm, K. Maki, Phys. Rev. B 66, 104521 (2002).
- (3) F. Bouquet, Y. Wang, I. Sheikin, T. Plackovski, A. Junod, Phys. Rev. Lett. 89, 257001 (2002).
- (4) A. Gurevich, Phys. Rev. B 67, 184515 (2003).
- (5) A. A. Golubov, A. E. Koshelev, Phys. Rev. B 68, 104503 (2003).
- (6) A. A. Golubov, A. Brinkman, O. V. Dolgov, J. Kortus, O. Jepsen, Phys. Rev. B 66, 054524 (2002).
- (7) A. Y. Liu, I. I. Mazin, J. Kortus, Phys. Rev. Lett. 87, 087005 (2001).
- (8) I. I. Mazin, O. K. Andersen, O. Jepsen, O. V. Dolgov, J. Kortus, A. A. Golubov, A. B. Kuz’menko, D. van der Marel, Phys. Rev. Lett. 89, 107002 (2002).
- (9) R. H. T. Wilke, S. L. Bud’ko, P. C. Canfield, D. K. Finnemore, R. J. Suplinskas, S. T. Hannahs, Physica C 424, 1 (2005).
- (10) R. H. T. Wilke, S. L. Bud’ko, P. C. Canfield, J. Farmer, and S. T. Hannahs, Phys. Rev. B 73, 134512 (2006).
- (11) R. Gandikota, R. K. Singh, J. Kim, B. Wilkens, N. Newman, J. M. Rowell, A. V. Pogrebnyakov, X. X. Xi, J. M. Redwing, S. Y. Xu, Q. Li, B. H. Moeckly, Appl. Phys. Lett. 86, 012508 (2005); ibid. 87, 072507 (2005).
- (12) G. Ghigo, G. A. Ummarino, R. Gerbaldo, M. Gozzelino, F. Laviano, and E. Mezzetti, Phys. Rev. B 74, 184518 (2006).
- (13) C. Tarantini, H. U. Aebersold, V. Braccini, G. Celentano, C. Ferdeghini, V. Ferrando, U. Gambardella, F. Gatti, E. Lehmann, P. Manfrinetti, D. Marré, A. Palenzona, I. Pallecchi, I. Sheikin, A. S. Siri, M. Putti, Phys. Rev. B 73, 134518 (2006), and Refs. therein.
- (14) I. Pallecchi, C. Tarantini, H. U. Aebersold, V. Braccini, C. Fanciulli, C. Federghini, F. Gatti, E. Lehman, P. Manfrinetti, D. Marré, A. Palenzona, A. S. Siri, M. Vignolo, M. Putti, Phys. Rev. B 71, 212507 (2005).
- (15) D. Daghero, A. Calzolari, G. A. Ummarino, M. Tortello, R. S. Gonnelli, V. A. Stephanov, C. Tarantini, P. Manfrinetti, E. Lehamann, Phys. Rev. B 74, 174519 (2006).
- (16) M. Putti, M. Affronte, C. Federghini, P. Manfrinetti, C. Tarantini, E. Lehmann, Phys. Rev. Lett. 96, 077003 (2006).
- (17) A. Martinelli, C. Tarantini, E. Lehmann, P. Manfrinetti, A. Palenzona, I. Pallecchi, M. Putti, C. Ferdeghini, Supercond. Sci. Technol. 21, 012001 (2008).
- (18) M. Zehetmayer, M. Eisterer, J. Jun, S. M. Kazakov, J. Karpinski, H. W. Weber, Phys. Rev. B 70, 214516 (2004).
- (19) Y. Jia, Y. Huang, H. Yang, L. Shan, C. Ren, C. G. Zhuang, Y. Cui, Qi Li, Z. K. Liu, X. X. Xi, H. H. Wen, arXiv:cond-mat/0703637.
- (20) H. Yang, Y. Jia, L. Shan, Y. Zhang, H. H. Wen, C. G. Zhuang, Z. K. Liu, Qi Li, Y. Cui, X. X. Xi, Phys. Rev. B 76, 134513 (2007).
- (21) A. E. Koshelev, A. A. Golubov, Phys. Rev. Lett. 90, 177002 (2003).
- (22) M. R. Eskildsen, M. Kugler, S. Tanaka, J. Jun, S. M. Kazakov, J. Karpinski, . Fisher, Phys. Rev. Lett. 89, 187003 (2002).
- (23) R. Cubitt, S. Levett, S. L. Bud’ko, N. E. Anderson, P. C. Canfield, Phys. Rev. Lett. 90, 157002 (2003); R. Cubitt, M. R. Eskildsen, C. D. Dewhurst, J. Jun, S. M. Kazakov, J. Karpinski, Phys. Rev. Lett. 91, 047002 (2003).
- (24) P. Samuely, P. Szab, J. Kacmarcik, T. Klein, A. G. M. Jansen, Physica C 385, 244 (2003).
- (25) D. Daghero, R. S. Gonnelli, G. A. Ummarino, V. A. Stephanov, J. Jun, S. M. Kazakov, J. Karpinski, Physica C 355, 255 (2003).
- (26) Y. Bogoslavsky, Y. Miyoshi, G. K. Perkins, A. D. Kaplin, L. F. Cohen, A. V. Progrebnyakov, X. X. Xi, Phys. Rev. B 72, 224506 (2005).
- (27) M. Golosovsky, M. Tsindlekht, D. Davidov, Supercond. Sci. Technol. 9, 1 (1996) and Refs. therein.
- (28) J. Owliaei, S. Shridar, J. Talvacchio, Phys. Rev. Lett. 69, 3366 (1992).
- (29) S. Fricano, M. Bonura, A. Agliolo Gallitto, M. Li Vigni, L. A. Klinkova, N. V. Barkovskii, Eur. Phys. J. B 41, 313 (2004).
- (30) M. W. Coffey, J. R. Clem, Phys. Rev. Lett. 67, 386 (1991); Phys. Rev. B 45, 9872 (1992); 45, 10527 (1992).
- (31) E. H. Brandt, Phys. Rev. Lett. 67, 2219 (1991).
- (32) A. Duli, M. Poek, Physica C 218, 449 (1993).
- (33) S. Y. Lee, J. H. Lee, J.H. Han, S. H. Moon, H. N. Lee, J. C. Booth, J. H. Claassen, Phys. Rev. B 71, 104514 (2005).
- (34) E. Di Gennaro, G. Lamura, A. Palenzona, M. Putti, A. Andreone, Physica C 408-410, 125 (2004).
- (35) A. Shibata, M. Matsumoto, K. Izawa, Y. Matsuda, S. Lee, S. Tajima, Phys. Rev. B 68, 060501(R) (2003).
- (36) A. Duli, D. Paar, M. Poek, V. M. Williams, S. Krmer, C. U. Jung, Min-Seok Park, Sung-Ik Lee, Phys. Rev. B 66, 014505 (2002).
- (37) A. Agliolo Gallitto, G. Bonsignore, S. Fricano, M. Guccione, M Li Vigni, Topics in Superconductivity Research, B. P. Martins Ed., Nova Science Publishers, Inc. (New York 2005), pags. 125-143.
- (38) A. Agliolo Gallitto, M. Bonura, S. Fricano, M. Li Vigni, G. Giunchi, Physica C 404, 171 (2003).
- (39) S. Sarti, C. Amabile, E. Silva, M. Giura, R. Fastampa C. Ferdeghini, V. Ferrando, C. Tarantini, Phys. Rev. B 72, 024542 (2005). E. Silva, N. Pompeo, S. Sarti, C. Amabile, arXiv:cond-mat/0607676v1.
- (40) A. Agliolo Gallitto, M. Bonura, M. Li Vigni, J. Phys: Conf. Series, in press; arXiv:cond-mat/0709.0840.
- (41) J. M. Rowell, Supercond. Sci. Technol. 16, R17 (2003).
- (42) M. Bonura, A. Agliolo Gallitto, M. Li Vigni, Eur. Phys. J. B 53, 315 (2006), and Refs. therein.
- (43) S. L. Li, H. H. Wen, Z. W. Zhao, Y. M. Ni, Z. A. Ren, G. C. Che, H. P. Yang, Z. Y. Liu, Z. X. Zhao, Phys. Rev. B 64, 094522 (2001).
- (44) A. Sharoni, I. Felner, O. Millo, Phys. Rev. B 63, 220508(R) (2001).
- (45) A. D. Caplin, Y. Bugoslavsky, L. F. Cohen, L. Cowey, J. Driscoll, J. Moore, G. K. Perkins, Supercond. Sci. Technol. 16, 176 (2003).
- (46) L. Lyard, P. Szab, T. Klein, J. Marcus, C. Marcenat, K. H. Kim, B. W. Kang, H. S. Lee, S. I. Lee, Phys. Rev. Lett. 92, 57001 (2004).
- (47) E. H. Brandt, G. P. Mikitik, Phys. Rev. Lett. 89, 027002 (2002); G. P. Mikitik, E. H. Brandt, Phys. Rev. B. 67, 104511 (2003).
- (48) M. Bonura, E. Di Gennaro, A. Agliolo Gallitto, M. Li Vigni, Eur. Phys. J. B 52, 459 (2006).
- (49) C. P. Moca, Phys. Rev. B 65, 132509 (2002).
- (50) A. G. Zaitsev, R. Schneider, R. Hott, Th. Schwarz, and J. Geerk, Phys. Rev. B 75, 212505 (2007)