Constraints on dark and visible mass in galaxies from strong gravitational lensingVolume: 244Journal: Dark Galaxies and Lost Baryons
Abstract
We give a non-exhaustive review of the use of strong gravitational lensing in placing constraints on the quantity of dark and visible mass in galaxies. We discuss development of the methodology and summarise some recent results.
1 Introduction
Quantifying the distribution of mass in the Universe is crucial to understanding the physics that governs the formation of structure. It is therefore not surprising that measurement of the morphology and fraction of dark matter in gravitationally bound systems has been a common goal of countless studies to date. In particular, the measurement of galaxy and cluster mass profiles has proven a powerful observational probe for testing the cold dark matter (CDM) model.
Many different techniques have been applied to try to achieve such a goal. The methods used for measuring mass profiles generally fall within one of four categories: dynamics, X-ray measurements, the SZ effect and gravitational lensing. Each has its own set of limitations and pitfalls but since these tend to be specific to the approach used, the methods are largely complementary.
In the case of dynamical observations, complications in interpreting results can arise from incorrect assumptions regarding orbital motions, whether the system is relaxed and in radio data, the effect of beam smearing on the shapes of mass profiles at small scales. X-ray techniques relate the temperature of hot gas to the gravitational potential assuming isothermal conditions apply. This limits the technique to systems which are relaxed and in isothermal equilibrium – departures from these conditions result in a biased mass profile. The scattering of cosmic background radiation by hot gas exploited by the SZ method is potentially very powerful, being detectable up to high redshifts, but with current technology is very challenging and yields mass profiles with relatively poor signal-to-noise.
Gravitational lensing has for some time now provided an attractive alternative means of measuring mass profiles without the difficulties associated with the other methods. Primarily, this is motivated by the simple fact that the deflection angle of a photon passing a massive object is independent of the dynamical state of the mass within the object. A limitation of lensing is that it is sensitive to all mass along the line of sight, although foreground/background alignments of mass occur much less frequently in galaxies than they do on larger scales such as clusters.
A growing number of studies have focused on mass density profiles in the centres of galaxies, comparing observations with the predictions of CDM. [Navarro, Frenk & White (1996)] first proposed an analytic approximation to describe the mass density profiles of halos in their CDM simulations. At small radii (i.e., much smaller than a particular scale radius), the mass density of this so called ‘NFW profile’ scales as . Later simulations by [Moore et al. (1998), Moore et al. (1998,1999)] indicated a steeper inner slope. This gave rise to the ‘generalised’ NFW (gNFW) profile which at radii smaller than the scale radius follows with values of around 1.4 to 1.5. The most recent simulations boasting a significantly higher resolution now converge on a slope somewhere in the range ([Navarro et al. (2004), Navarro et al. 2004]; [Diemand et al. (2005), Diemand et al. 2005]).
In recent years, the slope of the inner mass profile has become a subject of much contention with the results of simulations often being very discrepant with observations. A complication in comparing slopes from pure dark matter simulations with real measurements is that baryons affect the morphology of the halo in a non-trivial way. The canonical view is that baryons cause the halo to contract, steepening its inner slope, and several prescriptions have been given to attempt to describe this (for example, the adiabatic contraction model of [Blumenthal et al. (1986), Blumenthal et al. 1986] or more recently that of [Gnedin et al. (2004), Gnedin et al. 2004]). Regardless of the details, the simple fact that contraction occurs means that inner halo slopes determined from observations are actually an upper limit to the slope the halo would have in the absence of baryons.
Estimates of the inner slope from dynamics are typically the most discrepant with predictions. Several groups measuring rotation curves of low surface brightness galaxies (LSBs – believed to have a high dark matter fraction and therefore be minimally affected by baryons) find a range of slopes; ([de Blok et al. (2001), de Blok & Bosma (2002), Swaters et al. (2003), Spekkens & Giovanelli (2005), de Blok et al. 2001; de Blok & Bosma 2002; Swaters et al. 2003; Spekkens & Giovanelli 2005]). [Hayashi et al. (2004)] purported that this discrepancy could be reconciled by directly comparing against rotation curves of simulated halos. However, this was strongly rejected by [de Blok (2005)] who found that only one quarter of the 51 galaxies in the study of [Hayashi et al. (2004)] were consistent with CDM. In the latest episode of this ongoing debate, [Hayashi & Navarro (2006)] claim that non-circular motions in simulated CDM halos arising from a triaxial potential can explain the range of measured rotation curves seen in LSBs.
The findings of gravitational lensing studies, in particular those of strong lens systems where the inner slope can be measured more precisely than with weak lens systems, are generally in better agreement with the CDM prediction. Strong lens systems allow lens mass profiles to be constrained by searching for the best fit to the observed multiple image positions of a background source (see, for example, the review by [Schneider, Kochanek & Wambsganss (2006), Schneider, Kochanek & Wambsganss 2006]). The lens model typically takes on a parameterised form but non-parametric models have also been explored (see, for example, the pixelised mass modelling by [Saha & Williams (1997), Saha & Williams 1996] applied most recently to mapping substructure in three strong lens systems by [Saha, Williams & Ferreras (2007), Saha, Williams & Ferreras 2007]). [Sand, Treu & Ellis (2002)] enhanced the multiple image fitting technique by incorporating extra constraints from the velocity dispersion profile of the lens, and this has since seen application to a number of systems ([Treu & Koopmans (2002), Koopmans & Treu (2003), Sand et al. (2004), Treu & Koopmans 2002; Koopmans & Treu 2003; Sand et al. 2004]). Nevertheless, [Dalal & Keeton (2003)] have criticised these results, arguing that the tight constraints claimed were driven by prior assumptions and that in general, more detailed modelling is required.
1.1 Arcs and Einstein rings: A history of the methodology
If the background source has extended structure, multiple arc images or Einstein rings are formed. In high–resolution data, the images comprise a large number of resolution elements. Extended sources therefore have the considerable advantage that they can provide many more constraints on the lens mass profile compared to images of point sources. A complete analysis of images of extended sources requires modelling of the source surface brightness distribution. The properties of both the source and the lens must be adjusted to give the best fit to the observed ring.
One approach to this problem, suggested by [Kayser & Schramm (1988)], uses the fact that regions of the source that are multiply–imaged have the same surface–brightness. For a trial mass distribution, the method traces image pixels to the source plane where the counts in different image pixels mapping to the same source pixel are compared. The solution for the mass is obtained by minimizing the dispersion in the image pixel counts for such multiply–imaged source pixels. [Kochanek et al. (1989)] successfully applied this approach to the inversion of the radio Einstein ring MG1131+0456. The algorithm was refined by [Wallington, Kochanek & Koo (1995)] who applied it to the triply–imaged giant arc in the galaxy cluster Cl 0024+1654.
The main shortcoming of this approach is that it does not deal with the image point spread function (PSF). If PSF smearing of the image (either instrumental or atmospheric) is significant, the light profile of the source is not correctly recovered by backward tracing the image, even if the mass distribution is exactly known. To deal with the PSF, a forward approach is needed i.e., one chooses a model for the source light profile (parameterised or pixelised), and a model for the mass (parameterised or pixelised), forms the image, convolves it with the PSF, and compares it to the actual image, adjusting the source and lens models to minimise a merit function e.g. .
An argument for choosing to parameterise rather than pixelise the source light profile is that it forces the solution to be smooth. Nevertheless, the source light profile may be complex, as in the cases of MG1131+0456 and Cl 0024+1654 cited previously. A large number of parameters might be required to provide a satisfactory description. Without clues to the character of the source it is extremely difficult to select the best parameterization i.e. the one which provides a satisfactory fit with the smallest number of parameters. In the most extreme example [Tyson, Kochanski & dell’Antonio (1998)] used 232 parameters to model the source light distribution of the galaxy lensed by the cluster Cl0024+1654.
If the source light profile is complex it is natural to consider pixelizing the source, i.e. the counts in each pixel is a free parameter. This removes the difficulty in finding a good parameterization for the source, and thereby avoids any bias in the fitted mass profile resulting from a poor choice. On the other hand, due to the deconvolution, and because the pixels are independent, the solution can be noisy. It is possible to achieve a smooth pixelised solution by adding a suitable ‘regularizing’ term to the merit function. [Wallington, Kochanek & Narayan (1996)] apply this approach to the case of the radio Einstein ring MG 1654+134. They use a maximum entropy approach i.e., the regularizing term to be minimised is the negative of the entropy.
[Warren & Dye (2003), Warren & Dye (2003; hereafter WD03)] introduced a new technique, which simplified and clarified the problem in a number of ways. Formally, the method is very similar to the maximum entropy method but WD03 showed that for a fixed lens mass distribution, the minimization of the merit function is a linear problem and as such can be solved by matrix inversion. This linear step is nested inside a usual minimisation over the non-linear parameter space of the lens model, hence the technique was called the ‘semi-linear method’. The advantages are that the total parameter space is much reduced, dramatically improving the speed of the minimisation and greatly easing location of the global minimum. WD03 also showed that the method vastly simplifies calculation of the source and lens uncertainties.
The semi-linear method has been applied to several systems to date ([Treu & Koopmans (2004), Treu et al. (2006), Koopmans et al. (2006), Treu & Koopmans 2004; Treu et al. 2006; Koopmans et al. 2006] – see next section). The method has also been enhanced by a number of authors. [Dye & Warren (2005), Dye & Warren (2005; hereafter DW05)] showed how the source plane can be adaptively gridded to minimise the covariance between pixels and maximise use of the information contained in the ring image. A Bayesian version of the semi-linear method was developed by [Suyu et al. (2006)]. The improvement this brings to the original method is that comparison of the fit given by different families of lens models is accomplished in a more rigorous fashion through the Bayesian evidence (see [MacKay (1992), MacKay 1992]). In addition, the Bayesian version determines the optimal level of regularisation. Another modification was made by [Dye et al. (2007), Dye et al. (2007; hereafter D07)] who showed how the method can be generalised to allow for multiple background sources, each at a different redshift. The most recent enhancement was by [Barnabè & Koopmans (2007)]. In this version, constraints provided by the ring image are combined with observed stellar velocity moments under a Bayesian framework to place even more stringent limits on the lens mass profile.
2 Recent studies
Adhering to the subject of this review, in this section we limit our discussion to recent studies of strong lensing by galaxies where the modelling accounts for the separate contribution of dark and baryonic matter. All studies mentioned here make the common assumption that the baryonic material follows the observed distribution of light and that this is embedded in a dark matter halo, typically modelled by a NFW or gNFW profile.
[Sand, Treu & Ellis (2002)] fitted the positions of the observed radial and tangential arcs with a dual component model for the brightest cluster galaxy in MS2137-23. The authors showed how the inclusion of extra constraints from the velocity dispersion profile allows much stronger limits to be placed on the inner slope and stellar mass. The claim was made that the cluster mass profile is completely inconsistent with CDM (see Figure 1), the halo having an inner slope of . The same method and conclusions were also reached by [Sand et al. (2004)]. These results were criticised by [Dalal & Keeton (2003)] who argued that the constraints were artificially tightened due to unrealistic assumptions regarding the galaxies’ sphericity and scale radius.

In a similar study, [Treu & Koopmans (2004)] modelled three strong galaxy lens systems with a dual component model as part of the Lensing and Stellar Dynamics project (LSD; [Koopmans & Treu (2002), Koopmans & Treu 2002]). This study included central velocity dispersions of the lens galaxies to tighten constraints on the modelling. A large scatter in the inner halo slope was found, with a mean value of . Similarly, the fraction of projected dark matter contained within the Einstein radius showed a large variation with values ranging between 0.37 and 0.72. A significant evolution of the band mass-to-light ratio (M/L) was found with a slope of (see Figure 4). This study also applied the semi-linear method, but only for the purpose of reconstructing the extended source in two of the systems (i.e., the method was not used to constrain the mass model).
The first full application of the semi-linear method was that of DW05 to the Einstein ring system 0047-2808. A summary of the results of this work are shown in Figure 2. The study concluded that a dual component model provides a better fit to the system than any of the common single component models, very strongly ruling out a model where the total mass follows the light. The best fit model comprised a baryonic component with a band M/L of accounting for of the projected mass within a mean ring radius of 1.16” (kpc. Deprojection gives a baryonic mass fraction of within in a spherical volume enclosed by this radius).

The analysis of DW05 was the first to constrain a stellar M/L from a pure lensing analysis. This was a demonstration of the improved constraints provided by all of the information contained in the ring image, rather than just the positions of the principle images or the ring radius. Panel (e) in Figure 2 compares the constraints on the inner halo slope and stellar M/L with those of [Koopmans & Treu (2003)] who used positional information only (shown as dashed lines).
The most recent application of the semi-linear method is that by D07 to the extraordinary Einstein ring system J21350102 (the ’Cosmic Eye’, [Smail et al. (2007), Smail et al. 2007]). The lens galaxy is an S0 at and produces the incredible ring image of a background Lyman break galaxy at shown in Figure 3. The ellipticity of the ring image is partly due to lensing by the foreground cluster MACS J2135.2-0102 lying approximately away to the south at . D07 modelled the system with a dual component lens, finding that the dark matter halo has an inner slope of , consistent with CDM simulations after allowing for baryon contraction. The baryonic component was found to have a mass-to-light ratio of M⊙/LB⊙ which when evolved to the present day is in agreement with local ellipticals (see Figure 4). Within the Einstein radius of (kpc), the baryons account for % of the total projected lens mass.

The Sloan Lensing ACS (SLACS) Survey ([Bolton et al. (2006), Bolton et al. 2006]) is a recently initiated HST snapshot imaging programme for new galaxy-scale strong gravitational lenses. The new lenses are identified in Sloan Digital Sky Survey (SDSS) spectra by having emission lines at redshifts much higher than the targeted galaxy. These are followed up with shallow, single-orbit images acquired with the ACS (now WFPC2). The survey is optimised for early type lens galaxies and because it draws from SDSS spectra, is biased towards relatively low redshift lenses (). SLACS is rapidly increasing the number of known strong galaxy lens systems with extended sources and at the time of writing, the project has accumulated around 80 lenses (see Koopmans et al., these proceedings).
[Bolton et al. (2006)] presented the first 19 newly detected SLACS lenses. The second SLACS paper by [Treu et al. (2006)] analysed the photometric properties and velocity dispersions of 15 of these and found that the galaxies are consistent with the parent SDSS sample but belong to a subset of bright (and high velocity dispersion) early types. Combined with the lens galaxies from the LSD project, the evolution in the band M/L was measured to be (see Figure 4). The findings of DW05 and D07 are completely consistent with this evolution (combining the data from these two studies with the LSD and SLACS data gives an overall evolution of ). [Treu et al. (2006)] concluded that this evolution is consistent with passive ageing of an old stellar population formed at and that no more than 10% of the stellar mass in these systems can have formed due to secondary star formation since .
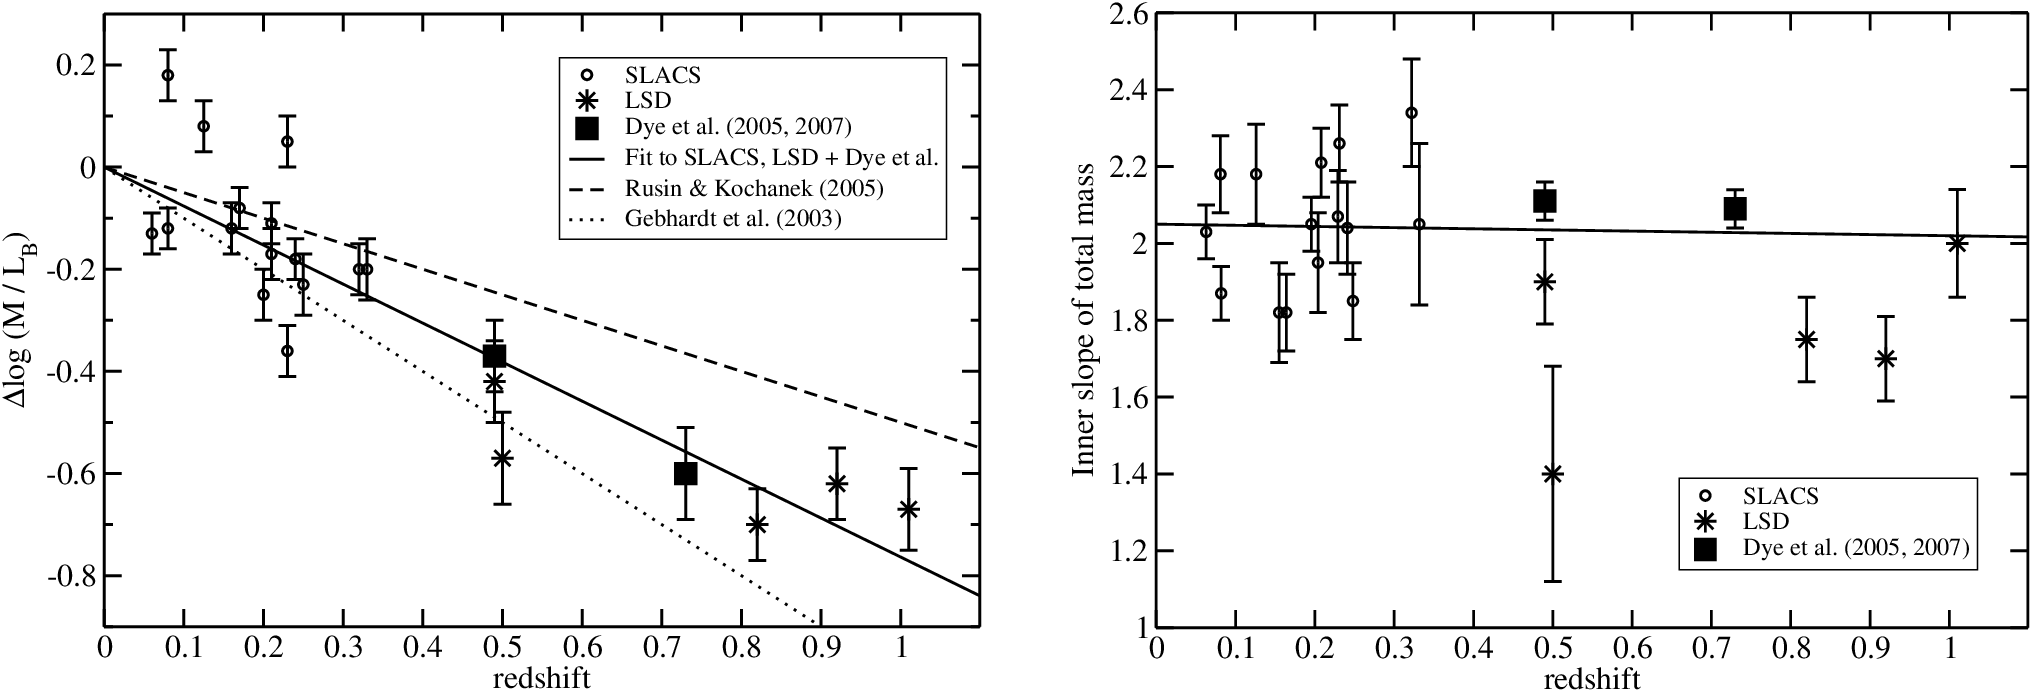
In the third SLACS paper, [Koopmans et al. (2006)] carried out a joint lensing and dynamics analysis of the same 15 strong lenses as [Treu et al. (2006)]. The work applied the semi-linear method to reconstruct source surface brightness profiles, but carried out a separate analysis, using only the central velocity dispersion and total mass within the Einstein radius to determine the slope of the total (i.e., dark and baryonic) density profile. Combined with the findings of the LSD project, the total slope was found to be non-evolving over the redshift interval (see Figure 4). Adding the total mass slopes found in DW05 and D07 to the LSD and SLACS data points gives an error weighted straight line fit of . Although at present the SLACS lenses lack sufficient spatial resolution in their kinematical data to enable measurement of the properties of just the halo component per galaxy, [Koopmans et al. (2006)] calculate an average projected dark matter fraction inside the Einstein radius of 0.25 with an rms of 0.22. This large scatter, which will inevitably also be seen in the inner halo slope, is surprising given the consistency of the total slope and its lack of evolution. The mechanisms driving this ’bulge halo conspiracy’ are currently very unclear.
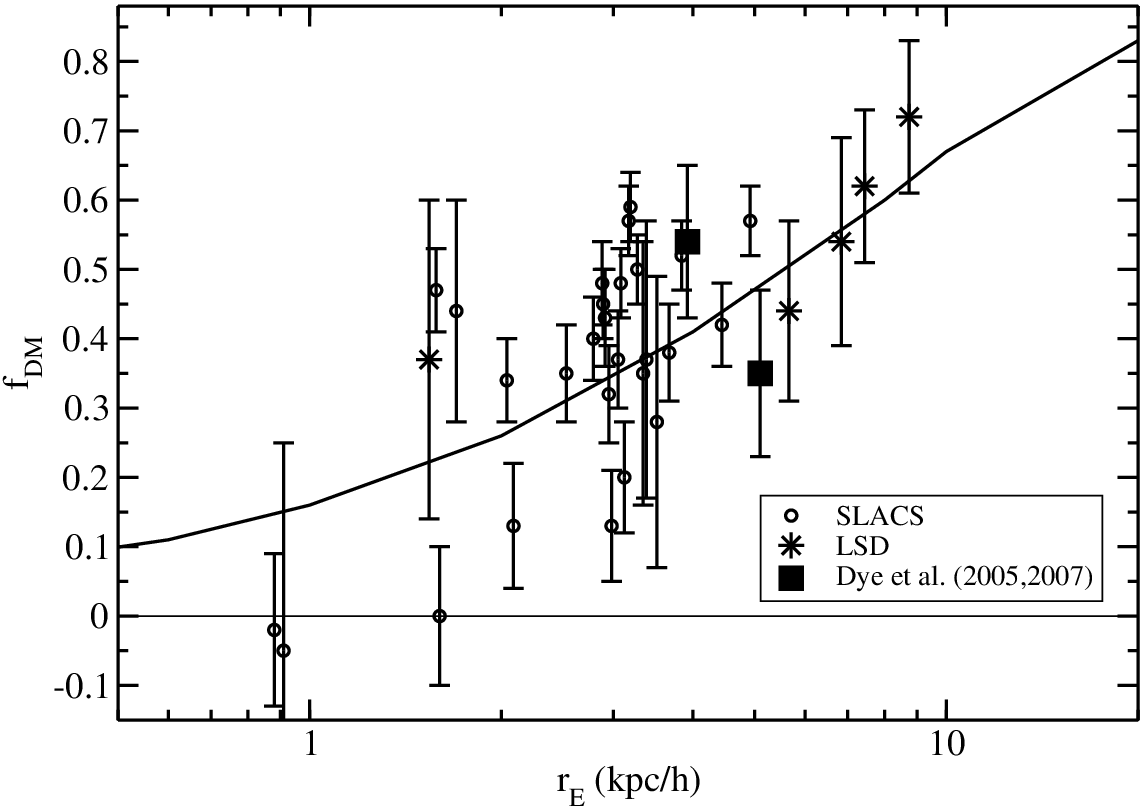
In the fourth and most recent SLACS paper, [Gavazzi et al. (2007)] have determined projected dark matter fractions within the Einstein radius per galaxy by combining the strong lensing analysis of the previous papers with weak lensing measurements. In Figure 5 we add the LSD lenses and those of DW05 and D07 to the SLACS lenses (including the new additions) of [Gavazzi et al. (2007)]. The figure shows that the larger and more distant lenses of LSD, DW05 and D07 are consistent with the average dark matter fractions of the more local SLACS lenses (shown by the continuous line).
[Koopmans et al. (2006)] note their intention to address the lack of spatial resolution in their dynamical observations of the SLACS lenses in future work. This should enable a full dual component lens analysis such that characteristics of the halo, in particular the inner slope, can be determined on a galaxy-by-galaxy basis. In this way, one would hope that insight into the bulge halo conspiracy could be gained. However, in order to fully establish the relationship between the morphology of the baryons and the morphology of the dark matter, its evolution must be properly explored. Here, the SLACS study with its relatively low redshift sample of lenses falls somewhat short and studies which concentrate on more detailed modelling of higher redshift systems (e.g., [Treu & Koopmans (2004), Treu & Koopmans 2004], [Dye & Warren (2005), Dye & Warren 2005], [Dye et al. (2007), Dye et al. 2007]) play a vital role.
We recently carried out ACS High Resolution Channel (HRC) imaging of three Einstein ring systems (HST proposal #10563). The lenses are early type galaxies spanning the redshift range . Our approach differs from the SLACS philosophy in two main ways. Firstly, we obtain deeper images (e.g., one of our lenses received 12 orbits of integration). In this way, we obtain a higher signal-to-noise thus being able to carry out more detailed modelling, placing stronger limits on lens parameters and being able to more strongly delineate between different lens models. Secondly, our imaging is carried out with the ACS’s higher resolution HRC, unlike SLACS which uses the Wide Field Camera (WFC) and now WFPC2. We have carried out simulations which show that despite the lower throughput of the HRC relative to the WFC, for the same number of orbits, the semi-linear method performs slightly better on HRC data than on WFC data in terms of both constraining the lens model and the source reconstruction. Analysis of these lenses is in progress and when finished will complement the SLACS project by adding to the number of higher redshift systems.
Acknowledgements.
SD is supported by PPARC. We thank Ian Smail, Mark Swinbank, Harald Ebeling and Alastair Edge for their crucial involvement in the work on the Cosmic Eye.References
- [Barnabè & Koopmans (2007)] Barnabè, M. & Koopmans, L. V. E., 2007, ApJ submitted, astro-ph/0701372
- [de Blok et al. (2001)] de Blok, W. J. G., McGaugh, S. S., Bosma, A., Rubin, V. C., 2001, ApJ, 552, 23
- [de Blok & Bosma (2002)] de Blok, W. J. G., Bosma, A., 2002, A&A, 385, 816
- [de Blok (2005)] de Blok, W. J. G., 2005, ApJ, 634, 227
- [Blumenthal et al. (1986)] Blumenthal, G.R., Faber, S.M, Flores, R., Primack, J.R., 1986, ApJ, 301, 27
- [Bolton et al. (2006)] Bolton, A. S., Burles, S., Koopmans, L. V. E., Treu, T., Moustakas, L. A., 2006, ApJ, 638, 703
- [Diemand et al. (2005)] Diemand, J., Zemp, M., Moore, B., Stadel, J., Carollo, C. M., 2005, MNRAS, 364, 665
- [Dalal & Keeton (2003)] Dalal, N. & Keeton, C.R., 2003, astro-ph/0312072
- [Dye et al. (2007)] Dye, S., Smail, I., Swinbank, A. M., Ebeling, H., Edge, A. C., 2007, MNRAS, 379, 308, (D07)
- [Dye & Warren (2005)] Dye, S. & Warren, S. J., 2005, ApJ, 623, 31, (DW05)
- [Gavazzi et al. (2007)] Gavazzi, R., Treu, T., Rhodes, J. D., Koopmans, L. V. E., Bolton, A. S., Burles, S., Massey, R. J., Moustakas, L. A., 2007, ApJ, in press, astro-ph/0701589
- [Gebhardt et al. (2003)] Gebhardt, K., et al., 2003, ApJ, 597, 239
- [Gnedin et al. (2004)] Gnedin, O. Y., Kravtsov, A. V., Klypin A. A., Nagai, D., 2004, ApJ, 616, 16
- [Hayashi et al. (2004)] Hayashi, E., Navarro, J. F., Power, C., Jenkins, A., Frenk, C. S., White, S. D. M., Springel, V., Stadel, J., Quinn, T. R., 2004, MNRAS, 355, 794
- [Hayashi & Navarro (2006)] Hayashi, E. & Navarro, J. F., 2006, MNRAS, 373, 1117
- [Kayser & Schramm (1988)] Kayser, R. & Schramm, T., 1988, A&A, 191, 39
- [Kochanek et al. (1989)] Kochanek, C.S., Blandford R.D., Lawrence C.R., & Narayan, R., 1989, MNRAS, 238, 43
- [Koopmans & Treu (2002)] Koopmans, L.V.E. & Treu, T., 2002, ApJ, 568, L5
- [Koopmans & Treu (2003)] Koopmans, L.V.E. & Treu, T., 2003, ApJ, 583, 606
- [Koopmans et al. (2006)] Koopmans, L.V.E., Treu, T., Bolton, A. S., Burles, S., Moustakas, L. A., 2006, ApJ, 640, 662
- [MacKay (1992)] MacKay, D. J. C., 1992, Neural Computation, 4, 415
- [Moore et al. (1998)] Moore, B., Governato, F., Quinn, T., Stadel, J., Lake, G., 1998, Apj, 499, L5
- [Moore et al. (1999)] Moore, B., Quinn, T., Governato, F., Stadel, J., Lake, G., 1999, MNRAS, 310, 1147
- [Navarro et al. (2004)] Navarro, J. F., Hayashi, E., Power, C., Jenkins, A., Frenk, C. S., White, S. D. M., Springel, V., Stadel, J., Quinn, T. R., 2004, MNRAS, 349, 1039
- [Navarro, Frenk & White (1996)] Navarro, J. F., Frenk, C. S. & White S. D. M., 1996, ApJ, 462, 563
- [Rusin & Kochanek (2005)] Rusin, D. & Kochanek, C. S., 2005, ApJ, 623, 666
- [Saha & Williams (1997)] Saha, P., Williams, L. L. R., 1997, MNRAS, 292, 148
- [Saha, Williams & Ferreras (2007)] Saha, P., Williams, L. L. R. & Ferreras, I., 2007, ApJ, 663, 29
- [Sand et al. (2004)] Sand, D. J., Treu, T., Smith, G. P., Ellis, R. S., 2004, ApJ, 604, 88
- [Sand, Treu & Ellis (2002)] Sand, D. J., Treu, T., & Ellis, R. S., 2002, ApJ, 574, L129
- [Schneider, Kochanek & Wambsganss (2006)] Schneider, P., Kochanek, C. S. & Wambsganss, J., 2004, Part 2 of Gravitational Lensing: Strong, Weak & Micro, Proceedings of the 33rd Saas-Fee Advanced Course, (eds. G. Meylan, P. Jetzer & P. North)
- [Smail et al. (2007)] Smail, I., Swinbank, A. M., Richard, J., Ebeling, H., Kneib, J. -P., Edge, A. C., Stark, D., Ellis, R. S., Dye, S., Smith, G. P., Mullis, C., 2007, ApJ, 654, 33
- [Spekkens & Giovanelli (2005)] Spekkens, K., Giovanelli, R. & Haynes, M. P., 2005, AJ, 129, 2119
- [Suyu et al. (2006)] Suyu, S. H., Marshall, P. J., Hobson, M. P., Blandford, R. D., 2006, MNRAS, 371, 983
- [Swaters et al. (2003)] Swaters, R.A., Madore, B.F., van den Bosch, F. C., Balcells, M., 2003, ApJ, 583, 732
- [Treu & Koopmans (2002)] Treu, T. & Koopmans, L. V. E., 2002, ApJ, 575, 87
- [Treu & Koopmans (2004)] Treu, T. & Koopmans, L. V. E., 2004, ApJ, 611, 739
- [Treu et al. (2006)] Treu, T., Koopmans, L. V. E., Bolton, A. S., Burles, S., Moustakas, L. A., 2006, ApJ, 640, 662
- [Tyson, Kochanski & dell’Antonio (1998)] Tyson, J.A., Kochanski, G.P., & dell’Antonio, I.P., 1998, ApJ, 498, 107
- [Wallington, Kochanek & Koo (1995)] Wallington, S., Kochanek, C. S., & Koo, D., 1995, ApJ, 441, 58
- [Wallington, Kochanek & Narayan (1996)] Wallington, S., Kochanek, C. S., & Narayan, R., 1996, ApJ, 465, 64
- [Warren & Dye (2003)] Warren, S. J. & Dye, S., 2003, ApJ, 590, 673, (WD03)