Simulating cosmic rays in clusters of galaxies – III. Non-thermal scaling relations and comparison to observationsSimulating cosmic rays in clusters of galaxies – III. Non-thermal scaling relations and comparison to observations–A2003
Abstract
Complementary views of galaxy clusters in the radio synchrotron, hard X-ray inverse Compton, and high-energy -ray regimes are critical in calibrating them as high-precision cosmological probes. We present predictions for scaling relations between cluster mass and these non-thermal observables. To this end, we use high-resolution simulations of a sample of galaxy clusters spanning a mass range of almost two orders of magnitudes, and follow self-consistent cosmic ray physics on top of the radiative hydrodynamics. We model relativistic electrons that are accelerated at cosmological structure formation shocks and those that are produced in hadronic interactions of cosmic rays with ambient gas protons. Calibrating the magnetic fields of our model with Faraday rotation measurements, the synchrotron emission of our relativistic electron populations matches the radio synchrotron luminosities and morphologies of observed giant radio halos and mini-halos surprisingly well. Using the complete sample of the brightest X-ray clusters observed by ROSAT in combination with our -ray scaling relation, we predict GLAST that will detect about ten clusters allowing for Eddington bias due to the scatter in the scaling relation. The expected brightest -ray clusters are Ophiuchus, Fornax, Coma, A3627, Perseus, and Centaurus. The high-energy -ray emission above 100 MeV is dominated by pion decays resulting from hadronic cosmic ray interactions. We provide an absolute lower flux limit for the -ray emission of Coma in the hadronic model which can be made tighter for magnetic field values derived from rotation measurements to match the GLAST sensitivity, providing thus a unique test for the possible hadronic origin of radio halos. Our predicted hard X-ray emission, due to inverse Compton emission of shock accelerated and hadronically produced relativistic electrons, falls short of the detections in Coma and Perseus by a factor of 50. This casts doubts on inverse Compton interpretation and reinforces the known discrepancy of magnetic field estimates from Faraday rotation measurements and those obtained by combining synchrotron and inverse Compton emission.
Keywords:
galaxies: cluster: general, cosmic rays, magnetic fields, radiation mechanisms: non-thermal1 Introduction
Previously, it has been assumed that galaxy clusters are sufficiently well described by their mass which was thought to be largely independent of the complex astrophysical processes taking place in the intra-cluster medium (ICM) such as star formation and different kinds of feedback processes. High-resolution XMM-Newton and Chandra X-ray observations taught us in the last years that this over-simplified paradigm needs to be modified. Even ostensibly ‘relaxed’ clusters reveal a richness of substructure with substantial small-scale variation in temperature, metallicity, and surface brightness.
This raises the question if high-precision cosmology will principally be possible using clusters. Clearly, we need to understand how non-equilibrium processes that lead to cosmic ray populations and turbulence impact on the thermal X-ray emission and Sunyaev-Zel’dovich effect. This forces us to explore complementary observational windows to clusters such as non-thermal emission that can potentially elucidate the otherwise invisible non-equilibrium processes. The upcoming generation of low-frequency radio, hard X-ray, and -ray instruments open up the extragalactic sky in unexplored wavelength ranges (cf. Pfrommer et al. 2007b, for a compilation of these experiments). Suitably combining radio synchrotron radiation, inverse Compton emission in the hard X-ray regime, and high-energy -ray emission will enable us to estimate the cosmic ray pressure contribution and provide us with clues to the dynamical state of a cluster. This will allow us to construct a ‘gold sample’ for cosmology using information on the dynamical cluster activity that is orthogonal to the thermal cluster observables. Additionally, these non-thermal observations have the potential to improve our knowledge of diffusive shock acceleration, large scale magnetic fields, and turbulence.
Of the possible non-thermal emission bands, only the diffuse large-scale radio synchrotron emission of clusters has been unambiguously detected so far. Generally these radio phenomena can be divided into two categories that differ morphologically, in their degree of polarisation, as well as in their characteristic emission regions with respect to the cluster halo. The large-scale ‘radio relic’ or ‘radio gischt’ emission (Kempner et al. 2004), that has a high degree of polarisation, is irregularly shaped and occurs at peripheral cluster regions, can be attributed to merging or accretion shock waves as proposed by Ensslin et al. 1998. Prominent examples for large scale ‘radio relic’ emission have been observed in Abell 3667 (Röttgering et al. 1997), Abell 3376 (Bagchi et al. 2006), and Abell 2256 (Clarke & Enßlin 2006). In contrast, ‘cluster radio halos’ show a coherently large diffuse radio emission that is centred on the cluster, resemble the underlying thermal bremsstrahlung emission in X-rays, are unpolarised, and show spectral index variations that are amplified in the peripheral regions of the extended radio emitting regions. These radio halo phenomena can be furthermore subdivided into Mpc-sized ‘giant radio halos’ that are associated with merging clusters and ‘radio mini-halos’ that are observed in a few cool core clusters and have a smaller extent of a few hundreds of kpc. Prominent examples for ‘giant radio halos’ can be obtained from Giovannini et al. 1999 and include the Coma cluster (Kim et al. 1989; Deiss et al. 1997) and the galaxy cluster 1E 0657-56 (Liang et al. 2000). Prominent ‘radio mini halos’ are observed in the Perseus cluster (Pedlar et al. 1990) or in RX J1347.5-1145 (Gitti et al. 2007).
Previously, there have been two models suggested that are able to explain ‘cluster radio halos’. (1) Re-acceleration processes of ‘mildly’ relativistic electrons () that are being injected over cosmological timescales into the ICM by sources like radio galaxies, merger shocks, or galactic winds can provide an efficient supply of highly-energetic relativistic electrons. Owing to their long lifetimes of a few times years these ‘mildly’ relativistic electrons can accumulate within the ICM (Sarazin 2002), until they experience continuous in-situ acceleration either via interactions with magneto-hydrodynamic waves, or through turbulent spectra (Jaffe 1977; Schlickeiser et al. 1987; Brunetti et al. 2001; Ohno et al. 2002; Brunetti et al. 2004; Gitti et al. 2004; Brunetti & Lazarian 2007). (2) Hadronic interactions of relativistic protons with ambient gas protons produce pions which decay successively into secondary electrons, neutrinos and -rays. These secondary relativistic electrons and positrons can emit a halo of radio synchrotron emission in the presence of ubiquitous intra-cluster magnetic fields (Dennison 1980; Vestrand 1982; Blasi & Colafrancesco 1999; Dolag & Enßlin 2000; Miniati et al. 2001b; Pfrommer & Enßlin 2003; Pfrommer & Enßlin 2004a; Pfrommer & Enßlin 2004b) as well as inverse Compton emission by scattering photons from the cosmic microwave background into the hard X-ray and -regime. In our companion paper (Pfrommer et al. 2007b, hereafter Paper II), we suggest a modification of the latter model that is motivated by our high-resolution cluster simulations and cures the weaknesses of the original model. We find, that our simulated giant radio halos are dominated in the centre by secondary synchrotron emission with a transition to the radio synchrotron radiation emitted from shock-accelerated electrons in the cluster periphery. This explains the extended radio emission found in merging clusters, while it is more centrally concentrated in relaxed cool core clusters. Varying spectral index distributions preferably in the cluster periphery (Feretti et al. 2004) support this picture. The characterisation of quantities related to cosmic rays in clusters can be found in our first companion paper that studies the interplay of thermal gas and cosmic rays and their effect on thermal cluster observables such as X-ray emission and the Sunyaev-Zel’dovich effect (Pfrommer et al. 2007a, hereafter Paper I).
The outline of the paper is as follows. Section 2 describes our general methodology, presents our cluster sample, and the different simulated physical processes. In Sect. 3, we present the results on the cluster scaling relations for non-thermal observables as well as -ray flux and luminosity functions. These are compared to observations and finally critically discussed in Sect. 4.
2 Methodology
2.1 General procedure
We have performed high-resolution hydrodynamic simulations of the formation of 14 galaxy clusters. The clusters span a mass range from to and show a variety of dynamical states ranging from relaxed cool core clusters to violent merging clusters (cf. Table 1). Our simulations dynamically evolve dissipative gas physics including radiative cooling, star formation, and supernova feedback. We identify the strength of structure formation shock waves on-the-fly in our simulations and measure the shock Mach number that is defined by the ratio of shock velocity to pre-shock sound velocity, (Pfrommer et al. 2006). On top of this, we self-consistently follow cosmic ray (CR) physics including adiabatic CR transport processes, injection by supernovae and cosmological structure formation shocks, as well as CR thermalization by Coulomb interaction and catastrophic losses by hadronic interactions (Enßlin et al. 2007; Jubelgas et al. 2007). In our post-processing, we model relativistic electrons that are accelerated at cosmological structure formation shocks and those that are produced in hadronic interactions of cosmic rays with ambient gas protons. This approach is justified since these electrons do not modify the hydrodynamics of the gas owing to their negligible pressure contribution. We compute the stationary relativistic electron spectrum that is obtained by balancing the mentioned injection mechanisms with the synchrotron and inverse Compton cooling processes. Details of our modelling can be found in 57. Both populations of relativistic electrons emit a morphologically distinguishable radio synchrotron radiation as well as inverse Compton emission due to up-scattering of photons of the cosmic microwave background (CMB) into the hard X-ray and -ray regime. At energies larger than MeV, we expect additionally -ray emission from decaying pions that are produced in hadronic CR interactions. While the emission of the shock accelerated primary electrons is amorphous and peripheral as observed in radio relics, the hadronically produced secondary electrons show a centrally concentrated emission characteristic that resembles that of the central parts of observed radio halos.
In this paper, we concentrate on three observationally motivated wave-bands. (1) Radio synchrotron emission at GHz, (2) non-thermal hard X-ray emission at energies keV, and (3) -ray emission at energies MeV. We study the contribution of the different emission components to the total cluster luminosity in each of these bands, derive cluster scaling relations, and study their dependence on the simulated physics and adopted parametrisation of the magnetic field. The radio synchrotron scaling relation is then compared to the observed sample of giant radio halos and radio mini-halos. Using cluster masses from the complete sample of the X-ray brightest clusters (HIFLUGCS, the HIghest X-ray FLUx Galaxy Cluster Sample, Reiprich & Böhringer 2002), we construct luminosity and flux functions for the hard X-ray and -ray band. This allows us to identify the brightest clusters in the hard X-ray and -ray sky and predict the cluster sample to be seen by GLAST.
2.2 Adopted cosmology and cluster sample
We provide only a short overview over the simulations and our cluster sample for completeness while the simulation details can be found in 57. Simulations were performed using the ‘concordance’ cosmological cold dark matter model with a cosmological constant (CDM). The cosmological parameters of our model are: , , , , , and . Here, denotes the total matter density in units of the critical density for geometrical closure today, . and denote the densities of baryons and the cosmological constant at the present day. The Hubble constant at the present day is parametrised as , while denotes the spectral index of the primordial power-spectrum, and is the rms linear mass fluctuation within a sphere of radius Mpc extrapolated to .
| Cluster | sim.’s | dyn. state(1) | |||
|---|---|---|---|---|---|
| [] | [Mpc] | [keV] | |||
| 1 | g8a | CC | 2.0 | 13.1 | |
| 2 | g1a | CC | 1.8 | 10.6 | |
| 3 | g72a | PostM | 1.7 | 9.4 | |
| 4 | g51 | CC | 1.7 | 9.4 | |
| 5 | g1b | M | 1.2 | 4.7 | |
| 6 | g72b | M | 0.87 | 2.4 | |
| 7 | g1c | M | 0.84 | 2.3 | |
| 8 | g8b | M | 0.76 | 1.9 | |
| 9 | g1d | M | 0.73 | 1.7 | |
| 10 | g676 | CC | 0.72 | 1.7 | |
| 11 | g914 | CC | 0.71 | 1.6 | |
| 12 | g1e | M | 0.65 | 1.3 | |
| 13 | g8c | M | 0.63 | 1.3 | |
| 14 | g8d | PreM | 0.61 | 1.2 |
Notes:
(1) The dynamical state has been classified through a combined criterion invoking a merger tree study and the visual inspection of the X-ray brightness maps. The labels for the clusters are M–merger, PostM–post merger (slightly elongated X-ray contours, weak cool core region developing), PreM–pre-merger (sub-cluster already within the virial radius), CC–cool core cluster with extended cooling region (smooth X-ray profile).
(2) The virial mass and radius are related by , where denotes a multiple of the critical overdensity .
(3) The virial temperature is defined by , where denotes the mean molecular weight.
We analysed the clusters with a halo-finder based on spherical overdensity followed by a merger tree analysis in order to get the mass accretion history of the main progenitor. We also produced projections of the X-ray emissivity at redshift in order to get a visual impression of the cluster morphology. The dynamical state of a cluster is defined by a combined criterion: (i) if the cluster did not experience a major merger with a progenitor mass ratio 1:3 or larger after (corresponding to a look-back time of Gyr) and (ii) if the visual impression of the cluster’s X-ray morphology is relaxed, it was defined to be a cool core cluster. The spherical overdensity definition of the virial mass of the cluster is given by the material lying within a sphere centred on a local density maximum, whose radial extend is defined by the enclosed threshold density condition . We chose the threshold density to be a multiple of the critical density of the universe . We assume a constant although some treatments employ a time-varying in cosmologies with (Eke et al. 1996). In the reminder of the paper, we use the terminology instead of .
2.3 The models
| Simulated physics(1) | simulation models(1): | ||||
| S1 | S2 | S3 | |||
| thermal shock heating | ✓ | ✓ | ✓ | ||
| radiative cooling | ✓ | ✓ | |||
| star formation | ✓ | ✓ | |||
| Coulomb CR losses | ✓ | ✓ | ✓ | ||
| hadronic CR losses | ✓ | ✓ | ✓ | ||
| shock-CRs | ✓ | ✓ | ✓ | ||
| supernova-CRs | ✓ | ||||
Notes:
(1) This table serves as an overview over our simulated models. The first column shows the simulated physics and the following three columns show our different simulation models with varying gas and cosmic ray physics. Model S1 models the thermal gas non-radiatively and includes CR physics, while the models S2 and S3 use radiative gas physics with different variants of CR physics.
For each galaxy cluster we ran three different simulations with varying gas and cosmic ray physics (cf. Table 2). The first set of simulations used non-radiative gas physics only, i.e. the gas is transported adiabatically unless it experiences structure formation shock waves that supply the gas with entropy and thermal pressure support. Additionally we follow cosmic ray (CR) physics including adiabatic CR transport processes, injection by cosmological structure formation shocks with a Mach number dependent acceleration scheme, as well as CR thermalization by Coulomb interaction and catastrophic losses by hadronic interactions (model S1). The second set of simulations follows the radiative cooling of the gas, star formation, supernova feedback, and a photo-ionising background (58, details can be found in). As before in model S1, we account for CR acceleration at structure formation shocks and allow for all CR loss processes (model S2). The last set of simulations additionally assumes that a constant fraction of the kinetic energy of a supernova ends up in the CR population (model S3), which is motivated by TeV -ray observations of a supernova remnant that find an energy fraction of when extrapolating the CR distribution function (Aharonian et al. 2006). We choose a maximum value for this supernova energy efficiency owing to the large uncertainties and our aim to bracket the realistic case with the two radiative CR simulations.
Since we have not run self-consistent magneto-hydrodynamical (MHD) simulations on top of the radiative gas and CR physics, we chose the following model for the magnetic energy density to compute the synchrotron and inverse Compton (IC) emission:
| (1) |
where the central magnetic energy density and are free parameters in our model, and denotes the thermal energy density at the cluster centre. Rather than applying a scaling with the gas density as non-radiative MHD simulations by Dolag et al. 1999; Dolag et al. 2001 suggest, we chose the energy density of the thermal gas. This quantity is well behaved in the centres of clusters where current cosmological radiative simulations, that do not include radio-mode feedback from AGN, have an over-cooling problem which results in an overproduction of the amount of stars, enhanced central gas densities, too small central temperatures, and too strong central entropy plateaus compared to X-ray observations. Theoretically, the growth of magnetic field strength is determined through turbulent dynamo processes that will saturate on a level which is determined by the strength of the magnetic back-reaction (Subramanian 2003; Schekochihin & Cowley 2006, e.g.,) and is typically a fraction of the turbulent energy density that itself should be related to the thermal energy density, thus motivating our model theoretically.
3 Results
3.1 Radio synchrotron emission
3.1.1 Simulated synchrotron scaling relations
Synchrotron emission ( GHz):

In order to determine the cluster scaling relations for non-thermal observables, we integrate the total surface brightness (composed of primary and secondary emission components) within the virial radius of each cluster. In our radiative simulations, we cut the region with around the brightest central point-source that is caused by over-cooling gas of the cD galaxy. Since the modelled non-thermal emission processes reflect active non-equilibrium structure formation processes, we expect a large scatter in these scaling relations. Ideally, we would like to have a large sample of independent clusters to obtain reliable measurements of the scaling parameters. Thus, our limited sample will have larger uncertainties in the derived parameters. Figure 1 shows our simulated synchrotron scaling relations at GHz using the total radio synchrotron luminosity within of all clusters. We note that the radio emission volume is significantly enlarged for our merging clusters mostly due to the larger contribution of primary radio emission in the cluster outskirts (57). To simplify comparison with observed giant radio halo samples, we additionally fit radio synchrotron scaling relations for our subsample of eight merging clusters. The fit parameters for our models with varying simulated physics and magnetic parameters can be found in Table 3. The following conclusions can be drawn.
| radio synchrotron: | IC ( keV): | -rays ( MeV): | ||||||||
|---|---|---|---|---|---|---|---|---|---|---|
| all clusters | merging clusters | |||||||||
| model(2) | ||||||||||
| S1(2) | 10 | 0.5 | ||||||||
| S2(2) | 10 | 0.5 | ||||||||
| S2(2) | 10 | 0.25 | ||||||||
| S1(2) | 3 | 0.5 | ||||||||
| S2(2) | 3 | 0.5 | ||||||||
| S2(2) | 3 | 0.25 | ||||||||
| S3(2) | 10 | 0.5 | ||||||||
Notes:
(1) The cluster scaling relations for non-thermal observables are defined by , where and the respective non-thermal luminosity is obtained by integrating over the virial region of the cluster within and applying a central cut around the brightest central point-source for radii .
(2) The definition for our different models can be found in Table 2.
(3) The definition for the parametrisation of the magnetic energy density is given by according to (1) and is given in units of G.
(4) The normalisation of the radio synchrotron scaling relations is given in units of .
(5) The normalisation of the IC scaling relations ( keV) is given in units of .
(6) The normalisation of the -ray scaling relations ( MeV) is given in units of .
Contributions of different emission components. (1) The secondary emission component is dominant for relaxing cool core (CC) clusters, and those that only experience a minor merger. The primary component exceeds the secondary one for major merging clusters by a factor of four as can be seen in our large post-merging cluster g72a with . (2) The secondary radio emission is remarkably similar for our massive clusters while the scatter of the secondary emission increases notably for our small clusters with . This is due to the property of the hierarchical scenario of cluster formation which implies that virtually every large cluster is formed through a series of mergers of smaller progenitors. Each of these merging events triggered violent shock waves that accelerated CR protons through diffusive shock acceleration. Over its cosmic history, these CRs accumulated within the cluster volume due to their cooling time being longer than the Hubble time (Völk et al. 1996; Berezinsky et al. 1997). The secondary radio emission probes the CR proton pressure which traces the time integrated non-equilibrium activities of clusters and is only modulated by the recent dynamical activities (see also 58, for average values of the relative CR energy in different dynamical cluster environments). In our less massive clusters, the larger scatter of the secondary emission level is due to the larger variation of merging histories of these clusters and their weaker gravitational potential. This leads to a larger modulation of the CR pressure and reflects more sensitively the current merging activity of the cluster than it is the case in large systems. (3) In contrast to the secondary emission, the pressure of primary CR electrons sensitively resembles the current dynamical, non-equilibrium activity of forming structure and results in an inhomogeneous and aspherical spatial distribution with respect to collapsed objects. This leads to a large cluster-to-cluster variation of the primary radio emission.
Normalisation: (1) The normalisation of the non-thermal scaling relations depends only weakly on whether radiative or non-radiative gas physics is simulated provided we consider in both cases only CRs from structure formation shocks. As discussed in 57, this is mainly due to self-regulated effects of the CR pressure. The CR cooling timescales due to Coulomb and hadronic interactions of CRs, , adjust to different density levels in our simulations with radiative or non-radiative gas physics. Given a similar CR injection, this implies a higher CR number density for a smaller gas density . The secondary CR emissivities (synchrotron, IC, or pion decay) scale as and remain almost invariant with respect to different gas densities. (2) In contrast, the normalisation sensitively depends on the assumptions and parametrisation of the magnetic field. This clearly shows the need to understand observationally how the properties of large scale cluster magnetic fields vary with cluster mass and dynamical state.
Slope: (1) The slope of the radio synchrotron scaling relations for our merging cluster sample is largely independent of the simulated physics or the parameters of our magnetic field if we only consider CRs from structure formation shocks (models S1 and S2). The scaling relation is close to (details can be found in Tab. 3). The slope decreases to if we additionally account for CRs from SNe feedback within galaxies. (2) If we consider all radio emitting clusters, i.e. we also account for radio-mini halos, the slope flattens in our radiative simulations by . As a caveat, our scaling relations assume the same parametrisation of the magnetic field for all clusters. If the central magnetic field scales with the cluster mass, the slopes will be accordingly steeper. Additionally, this self-similarity could be broken in the radio synchrotron scaling relations, once magnetic field are dynamically simulated and respond to the dynamical state of a cluster.
Scatter: In our non-radiative simulations, the scatter in the radio synchrotron scaling relations is much smaller than in our radiative ones. There are no CC clusters in our non-radiative simulations by definition. If a merger takes place, there are stronger shock waves in our radiative simulations due to the slightly cooler temperatures that imply smaller sound velocities and larger Mach numbers. Thus, the difference between relaxed and merging cluster is more pronounced in our radiative simulations.
3.1.2 Comparison to observations
The observed sample of giant cluster radio halos (Cassano et al. 2006) and that for cluster radio mini-halos (Gitti et al. 2004) is compared to our simulated scaling relations.
Radio luminosity: Generally, our simulated giant cluster radio halos show the same level of radio synchrotron emission as observed ones given a model of the magnetic field that is supported by Faraday rotation observations (Carilli & Taylor 2002; Widrow 2002; Govoni & Feretti 2004, and references therein).
Cluster magnetic fields: The radio synchrotron emissivity scales as
| (2) |
where and denote the energy densities of CR electrons and magnetic fields, respectively, and the synchrotron spectral index is related to the spectral index of the injected electron population as well as to that of the cooled electron population . Typical synchrotron spectral indices of cluster halos and relics span a range of . This implies a similar contribution to the radio luminosity-mass scaling relation of clusters from the energy density of CR electrons and that of magnetic fields. Our radio synchrotron scaling relations assume the same physical model for the magnetic field irrespective of cluster mass and dynamical state. Conversely, we can interpret our simulated synchrotron scaling relations as tracks in the radio luminosity-cluster mass plane which are labelled with a set of parameters of our magnetic model such as central magnetic field and magnetic decline. Radio mini-halos tend to have a higher radio luminosity compared to the giant radio halos. This hints towards a larger central magnetic field of the order of G in these relaxed cool core clusters compared to the apparently preferred weaker central field strength of the order of G in merging systems. Interestingly, this characteristics of cluster magnetic fields is also consistent with Faraday rotation measurements (Vogt & Enßlin 2005, and references therein). Radio mini halos have been rarely observed in relaxed cool core clusters. This might be partly due to the strong radio emitting AGN at the centres of cool core clusters which implies a large dynamic flux range to the underlying diffuse radio mini-halo and makes them very challenging to observe.
Correlation between radio halos and mergers: How do our simulations support the observed radio halo-merger correlation? (1) The radio emission from primary, shock-accelerated electrons can boost the total radio emission of a major merging clusters by a factor of four (cf. our massive post-merging cluster g72a). This factor sensitively depends on the mass ratio, geometry, and the advanced state of the merger. (2) In cool core as well as in merging clusters, the central radio emission is dominated by synchrotron emission from hadronically generated electrons. In 57, we show that the emission size of the simulated giant radio halos is increased due to the complex network of virializing shock waves in the cluster periphery that are able to efficiently accelerate CR electrons and amplify the magnetic fields due to strong shear motions. (3) The relative CR pressure is modulated by current merger activity of a cluster. While this positive modulation is small in massive systems, it can be substantial for less massive systems as can be inferred from Fig. 1. This is due to larger variation of merging histories and the smaller gravitational potential in small clusters that causes the radio emission to respond more sensitively to merging activity.
Observed scatter: The merger causes clusters that are hosting a giant radio halo to depart from hydrostatic equilibrium and leads to a complicated morphology that in general is not spherical. As a result, the masses in merging clusters can be either over- or underestimated, depending on the amount of turbulent pressure support, the presence of shocks, and the amount of substructure which tends to flatten the average density profile (Evrard et al. 1996; Roettiger et al. 1996; Schindler 2002). The sample of observed giant radio halos of Cassano et al. 2006 scatters by two orders of magnitude in synchrotron luminosity while the virial masses of the hosting clusters only spans a factor of three. Barring observational uncertainties, the large range of dynamical states and merger geometries among clusters as well as the variation of the magnetic properties such as central field strength and magnetic decline furthermore contribute to the scatter in the scaling relations. The small sample size in combination with the mentioned uncertainties make it impossible to determine a reliable observational synchrotron scaling relation for radio halos. Thus, the simulated scaling relations can only be compared to the total luminosity of the observed clusters. Studies of radio synchrotron emission from clusters should be complemented by studies of the pixel-to-pixel correlation of the synchrotron and X-ray surface brightness (Govoni et al. 2001; Pfrommer et al. 2007b).
3.2 Inverse Compton and pion decay induced -ray emission
In contrast to the observed diffuse radio synchrotron emission from clusters, -rays from clusters have not been detected yet (Reimer et al. 2003). In principle, inverse Compton and pion decay induced -ray emission are the cleanest way of probing structure formation shock waves and the accelerated CR electron and proton populations since these non-thermal emission processes are not weighted with the magnetic energy density as it is the case for synchrotron emission.
3.2.1 Inverse Compton and -ray cluster scaling relations
IC emission ( keV):
-ray emission ( MeV):


We determine the cluster scaling relations for the non-thermal -ray luminosities as before in Sect. 3.1.1. Figure 2 shows our simulated IC and pion decay scaling relations. The fit parameters for our models with varying simulated physics and magnetic parameters can be found in Table 3.
Contributions of different emission components: In the IC scaling relations ( keV), we see a similar picture as we found for the radio synchrotron scaling relations, albeit somewhat amplified since the weighting with the magnetic energy density is negligible at these energy bands. The secondary emission component is dominant for relaxing CC clusters, and those, that only experience a minor merger. The primary component exceeds the secondary one for major merging clusters. In the -ray scaling relations ( MeV), the pion decay component is always dominant over the primary and secondary IC emission components. This finding does only weakly depend on the assumed spectral index for the CR proton distribution function since the energy band MeV is dominated by the peak of the pion bump that is produced by GeV-protons (Pfrommer & Enßlin 2004a).
Normalisation: (1) The normalisation of the non-thermal scaling relations depends only weakly on whether radiative or non-radiative gas physics is simulated provided we consider in both cases only CRs from structure formation shocks. As previously discussed (cf. Sect. 3.1.1), this is mainly due to self-regulated effects of the CR pressure due to CR cooling mechanisms. (2) If we additionally account for CRs from SNe feedback within galaxies, the normalisation increases due to the second source of CR injection. This increase is higher for our -ray scaling relations which are completely dominated by the pion decay emission component. To which extend CRs are able to diffuse out of the cold ISM and enrich the ICM needs to be studied separately.
Slope: The slope of the non-thermal IC/-ray scaling relations depends weakly on the simulated physics and is almost independent of the parameters of our magnetic field. For all three non-thermal emission mechanisms (synchrotron, IC, pion decay induced -ray emission), very similar slopes are found. This is a non-trivial finding, since the relative contribution of the various emission components differs for the different energy bands considered in this paper. Our set of non-radiative simulations (S1) yields a slope of . This reduced in our radiative simulations (S2) to and furthermore decreased when considering CRs from SNe feedback (S3) to .
Scatter: In our non-radiative simulations, the scatter in the -ray scaling relations is somewhat smaller than in our radiative ones while it is similar in the IC scaling relations. There are two reasons for this. (1) In our non-radiative simulations, there are no CC clusters by definition. In merging clusters, there are stronger shock waves in our radiative simulations due to the slightly cooler temperatures that imply smaller sound velocities and larger Mach numbers. This leads to more effective diffusive shock acceleration and an enhanced level of non-thermal emission. (2) The primary emission component has its largest impact for the IC hard X-ray emission (compared to the -ray emission). This component is largely responsible for the large scatter since it traces the current dynamical, non-equilibrium activity of the cluster. Looking at the individual non-thermal luminosities of our clusters (top panels in Fig. 2), one can notice a large scatter. In particular for the -ray emission, this scatter increases for less massive clusters in our radiative models and can boost the -ray luminosity up to a factor of four. Due to the small sample size of our simulated high-resolution clusters, we are unable to statistically quantify this effect reliably.
3.2.2 Luminosity and flux functions
-ray flux function ( MeV):
-ray luminosity function ( MeV):


IC hard X-ray flux function ( keV):
IC luminosity function ( keV):

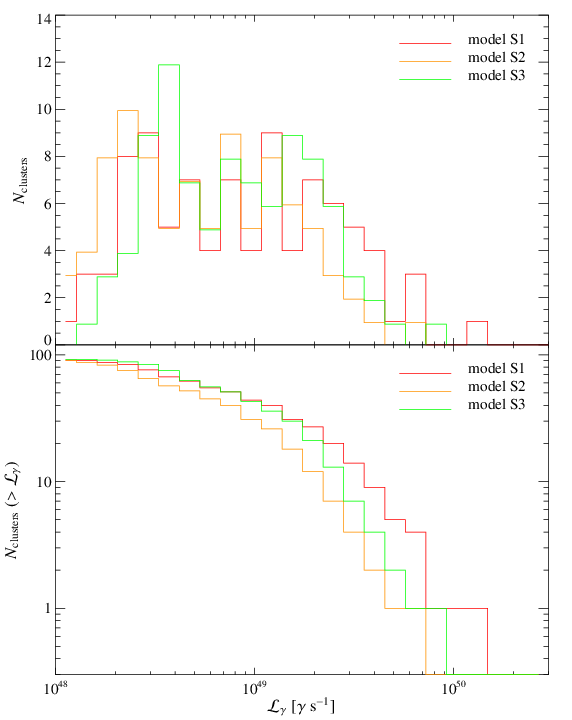
We combine our derived cluster scaling relations for non-thermal observables with the complete sample of the X-ray brightest galaxy clusters (HIFLUGCS, Reiprich & Böhringer 2002) to predict fluxes and luminosities of each of the clusters. For the luminosity distance and the cluster masses, we assumed a CDM cosmology with a currently favoured Hubble constant, , where . Dependent on the simulated physics, we can thus derive flux and luminosity functions for the -ray emission (Fig. 3) and for the hard X-ray IC emission (Fig. 4). Tables 4 and 5 in the Appendix show the 15 brightest as well as the 15 most luminous clusters of our homogeneous flux limited sample.
-ray emission: Assuming a GLAST sensitivity after two years of , we predict the detection of seven to eleven clusters named in the top left panel of Fig. 3, depending on the adopted model. The brightest -ray clusters are Ophiuchus, Fornax, Coma, A3627, Perseus, and Centaurus (A3526), independent of the simulated physics. Among these, only Ophiuchus is among the ten most massive and thus most luminous clusters of the HIFLUGCS sample. This statement can be modified once we consider scatter in -ray luminosity due the the varying dynamical states of these clusters which might modify the rank ordering of the individual systems.
The distribution of the number of clusters with a given -ray flux is flat in the variable down to where the true number of clusters is suddenly increasing towards fainter fluxes. The large intrinsic scatter around the scaling relation, especially at low -ray luminosities, is expected to increase the number of cluster detections for GLAST by scattering clusters above the survey flux limit for our case of a decreasing differential distribution with increasing flux.11 1 This effect is also known as Eddington bias (Eddington 1913). For comparison, we show how a flat differential distribution with a maximum flux translates into a cumulative one (dotted line):
| (3) |
where denotes the Heaviside function. Any cumulative flux function steeper than the dotted line benefits from the scatter around the scaling relation. This has to be taken into account when deriving the observed -ray luminosity function. However, due to the limited statistics in our simulated sample, further work is needed to quantify this expected scatter.
The luminosity function shows an exponential cutoff at high -ray luminosities that is inherited from the Press-Schechter mass function. The uncertainty at the high-mass end of our scaling relations of our different CR models translates into a similar uncertainty of the exponential cut-off of the cumulative luminosity function. The decrease of the luminosity function at smaller luminosities is due to the incompleteness of the X-ray flux limited cluster sample.
Inverse Compton emission: We predict Ophiuchus to be the brightest hard X-ray emitting cluster with a photon number flux of for energies keV. Despite the fact that the derived slope of the IC scaling relation of model S3 is different compared to the -ray case, all our brightest -ray clusters remain the brightest hard X-ray emitting clusters. The slopes in our other models are identical between the -ray and IC case which leads to identical rank ordering of the IC emitting clusters. Our findings with respect to the selection bias of the number of detected clusters due to the scattering in the scaling relations applies also in this case.
3.2.3 Comparison to observations and previous work
-ray emission: Reimer et al. 2003 derived the EGRET upper limits on the high-energy -ray emission of galaxy clusters using nine years of successive observations. Stacking a sample of 58 clusters and carefully accounting for the diffuse -ray background yielded an upper 2 limit for the average cluster of for MeV. The limits on individual clusters that this work predicts to be the brightest -ray emitters range within . Our predicted fluxes are consistent with these upper limits, providing an important consistency check of our models.
Inverse Compton emission: There seems to be growing evidence for an excess of hard X-ray emission compared to the expected thermal bremsstrahlung in a number of clusters that is based on observations with instruments on board five different X-ray satellites. Prominent examples include the Coma cluster (Rephaeli et al. 1999; Fusco-Femiano et al. 1999; Rephaeli & Gruber 2002; Fusco-Femiano et al. 2004; Fusco-Femiano et al. 2007b;22 2 The results of these papers have been challenged by an analysis that takes into account all systematic uncertainties in the critical parameters including the choice of a source-free background field and the modelling of the thermal model for the ICM (Rossetti & Molendi 2004; Rossetti & Molendi 2007). Eckert et al. 2007; using the Rossi X-ray Timing Explorer (RXTE), BeppoSAX, and INTEGRAL) and the Perseus cluster (Sanders et al. 2005; Molendi 2007, using Chandra and XMM-Newton). Using our simulations, we can test the currently favoured hypothesis that this emission is due to inverse Compton radiation by CR electrons. Fusco-Femiano et al. 1999 claimed an excess flux of between keV and keV. For the Coma cluster, our models predict a inverse Compton number flux of for energies above keV. To relate the number flux to an energy flux, we assume a photon index of and a scaling of . Using the notation for energy and number fluxes described in 57, we can calculate the energy flux in the observational hard X-ray band,
| (4) | |||||
This is a factor of 50 below the claimed detection of hard X-ray emission. We will discuss the implications of this discrepancy below.
The same argument applies to the hard X-ray emission in the Perseus cluster where Sanders et al. 2005 find a flux of between 2 and 10 keV. Assuming a photon index of , this flux exceeds our IC prediction of for the same energy range by over two orders of magnitudes. We note that in the particular case of Perseus, the main cluster temperature of keV (Churazov et al. 2003) is very close to the energy limit of Chandra’s imaging spectrometer, leaving a small lever arm for the detection of power-law component on top of the expected thermal bremsstrahlung components. Assuming that the hard X-ray emission is due to IC emission of CR electrons, we expect the non-thermal emission to be physically and spatially unrelated to the thermal emission components. The morphological similarity of the high energy/temperature emission maps of Sanders & Fabian 2007 show a clear spatial (or angular) anti-correlation between the hottest thermal components (4, 8 keV) and the power-law component which questions the IC interpretation of the data. A thorough covariance analysis of the seven different emission components in the model of Sanders & Fabian 2007 would be needed in order to exclude the possibility of component coupling in their spectral deconvolution procedure that mimics a non-present power-law component. The IC interpretation is also challenged on theoretical grounds since it requires the energy density of CR electrons to be in equipartition with the thermal plasma, leaving no room for relativistic protons that have a much longer lifetime compared to electrons.
Previous work: Most of the previous work that calculated the -ray emission from individual clusters made very simplifying assumptions about the amount and spatial distribution of CRs within galaxy clusters (Blasi et al. 2007, for a comprehensive review, cf.). Based on simplified analytical arguments such as spherical geometry, virial equilibrium, and CRs that are diffusing from a source in the cluster centre, Colafrancesco & Blasi 1998 derive a scaling relation of the hadronically induced -ray luminosity with cluster mass that is much shallower than our relations in Table 3. The difference can be easily explained by our more realistic simulations that self-consistently follow the relevant CR physics leading to an inhomogeneous distribution of relativistic protons, include hydrodynamical non-equilibrium effects and arbitrary cluster geometries, and account for realistic cosmological merger histories.
Modelling the non-thermal emission from clusters by numerically modelling discretised CR energy spectra on top of Eulerian grid-based cosmological simulations, Miniati et al. 2001a; Miniati et al. 2001b derive various scaling relations of non-thermal cluster emission ranging from radio synchrotron, IC soft and hard X-rays, to -rays which are in part considerably steeper than our relations in Table 3. In contrast to our approach, these models neglected the hydrodynamic pressure of the CR component, were quite limited in their adaptive resolution capability, and they neglected dissipative gas physics including radiative cooling, star formation, and supernova feedback. The cluster sample was comprised of small systems with average core temperatures of and non-thermal luminosities have been computed within a fixed radius that various between and for the smallest groups where . The discrepancy of the non-thermal scaling relations can be understood by two main effects that lead to an overestimation of the CR pressure inside the clusters simulated by Miniati et al. 2001a and thus overproduced the resulting non-thermal emission particularly in larger systems: (1) Miniati et al. 2000 identified shocks with Mach numbers in the range as the most important in thermalizing the plasma. In contrast, Ryu et al. 2003 and Pfrommer et al. 2006 found that the Mach number distribution peaks in the range . Since diffusive shock acceleration of CRs depends sensitively on the Mach number, this implies a more efficient CR injection in the simulations by Miniati et al. 2001a. (2) The grid-based cosmological simulations have been performed in a cosmological box of side-length Mpc with a spatial resolution of kpc, assuming an Einstein-de Sitter cosmological model (Miniati et al. 2001a). The lack of resolution in the observationally accessible, dense central regions of clusters in the grid-based approach underestimates CR cooling processes such as Coulomb and hadronic losses. Secondly, these simulations are unable to resolve the adiabatic compression of a composite of CRs and thermal gas, an effect that disfavours the CR pressure relative to the thermal pressure.
3.3 Minimum -ray flux
For clusters that host giant radio halos with an observed luminosity , we are able to derive a minimum -ray flux in the hadronic model. The non-detection of -ray flux below this flux level limits the contribution of secondary radio emission to the giant radio halo independent of the spatial distribution of CRs and thermal gas. The idea is based on the fact that the radio luminosity of an equilibrium distribution of CR electrons, where injection and cooling is balanced, becomes independent of the magnetic field in the synchrotron dominated emission regime for (cf. Fig. 3 in 57),
| (5) | |||||
| (6) |
where and are constants of the hadronic interaction physics and given in the Appendix of 57, the volume integral extends over the entire cluster, is the normalisation of the CR momentum distribution and proportional to the CR number density, is the number density of target nucleons for the hadronic interaction, is the energy density of the cosmic microwave background (CMB) and the starlight photon field, where the equivalent magnetic field strength of the energy density of the CMB is given by , and G is a frequency dependent characteristic magnetic field strength for synchrotron radiation. In this strong field limit, the volume integral of the synchrotron emission is equal to that of the -ray emission resulting from pion-decay and can be eliminated yielding
| (7) |
and is the luminosity distance to the cluster. Smaller magnetic fields would require a larger energy density of CR electrons in order to reproduce the observed synchrotron emission and thus enhance the simultaneously produced -ray emission. For the sample of known giant radio halos (Cassano et al. 2006), the Coma cluster is expected to have the largest -ray flux since the combination is at least four times larger than that in other cluster that are hosting giant radio halos. The lowest possible hadronic -ray flux is realised for hard CR spectral indices, , yielding in Coma.
It turns out, that this limit can be considerably tightened by requiring the average magnetic energy density to be locally less than the thermal energy density. For our Coma-like cluster g72a in our simulation, a central magnetic field strength of G corresponds to a ratio of thermal-to-magnetic pressure of 20. Since the thermal pressure decreases by two orders of magnitude towards the virial radius, a constant magnetic energy density (as required by the synchrotron dominated emission regime) would exceed the thermal energy density by a factor of five. This requires knowledge of the spatial distribution of CRs, magnetic fields and thermal gas in our Coma-like cluster simulation,
| (8) |
where is the central radio halo emission due to hadronically produced CR electrons in our model S2 (CR acceleration at structure formation shocks while allowing for all CR loss processes). The predicted -ray luminosity in this model amounts to and is weakly dependent on the assumed CR spectral index of . The very conservative -ray limit assumes a central magnetic field G, ensures everywhere within the virial region of the cluster and yields . For the same and at the virial radius, we obtain . Adopting an even lower central magnetic field G as Faraday rotation studies of the Coma cluster indicate (Kim et al. 1990) and requiring at the virial radius, we obtain , i.e. the GLAST all-sky survey will be able to scrutinise this scenario after two years. We would like to close this section by noting that our simulations predict a -ray flux from Coma of . This in turn would imply a central magnetic field G with a constant average ratio of thermal-to-magnetic pressure of 200, comparing to the observed synchrotron flux.
4 Discussion and Conclusions
We performed high-resolution simulations of a sample of 14 galaxy clusters that span a mass range of almost two orders of magnitude and follow self-consistent CR physics on top of the dissipative gas physics including radiative cooling, star formation, and supernova feedback. The modelled CR physics in our simulations and our on-the-fly identification scheme of the strength of structure formation shock waves allows us to reliably compute the relativistic electron populations at high energies. We consider relativistic electrons that are accelerated at cosmological structure formation shocks (so-called primary electrons) and those that are produced in hadronic interactions of cosmic rays with ambient gas protons (hence the name secondary or hadronic electrons).
4.1 Non-thermal scaling relations
In this paper, we concentrate on three observationally motivated wave-bands. (1) Radio synchrotron emission at GHz, (2) non-thermal hard X-ray emission at energies keV, and (3) -ray emission at energies MeV. We study the contribution of the different emission components to the total cluster luminosity in each of these bands, derive cluster scaling relations, and study their dependence on the simulated physics and adopted parametrisation of the magnetic field. Our main findings are as follows:
- 1.
The secondary emission component (radio synchrotron and inverse Compton) is dominant for relaxing cool core clusters, and those that only experience a minor merger. The primary component can exceed the secondary one for major merging clusters by a factor of four. In the -ray scaling relations ( MeV), the pion decay component is always dominant over the primary and secondary IC emission components.
- 2.
The normalisation of the non-thermal scaling relations depends only weakly on whether radiative or non-radiative gas physics is simulated provided we consider in both cases only CRs from structure formation shocks. This is mainly due to self-regulated effects of the CR pressure due to the density dependent CR cooling mechanisms. In contrast, the normalisation of the radio synchrotron scaling relation sensitively depends on the assumptions and parametrisation of the magnetic field. This clearly reinforces the need to understand observationally how the properties of large scale cluster magnetic fields vary with cluster mass and dynamical state.
- 3.
The slope of the non-thermal scaling relations depends weakly on the simulated physics and is almost independent of the parameters of our magnetic field. For all three non-thermal emission mechanisms (synchrotron, IC, pion decay induced -ray emission), very similar slopes are found. This is a non-trivial finding, since the relative contribution of the various emission components differs for the different energy bands considered in this paper. Our set of non-radiative simulations (S1) yields a slope of . This is reduced in our radiative simulations (S2) to and furthermore decreased when considering CRs from SNe feedback (S3) to . The slope of the synchrotron scaling relation steepens if we only consider merging galaxy clusters. As a caveat for our synchrotron scaling relations, we assume the same parametrisation of the magnetic field for all clusters. If the central magnetic field scales with the cluster mass, the slopes will be accordingly steeper. Additionally, this self-similarity could be broken in the radio synchrotron scaling relations, once magnetic field are dynamically simulated and respond to the dynamical state of a cluster. This reinforces the need to understand the observed scaling properties of the magnetic field in clusters before we can draw strong conclusions about the theory underlying the cluster radio emission.
- 4.
In our non-radiative simulations, we observe large scatter in all non-thermal scaling relations. This is mostly driven by active merging systems that trigger violent shock waves and thus boost the primary emission signal. Our results hint at a larger contribution of the scatter towards less massive systems due to their smaller gravitational potential which needs to be checked with a larger cluster sample size. The large scatter will have important implications for the number of detectable -ray emitting clusters by GLAST.
4.2 Radio synchrotron emission
The unified model of radio halos and relics has been put forward in our companion paper (57) and is based on studies of the morphology, profiles, and expected polarisation of our simulated diffuse cluster radio synchrotron emission. The derived radio luminosities of the primary and secondary electron populations complement this picture. We are summarising the main findings of this work in the following.
- 1.
Assuming magnetic field strengths provided by Faraday rotation observations, we are able to successfully reproduce the observed radio synchrotron luminosities of giant radio halos as well as radio mini-halos in our simulations.
- 2.
Each of our radio halo scaling relations assumes one physical model for the magnetic field that is described by a central field strength and magnetic decline. We assume it to be independent of the cluster mass and dynamical state. In this respect, the simulated scaling relations can be understood as contour lines in the radio luminosity-cluster mass plane which are labelled with a set of parameters of our magnetic model. Radio mini-halos have a higher radio luminosity on average compared to that of giant radio halos. This points towards a larger central magnetic field of the order of G in these relaxed cool core clusters compared to the apparently preferred weaker central field strength of the order of G in merging systems. This finding is consistent with Faraday rotation measurements and strongly hints at an amplifying mechanism of magnetic field strengths in relaxed clusters such as adiabatic compression of the fields during the formation of the cool core or AGN feedback amplified fields as argued in Enßlin & Vogt 2006.
- 3.
Observed giant radio halos are all associated with merging clusters. The merger causes these systems to depart from hydrostatic equilibrium and leads to a complicated non-spherical morphology. The resulting X-ray mass estimates are subject to large uncertainties and might be partly responsible for the large scatter of observed giant radio halos of scatters by two orders of magnitude in synchrotron luminosity while the virial masses of the hosting clusters only spans a factor of three. Cluster-to-cluster variations of the geometry, mass ratio, the advanced state of the merger, and magnetic field strengths contribute furthermore to the scatter in the scaling relations. The small sample size in combination with the mentioned uncertainties doom all attempts to determine a reliable observational synchrotron scaling relation for radio halos. In contrast, studies of the pixel-to-pixel correlation of the synchrotron and X-ray surface brightness enable valuable insights that are not subject to the assumption of spherical symmetry.
4.3 Inverse Compton emission
Given our reliable modelling of the synchrotron and IC emitting high-energy CR electron populations and our convenient parametrisation of the magnetic field that is calibrated against Faraday rotation measurements, we can successfully reproduce the luminosity of observed giant radio halos. However, our predicted inverse Compton flux for the Coma and Perseus cluster falls short of the detected excess of hard X-ray emission compared to the expected thermal bremsstrahlung by at least a factor of 50. Lowering the magnetic field strength will not reconcile this discrepancy, since the IC emissivity of a steady state electron population is independent of the magnetic energy density in the low-field regime for . This finding can be rephrased as follows. Combining the observed diffuse radio synchrotron and IC emission allows to eliminate the ab initio unknown energy density of relativistic electrons and to obtain an estimate for the magnetic field strength that typically reaches values of G (Enßlin & Biermann 1998; Enßlin et al. 1999, e.g.,). There are now three problems associated with these low field strengths that challenge the standard inverse Compton interpretation of the hard X-ray excess emission. (1) These field strengths are an order of magnitude smaller than those derived from Faraday rotation measurements which translates into two orders of magnitude in energy density. (2) The energy density of CR electrons that is in turn needed to explain the radio halo emission would thus be two orders of magnitudes larger than what our model of the primary and secondary electron populations predict. (3) If we increased by two orders of magnitude (due to a different injection mechanism such as AGN jets), the resulting IC emission at MeV would challenge upper limits on the -ray emission imposed by EGRET (Reimer et al. 2003). Furthermore, the acceleration mechanism would have to single out fermions over protons in order not to violate the EGRET bounds by overproducing the simultaneously produced -rays from pion-decay.
There have been suggestions in the literature to circumvent the first problem: Enßlin 2004 suggests that one could in principle reconcile the observed discrepancy of magnetic field estimates, if there is a significant difference between volume and CRe weighted averages. This would require an inhomogeneous magnetic energy distribution, an inhomogeneous distribution of the CR electrons, and an anti-correlation between these two. These conditions could be produced by physical mechanisms which produce inhomogeneous or intermittent magnetic fields and at the same time anti-correlate the CRe density with respect to the magnetic energy density. As a very plausible mechanism, he suggests synchrotron cooling in inhomogeneous magnetic fields that provides naturally the required anti-correlation. The hadronic model in conjunction with peripheral shock acceleration that we studied in our series of simulations would provide a CR electron injection rate which is not correlated with the magnetic field strength, as would be required by the above explanation of the discrepancy of magnetic field estimates by the two methods would work. In contrast to this, in the re-acceleration model one would expect a strong positive correlation of CRe and magnetic field strength, since magnetic fields are essential for the CR electron acceleration. Petrosian 2001 alleviates the difficulties with the low magnetic field strengths in the IC model by taking into account effects of observational selection bias and evoking non-standard assumptions of a non-isotropic pitch angle distribution as well as spectral breaks in the energy distribution of the relativistic electrons.
What are the model uncertainties of our simulations that might boost the energy density of CR electrons thus circumventing the second problem? (1) The scatter in the IC scaling relations seems only to be able to account for another factor of two, albeit the small sample size of our simulated high-resolution clusters makes it impossible to statistically quantify the scatter reliably. (2) Adopting central magnetic field strength will only increase the IC emissivity that is emitted by a steady state electron population by another factor of two compared to our low-field case of (57, cf. Fig. 3 in). (3) Are there any other sources that inject CR electrons homogeneously throughout the cluster volume and resupply them on a time scale shorter than their radiative cooling time of yrs? CR diffusion out of AGN and radio galaxies will not reproduce the required homogeneous distribution of CR electrons in order to explain radio halos. Secondly, diffusion will lead to a narrow, steep profile of the CR electron energy density with a maximum radius of kpc, assuming a large CR diffusivity of and a combined IC/synchrotron cooling time of yr that corresponds to IC emitting electrons at 10 keV with a Lorentz factor of and assuming a magnetic field of G. This is an order of magnitude smaller than the emission radius of the Perseus radio-mini halo and is much smaller than the emission size of giant radio halos. The re-acceleration model might in principle have the correct properties to explain the spatial and spectral electron distribution. As laid out above, it faces however severe problems in reconciling the observed discrepancy of magnetic field estimates from Faraday rotation measurements on the one hand and combining synchrotron and IC measurements one the other hand. (4) Our model of the diffusive shock acceleration mechanism assumes a featureless power-law (57, for details, see). Future work will be dedicated on improving this model to incorporate more elaborate plasma physical models. (5) In the literature, the excess of hard X-ray emission compared to the expected thermal bremsstrahlung in the Coma cluster is currently controversially discussed (Fusco-Femiano et al. 2004; Fusco-Femiano et al. 2007a; Fusco-Femiano et al. 2007b; Rossetti & Molendi 2004; Rossetti & Molendi 2007). Observational efforts, such as the future hard X-ray missions NuSTAR and Simbol-X, have to be undertaken to unambiguously detect the spectral and spatial characteristics of the hard X-ray excess emission.
If one relaxes the requirement of explaining the hard X-ray excess with the same population of electrons that is responsible for the radio synchrotron emission, there are two other models that try to explain the non-thermal excess by synchrotron radiation of ultra-relativistic (multi-TeV) electrons and positrons. These electrons are continuously injected throughout the entire intra-cluster medium either by interactions of hypothetical very high-energy -rays with diffuse extragalactic radiation fields (Timokhin et al. 2004) or by means of pair production processes of CMB photons in the Coulomb field of ultra high-energetic CR (UHECR) protons that are accelerated at structure formation shocks (Inoue et al. 2005). While the generation of extremely high-energy photons remains the main challenging question for the first model, the energy requirement of a UHECR population of erg is rather extreme. Both models, however, are not able to reproduce the radio-halo emission that is detected in these clusters.
Possibly the most elegant explanation for the hard X-ray emission is non-thermal bremsstrahlung of a supra-thermal electron population that is energised by Coulomb collisions between the quasi-thermal electrons and non-thermal protons (Wolfe & Melia 2007). Such an electron population displays a higher bremsstrahlung radiative efficiency than a pure power law population thus avoiding the overheating problem of the thermal plasma (Petrosian 2001). The non-thermal protons would simultaneously be responsible for the Coma cluster’s diffuse radio halo emission (57, within the unified scheme put forward in).
4.4 High-energy -ray emission
Our predicted -ray fluxes of nearby galaxy clusters are consistent with EGRET upper limits of these clusters (Reimer et al. 2003). The brightest -ray clusters are typically a factor of five smaller than the derived upper limits, which provides an important consistency check of our models. We note that our simulations have not been tuned to match these upper limits, instead we modelled the CR physics to our best knowledge and calculated the -ray luminosity of our simulated clusters.
We predict the detection of the pion decay induced -ray emission of seven to eleven galaxy clusters by GLAST, depending on the adopted model. The expected brightest -ray clusters are Ophiuchus, Fornax, Coma, A3627, Perseus, and Centaurus (A3526), independent of the simulated physics. Due to the increasing slope of the differential cluster flux number distribution towards smaller -ray fluxes and the large scatter in the scaling relations (especially for less massive systems), we expect the detected number of clusters to increase somewhat since clusters are scattered above the survey flux limit. For clusters that host giant radio halos, we are able to derive a minimum -ray flux in the hadronic model independent of the spatial distribution of CRs and thermal gas. The radio luminosity of an equilibrium distribution of CR electrons, where injection due to hadronic CR interactions and cooling is balanced, becomes independent of the magnetic field in the synchrotron dominated emission regime. A smaller magnetic field would require a larger energy density of CR electrons to reproduce the observed synchrotron luminosity and thus increase the associated -ray flux. In Coma, the absolute minimum flux of is well below the sensitivity of GLAST. Assuming magnetic field strengths as derived by Faraday rotation measurements, these limits can be considerably tightened to match the GLAST sensitivity after two years of all-sky survey, . The detection of hadronically induced -ray emission will enable us to determine the CR proton pressure in clusters and unambiguously decide upon the model of cluster radio halos.
Acknowledgements
I am very thankful to Volker Springel and Torsten Enßlin for carefully reading the manuscript and Torsten Enßlin for suggesting the analytic method of the minimum -ray flux. All computations were performed on CITA’s McKenzie cluster (Dubinski et al. 2003) which was funded by the Canada Foundation for Innovation and the Ontario Innovation Trust.
References
- Aharonian et al. (2006) Aharonian F., Akhperjanian A. G., Bazer-Bachi A. R., Beilicke M., Benbow W., Berge D., Bernlöhr K., Boisson C., Bolz O., Borrel V., Braun I., Breitling F., et al. 2006, Nature, 439, 695
- Bagchi et al. (2006) Bagchi J., Durret F., Neto G. B. L., Paul S., 2006, Science, 314, 791
- Berezinsky et al. (1997) Berezinsky V. S., Blasi P., Ptuskin V. S., 1997, ApJ, 487, 529
- Blasi & Colafrancesco (1999) Blasi P., Colafrancesco S., 1999, Astroparticle Physics, 12, 169
- Blasi et al. (2007) Blasi P., Gabici S., Brunetti G., 2007, ArXiv Astrophysics e-prints
- Brunetti et al. (2004) Brunetti G., Blasi P., Cassano R., Gabici S., 2004, MNRAS, 350, 1174
- Brunetti & Lazarian (2007) Brunetti G., Lazarian A., 2007, MNRAS, 378, 245
- Brunetti et al. (2001) Brunetti G., Setti G., Feretti L., Giovannini G., 2001, MNRAS, 320, 365
- Carilli & Taylor (2002) Carilli C. L., Taylor G. B., 2002, ARA&A, 40, 319
- Cassano et al. (2006) Cassano R., Brunetti G., Setti G., 2006, MNRAS, 369, 1577
- Churazov et al. (2003) Churazov E., Forman W., Jones C., Böhringer H., 2003, ApJ, 590, 225
- Clarke & Enßlin (2006) Clarke T. E., Enßlin T. A., 2006, AJ, 131, 2900
- Colafrancesco & Blasi (1998) Colafrancesco S., Blasi P., 1998, Astroparticle Physics, 9, 227
- Deiss et al. (1997) Deiss B. M., Reich W., Lesch H., Wielebinski R., 1997, A&A, 321, 55
- Dennison (1980) Dennison B., 1980, ApJL, 239, L93
- Dolag et al. (1999) Dolag K., Bartelmann M., Lesch H., 1999, A&A, 348, 351
- Dolag & Enßlin (2000) Dolag K., Enßlin T. A., 2000, A&A, 362, 151
- Dolag et al. (2001) Dolag K., Schindler S., Govoni F., Feretti L., 2001, A&A, 378, 777
- Dubinski et al. (2003) Dubinski J., Humble R. J., Loken C., Pen U.-L., Martin P. G., 2003, in Proc. of the 17th Annual International Symposium on High Performance Computing Systems and Applications: McKenzie: A Teraflops Linux Beowulf Cluster for Computational Astrophysics
- Eckert et al. (2007) Eckert D., Neronov A., Courvoisier T. J.-L., Produit N., 2007, A&A, 470, 835
- Eddington (1913) Eddington A. S., 1913, MNRAS, 73, 359
- Eke et al. (1996) Eke V. R., Cole S., Frenk C. S., 1996, MNRAS, 282, 263
- Enßlin (2004) Enßlin T., 2004, Journal of Korean Astronomical Society, 37, 439
- Enßlin & Biermann (1998) Enßlin T. A., Biermann P. L., 1998, A&A, 330, 90
- Ensslin et al. (1998) Ensslin T. A., Biermann P. L., Klein U., Kohle S., 1998, A&A, 332, 395
- Enßlin et al. (1999) Enßlin T. A., Lieu R., Biermann P. L., 1999, A&A, 344, 409
- Enßlin et al. (2007) Enßlin T. A., Pfrommer C., Springel V., Jubelgas M., 2007, A&A, 473, 41
- Enßlin & Vogt (2006) Enßlin T. A., Vogt C., 2006, A&A, 453, 447
- Evrard et al. (1996) Evrard A. E., Metzler C. A., Navarro J. F., 1996, ApJ, 469, 494
- Feretti et al. (2004) Feretti L., Brunetti G., Giovannini G., Kassim N., Orrú E., Setti G., 2004, Journal of Korean Astronomical Society, 37, 315
- Fusco-Femiano et al. (1999) Fusco-Femiano R., dal Fiume D., Feretti L., Giovannini G., Grandi P., Matt G., Molendi S., Santangelo A., 1999, ApJL, 513, L21
- Fusco-Femiano et al. (2007a) Fusco-Femiano R., Landi R., Orlandini M., 2007a, astro-ph/0702576
- Fusco-Femiano et al. (2007b) Fusco-Femiano R., Landi R., Orlandini M., 2007b, ApJL, 654, L9
- Fusco-Femiano et al. (2004) Fusco-Femiano R., Orlandini M., Brunetti G., Feretti L., Giovannini G., Grandi P., Setti G., 2004, ApJL, 602, L73
- Giovannini et al. (1999) Giovannini G., Tordi M., Feretti L., 1999, New Astronomy, 4, 141
- Gitti et al. (2004) Gitti M., Brunetti G., Feretti L., Setti G., 2004, A&A, 417, 1
- Gitti et al. (2007) Gitti M., Ferrari C., Domainko W., Feretti L., Schindler S., 2007, A&A, 470, L25
- Govoni et al. (2001) Govoni F., Enßlin T. A., Feretti L., Giovannini G., 2001, A&A, 369, 441
- Govoni & Feretti (2004) Govoni F., Feretti L., 2004, International Journal of Modern Physics D, 13, 1549
- Inoue et al. (2005) Inoue S., Aharonian F. A., Sugiyama N., 2005, ApJL, 628, L9
- Jaffe (1977) Jaffe W. J., 1977, ApJ, 212, 1
- Jubelgas et al. (2007) Jubelgas M., Springel V., Enßlin T. A., Pfrommer C., 2007, A&A, in print, arXiv:astro-ph/0603485
- Kempner et al. (2004) Kempner J. C., Blanton E. L., Clarke T. E., Enßlin T. A., Johnston-Hollitt M., Rudnick L., 2004, in The Riddle of Cooling Flows in Galaxies and Clusters of galaxies, Conference Note: A Taxonomy of Extended Radio Sources in Clusters of Galaxies. p. 335
- Kim et al. (1989) Kim K. ., Kronberg P. P., Giovannini G., Venturi T., 1989, Nature, 341, 720
- Kim et al. (1990) Kim K.-T., Kronberg P. P., Dewdney P. E., Landecker T. L., 1990, ApJ, 355, 29
- Liang et al. (2000) Liang H., Hunstead R. W., Birkinshaw M., Andreani P., 2000, ApJ, 544, 686
- Miniati et al. (2001a) Miniati F., Ryu D., Kang H., Jones T. W., 2001a, ApJ, 559, 59
- Miniati et al. (2001b) Miniati F., Jones T. W., Kang H., Ryu D., 2001b, ApJ, 562, 233
- Miniati et al. (2000) Miniati F., Ryu D., Kang H., Jones T. W., Cen R., Ostriker J. P., 2000, ApJ, 542, 608
- Molendi (2007) Molendi S., 2007, private communication
- Ohno et al. (2002) Ohno H., Takizawa M., Shibata S., 2002, ApJ, 577, 658
- Pedlar et al. (1990) Pedlar A., Ghataure H. S., Davies R. D., Harrison B. A., Perley R., Crane P. C., Unger S. W., 1990, MNRAS, 246, 477
- Petrosian (2001) Petrosian V., 2001, ApJ, 557, 560
- Pfrommer & Enßlin (2003) Pfrommer C., Enßlin T. A., 2003, A&A, 407, L73
- Pfrommer & Enßlin (2004a) Pfrommer C., Enßlin T. A., 2004a, A&A, 413, 17
- Pfrommer & Enßlin (2004b) Pfrommer C., Enßlin T. A., 2004b, MNRAS, 352, 76
- Pfrommer et al. (2007b) Pfrommer C., Enßlin T. A., Springel 2007b, ArXiv:0707.1707
- Pfrommer et al. (2007a) Pfrommer C., Enßlin T. A., Springel V., Jubelgas M., Dolag K., 2007a, MNRAS, 378, 385
- Pfrommer et al. (2006) Pfrommer C., Springel V., Enßlin T. A., Jubelgas M., 2006, MNRAS, 367, 113
- Reimer et al. (2003) Reimer O., Pohl M., Sreekumar P., Mattox J. R., 2003, ApJ, 588, 155
- Reiprich & Böhringer (2002) Reiprich T. H., Böhringer H., 2002, ApJ, 567, 716
- Rephaeli & Gruber (2002) Rephaeli Y., Gruber D., 2002, ApJ, 579, 587
- Rephaeli et al. (1999) Rephaeli Y., Gruber D., Blanco P., 1999, ApJL, 511, L21
- Roettiger et al. (1996) Roettiger K., Burns J. O., Loken C., 1996, ApJ, 473, 651
- Rossetti & Molendi (2004) Rossetti M., Molendi S., 2004, A&A, 414, L41
- Rossetti & Molendi (2007) Rossetti M., Molendi S., 2007, astro-ph/0702417
- Röttgering et al. (1997) Röttgering H. J. A., Wieringa M. H., Hunstead R. W., Ekers R. D., 1997, MNRAS, 290, 577
- Ryu et al. (2003) Ryu D., Kang H., Hallman E., Jones T. W., 2003, ApJ, 593, 599
- Sanders & Fabian (2007) Sanders J. S., Fabian A. C., 2007, MNRAS, 381, 1381
- Sanders et al. (2005) Sanders J. S., Fabian A. C., Dunn R. J. H., 2005, MNRAS, 360, 133
- Sarazin (2002) Sarazin C. L., 2002, in ASSL Vol. 272: Merging Processes in Galaxy Clusters The Physics of Cluster Mergers. pp 1–38
- Schekochihin & Cowley (2006) Schekochihin A. A., Cowley S. C., 2006, Physics of Plasmas, 13, 6501
- Schindler (2002) Schindler S., 2002, in Feretti L., Gioia I. M., Giovannini G., eds, Astrophysics and Space Science Library Vol. 272 of Astrophysics and Space Science Library, Mergers of Galaxy Clusters in Numerical Simulations. pp 229–251
- Schlickeiser et al. (1987) Schlickeiser R., Sievers A., Thiemann H., 1987, A&A, 182, 21
- Subramanian (2003) Subramanian K., 2003, Physical Review Letters, 90, 245003
- Timokhin et al. (2004) Timokhin A. N., Aharonian F. A., Neronov A. Y., 2004, A&A, 417, 391
- Vestrand (1982) Vestrand W. T., 1982, AJ, 87, 1266
- Vogt & Enßlin (2005) Vogt C., Enßlin T. A., 2005, A&A, 434, 67
- Völk et al. (1996) Völk H. J., Aharonian F. A., Breitschwerdt D., 1996, Space Science Reviews, 75, 279
- Widrow (2002) Widrow L. M., 2002, Reviews of Modern Physics, 74, 775
- Wolfe & Melia (2007) Wolfe B., Melia F., 2007, ArXiv:0712.0187
Appendix A Predicting the brightest and most-luminous nearby -ray clusters
| IC emission, keV: | -ray emission, MeV: | |||||||||
|---|---|---|---|---|---|---|---|---|---|---|
| cluster name | (S1) | (S2) | (S2, ) | (S3) | (S1) | (S2) | (S2, ) | (S3) | ||
| Ophiuchus | 0.0280 | 2.32 | 3.43 | 1.77 | 2.40 | 2.26 | 9.11 | 5.75 | 5.95 | 8.49 |
| Fornax | 0.0046 | 0.10 | 1.12 | 1.02 | 1.42 | 1.82 | 3.04 | 3.55 | 3.68 | 8.38 |
| Coma | 0.0232 | 1.38 | 2.30 | 1.30 | 1.78 | 1.76 | 6.12 | 4.28 | 4.43 | 6.82 |
| A3627 | 0.0163 | 0.66 | 1.51 | 0.98 | 1.35 | 1.43 | 4.04 | 3.27 | 3.39 | 5.84 |
| Perseus | 0.0183 | 0.77 | 1.52 | 0.96 | 1.32 | 1.38 | 4.08 | 3.20 | 3.31 | 5.57 |
| A3526 | 0.0103 | 0.27 | 0.98 | 0.75 | 1.04 | 1.21 | 2.65 | 2.56 | 2.65 | 5.21 |
| A1060 | 0.0114 | 0.30 | 0.96 | 0.71 | 0.99 | 1.13 | 2.57 | 2.43 | 2.51 | 4.86 |
| M49 | 0.0044 | 0.05 | 0.37 | 0.39 | 0.55 | 0.76 | 1.01 | 1.38 | 1.43 | 3.67 |
| AWM7 | 0.0172 | 0.43 | 0.72 | 0.50 | 0.69 | 0.77 | 1.94 | 1.70 | 1.76 | 3.22 |
| 3C129 | 0.0223 | 0.66 | 0.81 | 0.53 | 0.72 | 0.77 | 2.18 | 1.76 | 1.82 | 3.13 |
| NGC4636 | 0.0037 | 0.03 | 0.20 | 0.24 | 0.34 | 0.50 | 0.56 | 0.87 | 0.90 | 2.52 |
| A1367 | 0.0216 | 0.41 | 0.41 | 0.29 | 0.40 | 0.45 | 1.10 | 0.98 | 1.02 | 1.88 |
| A0754 | 0.0528 | 1.87 | 0.67 | 0.36 | 0.49 | 0.47 | 1.78 | 1.18 | 1.22 | 1.79 |
| Triangulum | 0.0510 | 1.54 | 0.54 | 0.30 | 0.41 | 0.40 | 1.43 | 0.98 | 1.01 | 1.53 |
| NGC5846 | 0.0061 | 0.04 | 0.14 | 0.15 | 0.22 | 0.31 | 0.39 | 0.55 | 0.57 | 1.50 |
Notes:
(1) IC and -ray fluxes of clusters that are contained in the complete sample of the X-ray brightest clusters (HIFLUGCS, the HIghest X-ray FLUx Galaxy Cluster Sample, Reiprich & Böhringer 2002). We predict these fluxes using our cluster scaling relations for non-thermal observables defined in Table 3. The definition for our different models can be found in Table 2. The clusters are ordered according to their decreasing -ray flux in our model S3.
(2) Mass contained within in units of .
(3) Predicted total (primary and secondary) IC flux in units of . If not otherwise mentioned, we use our magnetic parametrisation of G and . Our model with refers to a smaller central value for the magnetic field of G and yields a higher IC luminosity.
(4) Predicted total (primary IC, secondary IC, pion decay) -ray flux in units of . If not otherwise mentioned, we use our magnetic parametrisation of G and . Our model with refers to a smaller central value for the magnetic field of G which barely effects the -ray flux due to the dominant contribution from pion decay emission.
| IC emission, keV: | -ray emission, MeV: | |||||||||
|---|---|---|---|---|---|---|---|---|---|---|
| cluster name | (S1) | (S2) | (S2, ) | (S3) | (S1) | (S2) | (S2, ) | (S3) | ||
| A2163 | 0.2010 | 3.71 | 12.64 | 6.00 | 8.10 | 7.28 | 3.35 | 1.93 | 1.99 | 2.65 |
| A3888 | 0.1510 | 2.55 | 7.14 | 3.63 | 4.92 | 4.58 | 1.89 | 1.17 | 1.21 | 1.71 |
| A1914 | 0.1712 | 2.43 | 6.62 | 3.39 | 4.60 | 4.31 | 1.76 | 1.10 | 1.14 | 1.61 |
| Ophiuchus | 0.0280 | 2.32 | 6.16 | 3.18 | 4.32 | 4.06 | 1.64 | 1.03 | 1.07 | 1.52 |
| A3827 | 0.0980 | 1.96 | 4.77 | 2.54 | 3.46 | 3.31 | 1.27 | 0.83 | 0.86 | 1.25 |
| A0754 | 0.0528 | 1.87 | 4.45 | 2.39 | 3.25 | 3.12 | 1.18 | 0.78 | 0.81 | 1.19 |
| A1689 | 0.1840 | 1.76 | 4.06 | 2.21 | 3.00 | 2.90 | 1.08 | 0.72 | 0.75 | 1.11 |
| A3266 | 0.0594 | 1.70 | 3.83 | 2.10 | 2.85 | 2.77 | 1.02 | 0.69 | 0.71 | 1.06 |
| A2065 | 0.0721 | 1.67 | 3.74 | 2.05 | 2.79 | 2.71 | 0.99 | 0.67 | 0.69 | 1.04 |
| A2256 | 0.0601 | 1.56 | 3.36 | 1.87 | 2.54 | 2.49 | 0.90 | 0.61 | 0.63 | 0.96 |
| Triangulum | 0.0510 | 1.54 | 3.30 | 1.84 | 2.50 | 2.45 | 0.88 | 0.60 | 0.62 | 0.94 |
| A2142 | 0.0899 | 1.50 | 3.18 | 1.78 | 2.42 | 2.38 | 0.85 | 0.58 | 0.60 | 0.92 |
| A0644 | 0.0704 | 1.42 | 2.91 | 1.64 | 2.24 | 2.21 | 0.78 | 0.54 | 0.56 | 0.86 |
| Coma | 0.0232 | 1.38 | 2.81 | 1.59 | 2.17 | 2.15 | 0.75 | 0.52 | 0.54 | 0.83 |
| A2029 | 0.0767 | 1.34 | 2.68 | 1.53 | 2.08 | 2.07 | 0.71 | 0.50 | 0.52 | 0.80 |
Notes:
(1) IC and -ray luminosities of clusters that are contained in the complete sample of the X-ray brightest clusters (HIFLUGCS, the HIghest X-ray FLUx Galaxy Cluster Sample, Reiprich & Böhringer 2002). We predict these luminosities using our cluster scaling relations defined in Table 3. The definition for our different models can be found in Table 2. The clusters are ordered according to their decreasing -ray luminosities in our model S3.
(2) Mass contained within in units of .
(3) Predicted total (primary and secondary) IC luminosity in units of . If not otherwise mentioned, we use our magnetic parametrisation of G and . Our model with refers to a smaller central value for the magnetic field of G and yields a higher IC luminosity.
(4) Predicted total (primary IC, secondary IC, pion decay) -ray luminosity in units of . If not otherwise mentioned, we use our magnetic parametrisation of G and . Our model with refers to a smaller central value for the magnetic field of G which barely effects the -ray luminosity due to the dominant contribution from pion decay emission.
High-energy -ray fluxes and luminosities a related by the simple conversion formula,
| (9) | |||||