Direct link between low-temperature magnetism
and high-temperature sodium order in
Abstract
We prove the direct link between low temperature () magnetism and high- ordering in using the example of a so far unreported magnetic transition at which involves a weak ferromagnetic moment. The feature is characterized in detail and its dependence on a diffusive rearrangement around is demonstrated. Applying muons as local probes this process is shown to result in a reversible phase separation into distinct magnetic phases that can be controlled by specific cooling protocols. Thus the impact of ordered Coulomb potential on the physics is evidenced opening new ways to experimentally revisit the phase diagram.
pacs
71.27.+a, 75.30.Kz, 75.30.Fv, 76.75.+i, 65.40.-bThe layered transition metal oxide combines high thermopower and metallic conductivity, thus being a promising candidate for thermoelectric energy conversion Terasaki et al. 1997; Lee et al. 2006. Superconductivity Takada et al. 2003 in hydrated and other types of ordered electronic groundstates for higher sodium content Foo et al. 2004; Boothroyd et al. 2004; Sales et al. 2004; Bayrakci et al. 2004; Wooldridge et al. 2005; Helme et al. 2006 reflect the richness in its physics. The propensity of the electronic system to a number of instabilities was revealed by theoretical studies assuming a homogeneous electronic structure Singh 2000; Indergand et al. 2005. However, the sodium ions (whose apparent main role is to donate electrons to the Co-O derived states) create local electronic inhomogeneity through their Coulomb potential, seen e.g. in NMR in the form of inequivalent Co sites Mukhamedshin et al. 2005. It was suggested from a theoretical point of view that sodium ordering at high temperatures Zandbergen et al. 2004; Huang et al. 2004a; Roger et al. 2007 influences the electronic structure of the layers through Coulomb potential wells Roger et al. 2007; Geck et al. 2006; Zhang et al. 2005. The key experimental challenge in this field is to establish the link between high- sodium ordering and the low- magnetic properties. To verify such a link, control of sodium rearrangement would have to be achieved and the ensuing magnetic order to be monitored and quantified. Here we demonstrate this direct correspondance using the example of a new magnetic instability at in and . We show it to result from diffusive sodium rearrangement in a narrow window near , which is fully reversible and reproducible and can be completely controlled by the details of the samples’ cooling protocol. This discovery reveals to be the only system comprising itinerant electrons on a triangular lattice which is susceptible to an externally controllable Coulomb potential. It leads the way to experimental exploration of further sodium rearrangement processes through defined heat treatment protocols possibly yielding even more electronic instabilites in the same sample.
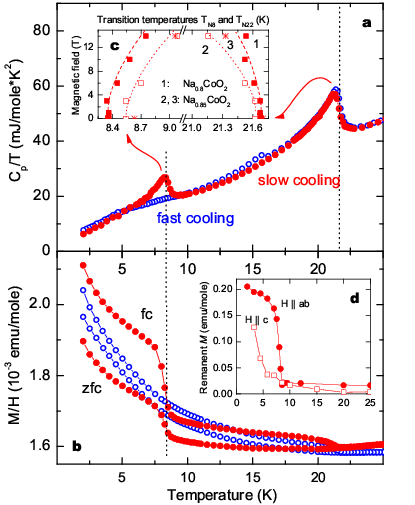
Crystals were grown applying a standard preparation technique Prabhakaran et al. 2004 and analyzed using single crystal X-ray diffraction which generally confirmed the samples to be single-crystalline, the mosaic spread being . Some samples showed twinning, but in all cases the c-axis and the ab-planes were well-defined. We begin with the description of the magnetic phase, which is completely dependent on the cooling procedure as is demonstrated in Fig. 1. In the following, ’slow cooling’ denotes a cooldown from ambient temperature with while a ’fast cooled’ sample has been directly inserted into the cryostat at . Fig. 1a shows the specific heat in zero field (measured with relaxation technique on a Quantum Design PPMS-14) for both cooling protocols. In the ’slow cool’ curve, in addition to an anomaly at there is another, lambda-shaped feature in clearly indicating a second phase transition at . The corresponding entropies are approximately for the and for the peak. After ’fast cooling’, the peak is absent while the anomaly at is larger by . The coefficient obtained from a fit to a two-phonon model between and is for both curves while the residual is much smaller ( for ).
The magnetic signature of the transition (measured on a Quantum Design MPMS XL SQUID magnetometer) is shown in Fig. 1b, again for the two cooling protocols. In addition to the previously reported transition’s features (e.g. Refs. Sales et al. 2004; Bayrakci et al. 2004; Wooldridge et al. 2005; Motohashi et al. 2003), measured with parallel to the layers () increases step-like at only for the ’slowly cooled’ sample, suggesting the build up of a small ferromagnetic (FM) component. To clarify its orientation, the remanent magnetization was derived from loops on a ’slowly cooled’ sample with and (Fig. 1d). sharply increases at for while no anomaly is seen for , marking the development of a small FM component (), oriented in the -plane. The FM character of the transition is also reflected in the shift of the transition temperature () in an applied magnetic field up to (Fig. 1c): The anomaly shifts to lower temperatures reflecting the onset of antiferromagnetic (AFM) order while the transition moves to higher temperatures by , fortifying the idea of a FM transition. All presented measurements were repeated on samples from the same and other batches yielding consistent results.
In the light of the small entropies associated with the anomalies in it is highly desirable to apply a technique that magnetically probes the bulk of the sample to determine the volume fractions involved in the two transitions. To this end we performed Muon Spin Rotation () measurements at the Paul Scherrer Institut (PSI), Switzerland. We measured with and without external field in the ’slowly cooled’ and ’fast cooled’ state. If a small field ( in our case) is applied transverse to the muon spin polarization, only the muons which come to rest in non-magnetic regions of the sample will precess with a frequency . Muons stopping in magnetically ordered regions experience a superposition of the internal and external field resulting in a drastically different time evolution of the muon spin polarization. This enables us to map the development upon cooling of the magnetically ordered volume fraction as shown in Fig. 2a. It will be discussed in the following in the context of the internal magnetic fields seen in zero-field measurements, which provide a fingerprint for the identification of different magnetic phases. We obtained the dominant zero-field muon frequencies by fitting the time-domain spectra using standard procedures described elsewhere Bayrakci et al. 2004; Mendels et al. 2005; Sugiyama et al. 2003. Here we restrict ourselves to showing the frequency distribution obtained by Fourier transform (Fig. 2b).


The results of the transverse-field experiments imply that both cooling procedures result in a fully ordered sample volume at . However, the microscopic magnetic state of the sample is distinctly different depending on the cooling protocol as implied by both the transverse and zero field data shown in Fig. 2. The ’fast cooling’ protocol results in a magnetic state that develops at and is closely similar to the state previously reported for ’fast cooled’ samples Bayrakci et al. 2004; Bernhard et al. 2007 (three dominant muon frequencies at , and in zero field at ). Within experimental limits the entire sample volume is in this particular state and it remains essentially unchanged upon cooling from to (Fig. 2b). When the very same crystal is ’slowly cooled’, two distinct magnetic phases are sensed by the muons. The first one develops at and involves approximately of the sample volume. The details of the frequency distribution at in zero field are slightly different from the ’fast cooled’ phase (, and a dominant signal). In addition, the spectrum contains a significant Kubo-Toyabe contribution whose weight is consistent with the paramagnetic volume fraction as obtained in the transverse field measurements. The comparison with previous detailed studies on apperently ’fast cooled’ samples Bernhard et al. 2007 implies a Na content of for this phase. Below , magnetic order develops in the remaining of the sample volume causing a prominent change of the zero-field frequency distribution (Fig. 2b). Thus, the data suggest two distinct magnetically ordered phases to coexist at in the ’slowly cooled’ state with different Na content while a single magnetically ordered phase is observed in ’fast cooled’ samples.
We continue by analyzing the dependence of the magnetic feature on the cooling protocol. This is done by studying the magnetization as the magnetometer allows for convenient shock cooling. We minimized the equilibration time by choosing a small single crystal. A quenching cycle consisted of the following steps: a) Holding the sample at room temperature () for at least 20 minutes. b) Quenching it to a preset temperature (). c) Further cooling at and measuring between and to monitor the development of the magnetic phase.
A first essential observation was that quenching to any temperature below completely inhibits the transition while the transition is unaffected, but setting to yields a fully developed transition. For , waiting at before successive further cooldown enables the transition. Obviously, a distinct change happening in this narrow temperature range causes the formation of the magnetic phase. As we noticed a minute increase of the magnetization associated with this transition, we could follow its development in time. This was done by quenching the sample to and keeping it at while measuring over an extended period of time. The time evolution for a few selected is shown in Fig. 3a, the curve being an example of a complete time evolution. We followed for and observed a universal relative increase by . The lower is, the more time is needed for saturation. If the phase development is interrupted by further rapid cooling, the resulting FM component is smaller, indicating a smaller amount of magnetic phase. Fig. 3b shows the one-to-one correspondence between the degree of the transition around and the amount of resulting phase. Apparently, the phase grows with time by a diffusive process as suggested by the close agreement between the data and the broken lines in Fig. 3a, that represent solutions to the non-stationary diffusion equation with the time constant being the only parameter. This time constant increases more then tenfold upon cooling in the interval studied (Fig. 3c). The shock cooling experiments were repeated times on the same sample with excellent reproducibility. Other samples yielded compatible results with being sample-dependent.
We infer that diffusive sodium rearrangement near leads to the formation of the magnetic phase. Keeping in mind that the magnetic interplane coupling is determined by superexchange processes involving Na orbitals Johannes et al. 2005 it is consistent that a signature of ongoing Na rearrangement can be seen in the magnetization. The freezing of the time constant reflects the complex interplay between the intrinsic propensity to Na ordering and the temperature dependent mobility of the Na ions. It is desirable to directly probe the Na ions to confirm its dynamics. Indeed, in recent NMR studies on powder, various anomalies in the Na NMR spectrum were seen in a similar range Gavilano et al. 2004.
The result of the rearrangement is the coexistence of two distinct phases with different sodium content as revealed by . Knowing the volume ratio of for the crystals and for the stable phase from we conclude that for the stable phase. Phase separations have been invoked before to explain either the coexistence of multiple crystallographic phases or the presence of paramagnetic volume in otherwise magnetically ordered samples Huang et al. 2004b; de Vaulx et al. 2005; Sakurai et al. 2004. Here the actual process of phase separation is followed and the direct link to low temperature electronic instabilities is proven. Whether the driving force of the separation lies within the Na dynamics itself or is controlled by an instability of the electronic system towards charge ordering which in turn triggers the Na rearrangement is an interesting open question.

The Na rearrangement process around is remarkebly different from the well-documented Na ordering transition Roger et al. 2007. While we observe a specific heat anomaly at , we do not detect a signature around . However, using the high sensitivity of thermal expansion measurements (applying a miniature capacitive dilatometer developed at the TU Vienna Rotter et al. 1998) we did find a pronounced signal: The crystal expands by more than along the -axis upon cooling between and . We note that no feature is seen in the -plane (Fig. 4a). A sharp lambda-like anomaly marks the Na rearrangement in the c-axis’ thermal expansion coefficient. For comparison we show in Fig. 4b the expansion signal of the Na ordering in the same sample.
In conclusion we present evidence of a new magnetic transition below in (=0.80 and 0.85) involving a small ferromagnetic in-plane component. It is associated with the formation of two distinct magnetic phases of different Na content as implied by SR studies. The phase is stabilized by sufficiently slow cooling through the narrow temperature range around where diffusive Na rearrangement takes place. Thus the link between high- Na rearrangement and low- magnetic properties is established.
In analogy to other ionic ordering phenomena one could expect a hierarchy of successive rearrangement processes to happen, resulting in more than the two phases discussed above. In this light, the apparently unreconcilable reports on different AFM transition temperatures for the same nominal Na content (e.g. Mendels et al. 2005, Sakurai et al. 2004, Bayrakci et al. 2004, and Luo et al. 2004 for ) may well be the result of a variety of Na ordering patterns and their associated magnetic transitions. Having connected high- Na ordering and low- magnetism, the challenge will be twofold: To experimentally revisit the phase diagram Foo et al. 2004; Yoshizumi et al. 2007 making use of Na arrangement as an additional control parameter and further, in the broad context of correlated electron physics, to theoretically explore the interplay between narrow band itinerant electron behaviour and localization induced by the patterned Na potential.
We would like to thank H. Müller and M. Rotter for their help with the thermal expansion measurements and S. Katrych for performing XRD. This work is partly based on muon experiments performed at the Swiss Muon Source, Paul Scherrer Institut, Villigen (Switzerland).
References
- Terasaki et al. (1997) I. Terasaki, Y. Sasago, and K. Uchinokura, Phys. Rev. B 56, R12685 (1997).
- Lee et al. (2006) M. Lee et al., Nat. Mater. 5, 537 (2006).
- Takada et al. (2003) K. Takada et al., Nature 422, 53 (2003).
- Foo et al. (2004) M. L. Foo et al., Phys. Rev. Lett. 92, 247001 (2004).
- Boothroyd et al. (2004) A. T. Boothroyd et al., Phys. Rev. Lett. 92, 197201 (2004).
- Sales et al. (2004) B. C. Sales et al., Phys. Rev. B 70, 174419 (2004).
- Bayrakci et al. (2004) S. P. Bayrakci et al., Phys. Rev. B 69, 100410(R) (2004).
- Wooldridge et al. (2005) J. Wooldridge et al., J. Phys-Condens. Mat. 17, 707 (2005).
- Helme et al. (2006) L. M. Helme et al., Phys. Rev. B 73, 054405 (2006).
- Singh (2000) D. J. Singh, Phys. Rev. B 61, 13397 (2000).
- Indergand et al. (2005) M. Indergand et al., Phys. Rev. B 71, 214414 (2005).
- Mukhamedshin et al. (2005) I. R. Mukhamedshin et al., Phys. Rev. Lett. 94, 247602 (2005).
- Zandbergen et al. (2004) H. W. Zandbergen et al., Phys. Rev. B 70, 024101 (2004).
- Huang et al. (2004a) Q. Huang et al., Phys. Rev. B 70, 134115 (2004a).
- Roger et al. (2007) M. Roger et al., Nature 445, 631 (2007).
- Geck et al. (2006) J. Geck et al., Phys. Rev. Lett. 97, 106403 (2006).
- Zhang et al. (2005) P. H. Zhang et al., Phys. Rev. B 71, 153102 (2005).
- Prabhakaran et al. (2004) D. Prabhakaran et al., J. Cryst. Growth 271, 74 (2004).
- Motohashi et al. (2003) T. Motohashi et al., Phys. Rev. B 67, 064406 (2003).
- Mendels et al. (2005) P. Mendels et al., Phys. Rev. Lett. 94, 136403 (2005).
- Sugiyama et al. (2003) J. Sugiyama et al., Phys. Rev. B 67, 214420 (2003).
- Bernhard et al. (2007) C. Bernhard et al., Europhys. Lett. 80, 27005 (2007).
- Johannes et al. (2005) M. D. Johannes, I. I. Mazin, and D. J. Singh, Phys. Rev. B 71, 214410 (2005).
- Gavilano et al. (2004) J. L. Gavilano et al., Physica B 359, 1237-1239 (2005).
- Huang et al. (2004b) Q. Huang et al., Physical Review B 70, 184110 (2004b).
- de Vaulx et al. (2005) C. de Vaulx et al., Phys. Rev. Lett. 95, 186405 (2005).
- Sakurai et al. (2004) H. Sakurai et al., J. Phys. Soc. Jpn 73, 2081 (2004).
- Rotter et al. (1998) M. Rotter et al., Rev. Sci. Instrum. 69, 2742 (1998).
- Luo et al. (2004) J. L. Luo et al., Phys. Rev. Lett. 93, 187203 (2004).
- Yoshizumi et al. (2007) D. Yoshizumi et al., J. Phys. Soc. Jpn. 76, 063705 (2007).