Detection of broad 21-cm absorption at in the complex sight-line towards 3C 336Detection of broad 21-cm absorption at in the complex sight-line towards 3C 336–References2007
Abstract
We report the detection of 21-cm absorption at towards 1622+238 (3C 336). The line is very broad with a Full-Width Half Maximum (FWHM) of 235 , giving a velocity integrated optical depth of . The centroid of the line is offset from that of the known damped Lyman- absorption (DLA) system by , and if the Lyman- and 21-cm absorption are due to the same gas, we derive a spin temperature of K, which would be the lowest yet in a DLA. The wide profile, which is over four times wider than that of any other DLA, supports the hypothesis that the hydrogen absorption is occurring either in the disk of a large underluminous spiral or a group of dim unidentified galaxies, associated with the single object which has been optically identified at this redshift.
Keywords:
quasars: absorption lines – cosmology: observations – cosmology: early Universe – galaxies: ISM – galaxies: individual (3C 336)1 Introduction
Redshifted absorption systems lying along the sight-lines to distant quasars are important probes of the early-to-present day Universe. In particular, damped Lyman- absorption systems (DLAs), where , are useful as they account for at least 80% of the neutral gas mass density in the Universe (Prochaska et al. 2005). Since the Lyman- transition occurs in the ultra-violet band, direct ground based observations of this transition are restricted to redshifts of , although observations of the H i spin-flip transitions at cm can probe neutral hydrogen from , thereby providing a useful complement to the high redshift optical data. Furthermore, 21-cm observations can be used to confirm and complement reported variations in the fundamental constants over the history of the Universe (Murphy et al. 2003). Unfortunately, redshifted radio absorption systems are currently very rare with only 50 H i 21-cm absorption systems known (summarised in Curran et al. 2006), 17 of which are DLAs, with only nine of these having sufficiently high quality UV/optical and 21-cm data (Tzanavaris et al. 2007). We are therefore currently undertaking a survey of, as yet unsearched, DLAs occulting radio-loud quasars in order to increase the number of 21-cm absorbing systems and in this letter we report our first detection, in the intriguing DLA towards 1622+238 (3C 336).
2 Observations and Data Reduction
The observations were performed on 9–10 July 2006 with the Westerbork Synthesis Radio Telescope (WSRT) as part of our survey (described in Curran et al. 2007). The front-end was the UHF-high receiver tuned to 857.68 MHz (or , Rao & Turnshek 2000), backed with a band-width of 5 MHz over 2048 channels (dual polarisation), giving a channel width of 0.85 . The two orthogonal polarisations (XX & YY) were used in order to allow the removal of any polarisation-dependent radio frequency interference (RFI). After the flagging out of time-dependent RFI, 12.0 hours of good data remained, although there was some RFI remaining on some baselines, particularly in the XX polarisation. After further flagging, 63 full and partial baseline pairs remained. Additionally, frequencies below 856.6 MHz (channels above 1500) were removed due to a steep 1 Jy dip in the flux.
The data were reduced using the miriad interferometry reduction package, with which we extracted a summed spectrum from the emission region of the continuum map. Upon this, we found absorption towards the peak of the radio continuum apparent in both polarisations. After subtracting the continuum with a first order polynomial from the line free channels of the combined polarisations, a single Gaussian gives the fit shown in Fig. 1.
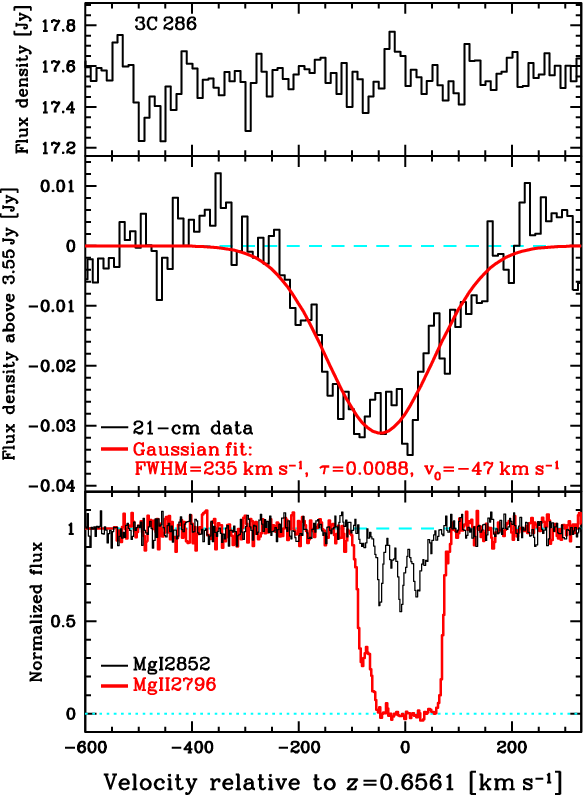
The obvious caveat with the detection is the lack of flat baseline in the spectrum above due to the lost channels. However, the spectra obtained in each individual polarisation are fitted by very similar Gaussians. Furthermore, if instead we use 3C 286 for the bandpass calibration, which was observed at the start of the run, rather than 3C 48, which was observed at the end, the data give very similar profiles (again with the 1 Jy dip in the flux below 856.6 MHz), which are fitted by the same Gaussian parameters as before. As would be expected from a real feature towards an unresolved () background source, the line is present in the centre and surrounding pixels, but disappears with increasing proximity from the centre pixel. We also produced a cube in which 1622+238 is offset from the phase centre: While the absorption was still apparent towards 1622+238, no feature was seen at the phase centre. As a further check, we used 3C 48 to bandpass calibrate 3C 286, and, as seen from Fig. 1 (top panel), there is no overall ripple in the spectrum.
3 Results and Discussion
3.1 Observational results
At , the peak optical depth is at the lower end of the DLAs detected in 21-cm absorption (table 1 of Curran et al. 2005), although the large line-width gives a velocity integrated optical depth of , which takes it to joint 5th place in the line strength stakes (Table 1). In the optically thin regime (), the total atomic hydrogen column density, [], of the absorbing gas in a homogeneous cloud is related to the velocity integrated optical depth of the 21-cm line via
| (1) |
where [K] is the spin temperature of the gas, is the covering factor of the flux by the absorber and is the velocity integrated optical depth of the 21-cm absorption. If the 21-cm and Lyman- absorption arise in the same cloud complexes, the total neutral hydrogen column density of (Rao & Turnshek 2000), gives K, the lowest value yet detected in a redshifted source (Table 1).
| QSO | ID | Ref. | ||||
| 1622+238a | 0.6561 | 2.2 | 20.4 | – | 60 | C07 |
| 0809+483b | 0.4369 | 0.89 | 20.2 | S | 120 | BM83 |
| 0235+164 | 0.523385 | 14 | 21.7 | S | 200 | R76 |
| 1629+120 | 0.5318 | 0.49 | 20.5 | S | 310 | KC03 |
| 0458–020 | 2.03945 | 7.2 | 21.7 | U | 380 | W85 |
| 0827+243 | 0.5247 | 0.26 | 20.3 | S | 420 | KC01 |
| 1229–021 | 0.39498 | 0.66 | 20.8 | S | 520 | BS79 |
| 1127–145 | 0.3127 | 2.7 | 21.7 | L | 1000 | L98,CK00 |
| 1328+307c | 0.692154 | 0.93 | 21.3 | L | 1200 | BR73 |
| 0738+313 | 0.2212 | 0.34 | 20.8 | D | 1300 | L98 |
| 0438–436 | 2.347 | 0.22 | 20.8 | U | 1600 | K06 |
| 1157+014 | 1.94362 | 2.2 | 21.8 | L | 1600 | W81 |
| 0201+113 | 3.386 | 0.71 | 21.3 | U | 2000 | K07 |
| 0952+179 | 0.2378 | 0.11 | 21.3 | L | 9900 | KC01 |
| 0248+430 | 0.394 | 3.0 | – | U | – | LB01 |
| 2351+456 | 0.779452 | 13 | – | U | – | D04 |
Notes: a3C 336, b3C 196, c3C 286.
References: BR73: Brown & Roberts 1973, R76: Roberts et al. 1976, BS79: Brown & Spencer 1979, W81: Wolfe et al. 1981; BM83: Brown & Mitchell 1983, W85: Wolfe et al. 1985, L98: Lane et al. 1998, CK00: Chengalur & Kanekar 2000, KC01: Kanekar & Chengalur 2001, LB01: Lane & Briggs 2001, KC03: Kanekar & Chengalur 2003, D04: Darling et al. 2004, K06: Kanekar et al. 2006, K07: Kanekar et al. 2007, C07: This paper.
Since both the spin temperature and covering factor are generally unknown, the degeneracy in the ratio is best left intact (Curran et al. 2005; Curran & Webb 2006), although for (by definition) this means that K.
The 21-cm absorption profile in this absorber is much wider than that found in other DLAs ( , see table 1 of Curran et al. 2005) and more like the typical H i emission profile of a galaxy (e.g. Koribalski, et al. 2004). We note also, in the other DLAs the 21-cm profile-width is always narrower than the metal-ion lines (typically FWHM, Curran et al. 2007), but in this case FWHM, which suggests very different kinematics from those of the typical DLA. In fact, for other DLAs the spin temperature is often compared with the kinetic temperature (e.g. Lane & Briggs 2001), which should be equivalent for single cloud in thermodynamic equilibrium. Applying to 1622+238 gives the unphysical K, confirming that kinematical motions are chiefly responsible for the wide profile.
3.2 The nature of the absorber towards 1622+238
3.2.1 Possible absorber hosts
In Fig. 2 we show the HST WFPC2 (F702W filter) optical image of the field towards 3C 336 () overlaid with the radio maps. Although there is compact 8.4 GHz emission from the QSO itself, most of the radio emission is from the extended lobes, which span an enormous (Bridle et al. 1994; Cheung et al. 2005).

The DLA towards this QSO is somewhat of a mystery, since the only galaxy in the HST field with a redshift of must have a projected disk impact parameter of kpc (Steidel et al. 1997). Since no other galaxy within this impact parameter has ever been found, Steidel et al. 1997 suggest, but stipulate as unlikely, that the absorption may be due to an under-luminous late-type spiral, in which an invisible disk spans at least all of the way from the identified galaxy to the QSO sight-line.
As an alternative, the authors suggest that there may be other galaxies within this impact parameter, although as these are undetected, they would have to be extremely faint (). Another possibility is offered by the galaxy of unknown redshift close to the optical hotspot, or even the hotspot itself, both of which are located close to a radio lobe sight-line (Cheung et al. 2005). If these (and perhaps some other low luminosity galaxies), were part of a group, which included the galaxy, the redshift criterion would be satisfied, while perhaps providing a large H i reservoir located closer to the QSO sight-line. Furthermore, the H i could be largely dispersed over the region through the mutual tidal interactions of these galaxies (Steidel et al. 1997).
3.2.2 Implications of the 21-cm absorption
From Fig. 2, we see that, although the identified galaxy is located close to the sight-line of a radio lobe, it remains sufficiently remote to be covering a negligible amount of flux11 1 Although we would expect the 1420 MHz emission in the rest frame of the galaxy (858 MHz) to be further extended than the 21-cm emission measured in our rest frame.. Although we cannot determine the location of the absorbing region within the radio-bright region, we may obtain an estimate of its extent: The circular region centered on the galaxy represents the physical area which encompasses 0.88% of the total 858 MHz flux. That is, this is the smallest region that can give the observed optical depth. So although the visible feature identified as the galaxy does not intercept much radio flux, a cold, invisible disk of kpc (3.3′′) radius could cover significant radio emission (as shown in the figure), although, as per the reservations of Steidel et al. 1997, it may not necessarily be centered upon this galaxy. In fact, the 21-cm and Lyman- absorption may not be coincident with one another, in light of the relative profile widths and offset in the profiles (Fig. 1).
For a zero intrinsic velocity offset, one can estimate the variability of the constant , where is the fine structure constant, the proton -factor and is the electron-to-proton mass ratio. In such a case, the relative change in the value of between redshift and a terrestrial () value is given by (e.g. Tubbs & Wolfe 1980)
| (2) |
where and represent the observed absorption redshifts for 21-cm and a UV heavy-element transition, respectively. Using the Gaussian fit centroid, , and the stongest Mg i component, , we obtain . This is an order of magnitude larger than any of the eleven other values which have been determined (see figure 1 of Tzanavaris et al. 2007), suggesting that the velocity offset between the 21-cm and UV absorption is not primarily due to the values of the fundamental constants at .
Therefore the observed km s-1 velocity difference, in conjunction with the atypical 21-cm line-width, suggests a physical offset between the cold, 21-cm absorbing, and warm, UV absorbing, gas. However, although not completely coincident, hydrogen is observed in both regimes, within the same field (possibly remote from the QSO sight-line), at (nearly) the same redshift, and so we find it unlikely that the radio and UV absorption are not related in some way. The width of the 21-cm absorption in comparison to the optical lines, and that of other DLAs, may be the result of an atypical situation where we have an extended absorber occulting an extended radio source. However, all of the known DLAs associated with spiral galaxies also occult large radio sources (figure 4 of Curran et al. 2005). Furthermore, although located much closer to the spirals than the other DLAs in terms of , due to the wide profile, the 21-cm absorption towards 1622+238 may be somewhat of an anomaly (Fig. 3)22 2 Note that if FWHM, as per the other DLAs, would be K, placing this bang in the middle of the spirals in Fig. 3..

If the system is bound and the wide 21-cm profile is purely the result of rotational broadening (i.e. not an outflow), the total line-width of , leads to a dynamical mass estimate of M⊙, where [kpc] is the edge of the cold H i distribution [or the 858 MHz emission, whichever comes first]. In the case where this gas is located close to the QSO sight-line, so that the identified galaxy is actually near the edge of the absorbing disk or group33 3 Assuming is the inclination of the most rapidly orbiting galaxies and neglecting their individual rotations., i.e. kpc (Chen et al. 1998), the dynamical mass becomes M⊙. If the gas is due to a large spiral, centered on the galaxy44 4 Which may be indicated by the single Gaussian fit, although signal-to-noise ratio of the spectrum (Fig. 1) is far too low to resolve possible contributions from smaller discrete galaxies., by assuming circular motions and the same inclination as the visible “nucleus” (55∘, Chen et al. 1998), the deprojected velocities and impact parameter give M⊙ (for kpc). Although large, the derived masses are close to the values derived for the two most local spirals, the Milky Way ( M⊙, Wilkinson & Evans 1999) and M31 ( M⊙, Evans et al. 2000), and certainly reasonable for a group of smaller galaxies.
Combining this dynamical mass with the luminosity of (Steidel et al. 1997)55 5 Note that, from local studies, the vast majority (87%) of DLAs are believed to be due to galaxies of luminosities (Zwaan et al. 2005)., gives a mass-to-light ratio of M⊙/L⊙. Such ratios ( M⊙/L⊙), define the hypothesised low density galaxies (LDGs), which can range in mass from to M⊙ (Jimenez et al. 1997). In an LDG a low density disk resides in a dark halo, with the surface density below that required by the Toomre criterion for instabilities to form ( , Jimenez et al. 1997; Verde et al. 2002), and so there is no ongoing star formation: From deep HST H imaging, Bouché et al. 2001 determine a star formation rate of M⊙ yr-1 kpc-2 in the 3C 336 field. Another possible example of an LDG may already have been observed as the “dark hydrogen cloud”, VIRGOHI 21 in the Virgo Cluster (Minchin et al. 2005). This has a mass-to-light ratio of M⊙/L⊙ and spans at least 16 kpc in extent. If it is a galaxy, this has a mass of M⊙, although, as may be the case towards 1622+238, the large amount of gas could be due to tidal debris. Where ever the H i (Ly- & 21-cm) absorption arises towards 1622+238, it is clear that this would not be the first time a large amount of unidentified neutral hydrogen has been detected.
4 Summary
We have detected 21-cm absorption in the damped Lyman- absorber towards 1622+238 (3C 336). If the absorption arises in the same gas as the Lyman- absorption, the spin temperature of the gas is K, the lowest yet found in a DLA. The low spin temperature is a consequence of the extremely wide profile, which, most atypically, is wider than the Mg ii line. This could be due to a large absorber occulting what we know to be large radio source. The 21-cm is also offset from the unsaturated Mg i absorption by , which corresponds to (), which is an order of magnitude larger than that expected from other DLAs, suggesting that the offset is not dominated by different values of the fundamental constants at . It may indicate, instead, that the radio and UV absorption are unrelated, although a lower Lyman- column density would give gas significantly colder than 60 K. Furthermore, it seems somewhat strange that the hydrogen absorbers detected in two different regimes at the same redshift would be unrelated, especially considering that none of these seems to arise directly along the QSO sight-line. Regarding this, our results cannot distinguish from where the hydrogen absorption arises, whether this be the disk of a large underluminous spiral, an extremely faint galaxy lying close to the QSO sight-line or a possible tidal interaction, between other faint galaxies, which is dragging significant amounts of gas across the sight-line.
Acknowledgments
We would like to thank Raffaella Morganti for coordinating the WSRT observations, Alan Bridle and Teddy Cheung for their radio images, and Bob Carswell, Martin Zwaan, Steve Longmore, Alan Pedlar, Rob Beswick, Matt Owers and Matthew Whiting for their advice. This research has made use of the NASA/IPAC Extragalactic Database (NED) which is operated by the Jet Propulsion Laboratory, California Institute of Technology, under contract with the National Aeronautics and Space Administration. This research has also made use of NASA’s Astrophysics Data System Bibliographic Services.
References
- Bouché et al. (2001) Bouché N., Lowenthal J. D., Charlton J. C., Bershady M. A., Churchill C. W., Steidel C. C., 2001, ApJ, 550, 585
- Bridle et al. (1994) Bridle A. H., Hough D. H., Lonsdale C. J., Burns J. O., Laing R. A., 1994, AJ, 108, 766
- Brown & Mitchell (1983) Brown R. L., Mitchell K. J., 1983, ApJ, 264, 87
- Brown & Roberts (1973) Brown R. L., Roberts M. S., 1973, ApJ, 184, L7
- Brown & Spencer (1979) Brown R. L., Spencer R. E., 1979, ApJ, 230, L1
- Chen et al. (1998) Chen H., Lanzetta K. M., Webb J. K., Barcons X., 1998, ApJ, 498, 77
- Chengalur & Kanekar (2000) Chengalur J. N., Kanekar N., 2000, MNRAS, 318, 303
- Cheung et al. (2005) Cheung C. C., Wardle J. F. C., Chen T., 2005, ApJ, 628, 104
- Curran et al. (2005) Curran S. J., Murphy M. T., Pihlström Y. M., Webb J. K., Purcell C. R., 2005, MNRAS, 356, 1509
- Curran et al. (2007) Curran S. J., Tzanavaris P., Pihlström Y. M., Webb J. K., 2007, MNRAS, submitted
- Curran & Webb (2006) Curran S. J., Webb J. K., 2006, MNRAS, 371, 356
- Curran et al. (2002) Curran S. J., Webb J. K., Murphy M. T., Bandiera R., Corbelli E., Flambaum V. V., 2002, PASA, 19, 455
- Curran et al. (2006) Curran S. J., Whiting M., Murphy M. T., Webb J. K., Longmore S. N., Pihlström Y. M., Athreya R., Blake C., 2006, MNRAS, 371, 431
- Darling et al. (2004) Darling J., Giovanelli R., Haynes M. P., Bower G. C., Bolatto A. D., 2004, ApJ, 613, L101
- Evans et al. (2000) Evans N. W., Wilkinson M. I., Guhathakurta P., Grebel E. K., Vogt S. S., 2000, ApJ, 540, L9
- Jimenez et al. (1997) Jimenez R., Heavens A. F., Hawkins M. R. S., Padoan P., 1997, MNRAS, 292, L5
- Kanekar & Chengalur (2001) Kanekar N., Chengalur J. N., 2001, A&A, 369, 42
- Kanekar & Chengalur (2003) Kanekar N., Chengalur J. N., 2003, A&A, 399, 857
- Kanekar et al. (2007) Kanekar N., Chengalur J. N., Lane W. M., 2007, MNRAS, 375, 1528
- Kanekar et al. (2006) Kanekar N., Subrahmanyan R., Ellison S. L., Lane W., Chengalur J. N., 2006, MNRAS, 370, L46
- Koribalski, et al. (2004) Koribalski B. S., et al., 2004, AJ, 128, 16
- Lane et al. (1998) Lane W., Smette A., Briggs F. H., Rao S. M., Turnshek D. A., Meylan G., 1998, AJ, 116, 26
- Lane & Briggs (2001) Lane W. M., Briggs F. H., 2001, ApJ, 561, L27
- Minchin et al. (2005) Minchin R., et al., 2005, ApJ, 622, L21
- Murphy et al. (2003) Murphy M. T., Webb J. K., Flambaum V. V., 2003, MNRAS, 345, 609
- Prochaska et al. (2005) Prochaska J. X., Herbert-Fort S., Wolfe A. M., 2005, ApJ, 635, 123
- Rao & Turnshek (2000) Rao S. M., Turnshek D. A., 2000, ApJS, 130, 1
- Roberts et al. (1976) Roberts M. S., Brown R. L., Brundage W. D., Rots A. H., Haynes M. P., Wolfe A. M., 1976, AJ, 81, 293
- Steidel et al. (1997) Steidel C. C., Dickinson M., Meyer D. M., Adelberger K. L., Sembach K. R., 1997, ApJ, 480, 568
- Tubbs & Wolfe (1980) Tubbs A. D., Wolfe A. M., 1980, ApJ, 236, L105
- Tzanavaris et al. (2007) Tzanavaris P., Murphy M. T., Webb J. K., Flambaum V. V., Curran S. J., 2007, MNRAS, 374, 634
- Verde et al. (2002) Verde L., Oh S. P., Jimenez R., 2002, MNRAS, 336, 541
- Wilkinson & Evans (1999) Wilkinson M. I., Evans N. W., 1999, MNRAS, 310, 645
- Wolfe et al. (1981) Wolfe A. M., Briggs F. H., Jauncey D. L., 1981, ApJ, 248, 460
- Wolfe et al. (1985) Wolfe A. M., Briggs F. H., Turnshek D. A., Davis M. M., Smith H. E., Cohen R. D., 1985, ApJ, 294, L67
- Zwaan et al. (2005) Zwaan M. A., van der Hulst J. M., Briggs F. H., Verheijen M. A. W., Ryan-Weber E. V., 2005, MNRAS, 364, 1467