Measurement of the energy spectrum using data from the Pierre Auger Observatory
Measurement of the UHECR energy spectrum using data from the Surface Detector of the Pierre Auger Observatory
Abstract
At the southern site of the Pierre Auger Observatory, which is close to completion, an exposure that significantly exceeds the largest forerunner experiments has already been accumulated. We report a measurement of the cosmic ray energy spectrum based on the high statistics collected by the surface detector. The methods developed to determine the spectrum from reconstructed observables are described. The energy calibration of the observables, which exploits the correlation of surface detector data with fluorescence measurements in hybrid events, is presented in detail. The methods are simple and robust, exploiting the combination of fluorescence detector (FD) and surface detector (SD) and do not rely on detailed numerical simulation or any assumption about the chemical composition. Besides presenting statistical uncertainties, we address the impact of systematic uncertainties.
1 Introduction
The Pierre Auger Observatory [1] is designed to measure the extensive air showers produced by the highest energy cosmic rays ( eV) with the goal of discovering their origins and composition. Two different techniques are used to detect air showers. Firstly, a collection of telescopes is used to sense the fluorescence light produced by excitation of nitrogen induced by the cascade of particles in the atmosphere. The FD provides a nearly calorimetric, model-independent energy measurement, because the fluorescence light is produced in proportion to energy dissipation by a shower in the atmosphere [2, 3]. This method can be used only when the sky is moonless and dark, and thus has roughly a 10% duty cycle [4]. The second method uses an array of detectors on the ground to sample particle densities as the air shower arrives at the Earth’s surface. The surface detector has a 100% duty cycle [5]. A subsample of air showers detected by both instruments, dubbed hybrid events, are very precisely measured [6] and provide an invaluable energy calibration tool. Hybrid events make it possible to relate the shower energy (FD) to the ground parameter .
2 Analysis procedure
The parameter characterises the energy of a cosmic ray shower detected by the SD array and is the signal in units of VEM that would be produced in a tank at a distance of 1000 m from the shower axis. One VEM is the signal produced by a single relativistic muon passing vertically through the centre of a water tank. A likelihood method is applied to obtain the lateral distribution function, where the shower axis, and the curvature of the shower front are determined [7]. The selection criteria are such to ensure the rejection of accidental triggers (physics trigger) and the events are well contained in the SD array (quality trigger), i.e. we require that all six nearest neighbours of the station with the highest signal be active. In this way we guarantee that the core of the shower is contained inside the array and enough of the shower is sampled to make an S(1000) measurement.

The present data set is taken from 1 January, 2004 through 28 February, 2007 while the array has been growing in size. To ensure an excellent data quality we remove periods with problems due to failures in data acquisition, due to lightning and hardware difficulties. We select events only if the zenith angle is less than and the reconstructed energy is above 3 EeV. For this analysis, the array is fully efficient for detecting such showers, so the acceptance at any time is solely determined by the geometric aperture of the array [8]. The integrated exposure mounts up to about , which is a factor of more than 3 larger than the exposure obtained by the largest forerunner experiment AGASA [9]. Moreover the present acceptance exceeds the one given in [10] by a factor of about 3. For a given energy the value of decreases with zenith angle, , due to attenuation of the shower particles and geometrical effects. Assuming an isotropic flux for the whole energy range considered, i.e. the intensity distribution is uniform when binned in , we extract the shape of the attenuation curve from the data. In Figure 1 several intensities, , above a given value of are shown as a function of . The choice of the threshold is not critical since the shape is nearly the same within the statistical limit. The fitted attenuation curve, , is a quadratic function of as displayed in Figure 2 for a particular constant intensity cut, , with and . The cut corresponds to a shower size of about and

equivalently to an energy of about 9 EeV. Since the average angle is we take this angle as reference and convert into by . It may be regarded as the signal the shower would have produced had it arrived at . The reconstruction accuracy of the parameter , , comprises 3 contributions and these are taken into account in inferring and its uncertainty : a statistical uncertainty due to the finite size of the detector and the limited dynamic range of the signal detection, a systematic uncertainty due to the assumptions of the shape of the lateral distribution and finally due to the shower-to-shower fluctuations [11]. To infer the energy we have to establish the relation between and the calorimetric energy measurement, . A set of hybrid events of high quality is selected based on the criteria reported in [6] without applying the cut on the field of view, which appears to have a negligible effect for the topic addressed here. A small correction to account for the energy carried away by high energy muons and neutrinos, the so-called invisible energy, depends slightly on mass and hadronic model. The applied correction is based on the average for proton and iron showers simulated with the QGSJet model and sums up to about and its systematic uncertainty contributes to the total uncertainty in FD energy [3]. Moreover the SD quality cuts described above are applied. The criteria include a measurement of the vertical aerosol optical depth profile (VAOD(h)) [12] using laser shots generated by the central laser facility (CLF) [13] and observed by the FD in the same hour of each selected hybrid event.

The selected hybrid events were used to calibrate the SD energy. The following procedure was adopted. For each hybrid event, with measured FD energy , the SD energy estimator was determined from the measured by using the constant intensity method described above. For each event the uncertainty in is estimated by summing in quadrature three contributions: the uncertainty in the constant intensity parametrization, , the angular accuracy of the event, , and the uncertainty in the measured , . The fluorescence yield used to estimate the energy is taken from [14]. An uncertainty in the FD energy, , was also assigned to each event. Several sources were considered. The uncertainty in the hybrid shower geometry, the statistical uncertainty in the Gaisser-Hillas fit to the profile of the energy deposits and the statistical uncertainty in the invisible energy correction were fully propageted. The uncertainty in the VAOD measurement was also propagated to the FD energy on an event-by-event basis, by evaluating the FD energy shift obtained when changing the VAOD profile by its uncertainty. These individual contributions were considered to be uncorrelated, and were thus combined in quadrature to obtain . The data appear to be well described by a linear relation (see Figure 3). A linear least square fit of the data was performed. To avoid possible biases, low energy events, below the dashed line, which is orthogonal to the best fit line and intersects it at , were not included in the fit.
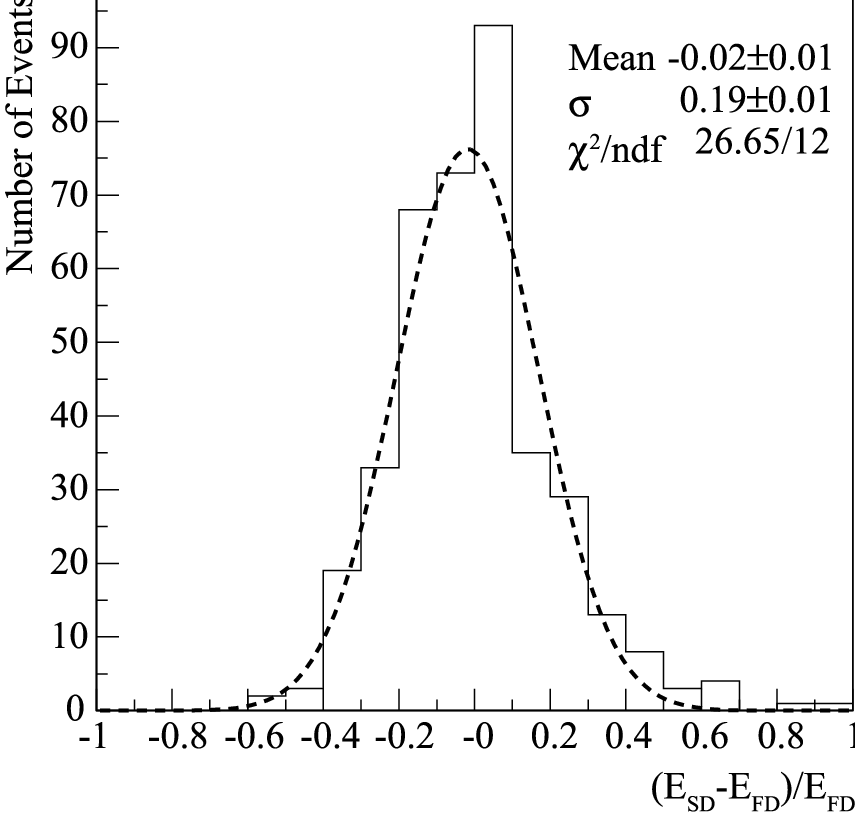
An iterative procedure was used to determine the dashed line, and it was checked that the results of the fit were stable. The best fit yields and with a reduced of 1.3 for The relative statistical uncertainty in the derived SD energy, , is rather small, e.g. of the order of 5% at eV. The energy spectrum is displayed in Figure 5 together with its statistical uncertainty. The individual systematic uncertainties in determining coming from the FD sum up to 22%. For illustrative purposes we show in Figure 6 the difference of the flux with respect to an assumed flux . The largest uncertainties are given by the absolute fluorescence yield (14%), the absolute calibration of the FD (9.5%) and the reconstruction method (10%).

The uncertainty due to the dependence of the fluorescence spectrum on pressure (1%), humidity (5%) and temperature (5%) are take into account as well as the wavelength dependent response of the FD, the aerosol phase function, invisible energy and others, which are well below 4% (see [4] for details).
3 Discussion and outlook
When inferring the energy spectrum from SD data we utilise the constant intensity method to calibrate the SD data. The systematic uncertainties have been scrutinised and the resulting spectrum is given. Several activities are on-going to reduce the systematic uncertainties of the energy estimate, e.g. the detector calibration uncertainty and the uncertainty of the fluorescence yield.

Reducing these uncertainties will make it desirable to deconvolve the energy spectrum using the estimate of the energy resolution. The presented spectrum is compared with a spectrum derived on basis of hybrid data only in T. Yamamoto et al. [15]. Astrophysical implications are also discussed there.
References
- [1] J. Abraham [Pierre Auger Collaboration], NIM 523 (2004) 50.
- [2] M. Risse and D. Heck, Astropart. Phys. 20 (2004) 661.
- [3] H. Barbosa et al., Astropart. Phys. 22 (2004) 159.
- [4] B. Dawson [Pierre Auger Collaboration] these proceedings, (2007), #0976.
- [5] T. Suomijarvi [Pierre Auger Collaboration] these proceedings, (2007) #0299.
- [6] L. Perrone [Pierre Auger Collaboration] these proceedings (2007), #0316.
- [7] D. Barnhill [Pierre Auger Collaboration], Proc. ICRC, Pune (2005), 7, 291.
- [8] D. Allard [Pierre Auger Collaboration], Proc. ICRC, Pune (2005), 7, 71.
- [9] M. Takeda et al., Astropart. Phys. 19 (2003) 447.
- [10] P. Sommers [Pierre Auger Collaboration], Proc. ICRC, Pune (2005) 7, 387.
- [11] M. Ave [Pierre Auger Collaboration] these proceedings, (2007), #0297.
- [12] S. Ben-Zvi [Pierre Auger Collaboration] these proceedings, (2007) #0399.
- [13] B. Fick et al., JINST, 1 (2006) 11003.
- [14] M. Nagano, K. Kobayakawa, N. Sakaki, K. Ando, Astropart. Phys. 22 (2004) 235.
- [15] T. Yamamoto [Pierre Auger Collaboration] these proceedings, (2007) #0318.