Lensing, reddening and extinction effects
of MgII absorbers
from to
Abstract
Using a sample of almost strong MgII absorbers with detected in the SDSS DR4 dataset, we investigate the gravitational lensing and dust extinction effects they induce on background quasars. After carefully quantifying several selection biases, we isolate the reddening effects as a function of redshift and absorber rest equivalent width, . We find the amount of dust to increase with cosmic time as , following the evolution of cosmic star density or integrated star formation rate. We measure the reddening effects over a factor in E(B–V) and we find that , providing us with an important scaling for theoretical modeling of metal absorbers. We also measure the dust-to-metals ratio and find it similar to that of the Milky Way. In contrast to previous studies, we do not detect any gravitational magnification by MgII systems. We measure the upper limit and discuss the origin of the discrepancy. Finally, we estimate the fraction of absorbers missed due to extinction effects and show that it rises from 1 to 50% in the range Å. We parametrize this effect and provide a correction for recovering the intrinsic distribution.
Subject headings
quasars – absorbers: MgII – gravitational lensing: statistical – reddening – dustI. Introduction
Quasar absorption lines provide us with a unique tool to probe the gas content in the Universe. They offer an unmatched sensitivity up to high redshift, allow us to detect arbitrarily faint objects, and constrain the gas distribution in velocity space. However, the lack of direct spatial information tends to be a limitation for understanding the nature of these systems and fundamental questions still remain. One way to overcome this problem is to relate the gas distribution to that of other components such as dark matter, stars and dust by measuring their cross-correlations.
Galactic environments have been studied using various types of absorption lines. Among metal lines, the MgII doublet, Å, has been extensively used due to the strength and wavelength of the transitions making it easily detectable from the ground at (Lanzetta et al. 1987; Steidel & Sargent 1992; Nestor et al. 2005; Prochter et al. 2006). MgII turns out to be a sensitive tracer of galactic environment: it arises in gas spanning more than five decades of neutral hydrogen column density (e.g. Churchill et al. 2000), and it has been shown that the detection of a strong MgII absorber indicates the presence of a nearby galaxy along the line-of-sight (Bergeron & Boissé 1991; Steidel et al. 1994; Bergeron et al. 1992; Le Brun et al. 1993; Steidel et al. 1994; Steidel et al. 1997), and at low redshift Rao et al. 2006 have shown that strong MgII absorbers are good tracers of Damped Lyman alpha systems. For reviews of the progress on the determination of these systems, see Tripp & Bowen 2005 and Churchill et al. 2005.
Recently, the size and homogeneity the SDSS has allowed several statistical analyzes to be done: Bouché et al. 2006 measured the cross-correlation between luminous red galaxies and MgII absorbers. Zibetti et al. 2005; Zibetti et al. 2007 investigated the distribution of absorber impact parameters and the emission properties of MgII related galaxies. They have shown that a cross-correlation between light and gas can be detected up to 200 kpc and that stronger absorbers are related to bluer galaxies. The SDSS has also provided us with closely separated quasar pairs allowing us to analyze the spectrum of background quasars to probe the gas distribution around foreground ones (Bowen et al. 2006; Bowen et al. 2007). Such a technique allows us to compare the gaseous halos of quasars and galaxies and it can ultimately be used to test the quasar unification scheme on large scales (Chelouche et al. 2007).
However, despite significant observational progress fundamental questions such as the nature of the gas seen in absorption and its spatial distribution still remain. More importantly, we still do not understand the process(es) responsible for the observed values of MgII rest equivalent widths. As strong MgII absorbers are known to be tracers of galaxies, they are expected to induce gravitational lensing and reddening effects to the light of their background quasars. Correlations between quasar magnitudes and the presence or strength of metal lines can therefore be used in order to quantify the relationships between gas, dark matter and dust. Such an approach also allows us to quantify the extinction and magnification biases in samples of optically selected quasars.
I.1. Dust reddening
The presence of dust associated with various types of absorbers has been reported by many authors: Pei et al. 1991 & Pei 1992 found quasars with DLAs to be on average redder than quasars without. Richards et al. 2001 observed a similar effect with CIV absorption lines. Using the 2dF survey Ménard & Péroux 2003 found evidence of reddening due to strong MgII systems. Hopkins et al. 2004 showed that a fraction of SDSS quasars are reddened with SMC-type dust and argued that this effect comes predominantly from dust located at the quasar redshifts. Using the SDSS database, Wild & Hewett 2005; Wild et al. 2006 found an E(B-V) associated with CaII absorbers, and York et al. 2006 & Khare et al. 2005 measured the mean reddening effects of about 800 quasars with MgII absorbers. Constraints on dust can also be obtained by measuring the relative abundances of volatile and refractory elements in order to infer a depletion level (e.g. Vladilo & Péroux 2005; Vladilo et al. 2006; Nestor et al. 2003).
While the presence of dust reddening associated with metal absorbers has been convincingly shown, its detailed properties (dependencies on redshift, rest equivalent width, etc.) need to be quantified in order to understand the underlying physics and connect theory to observations.
The presence of dust along given lines-of-sight also implies the existence of a dust obscuration bias that can affect quasar and absorber number counts. Using 75 radio-selected quasars, Ellison et al. 2004 investigated such an effect and did not find any difference (at the 20% level) between the incidence of MgII absorbers in radio-selected and optically-selected quasars. This result shows that in general optically-selected quasars are not strongly affected by an extinction bias, but it does not provide us with the full information: it does not show how the shape of the observed distribution of absorber rest equivalent widths is affected by dust extinction.
In order to unveil the relationships between extinction and absorption properties, we present a new analysis based on the Sloan Digital Sky Survey (SDSS, York et al. 2000) using the fourth data release (DR4). After having quantified the efficiency of the SDSS pipeline to detect reddened quasars, we use a sample of about 7,000 MgII absorbers – i.e. almost an order of magnitude larger than previous studies – to measure the excess reddening induced by these systems and investigate its dependence on absorption rest equivalent width and redshift.
I.2. Gravitational lensing
In addition to cause reddening effects, the presence of a galaxy along the line-of-sight is expected to give rise to gravitational lensing effects. Several cases of strong gravitational lensing of quasars due to an absorbing galaxy are known (e.g. Turnshek et al. 1997). However, in general, the impact parameters of MgII absorbers are larger than a few kpc and gravitational lensing effects occur in the weak regime and solely change quasar magnitudes (Bartelmann & Loeb 1996; Perna et al. 1997; Smette et al. 1997; Bartelmann & Loeb 1998; Ménard 2005). The detection of such an effect would ultimately allow us to constrain the mass of MgII systems.
Several authors have attempted to detect the statistical magnification induced by MgII systems. Some have looked for redshift distribution changes (Thomas & Webster 1990; Borgeest & Mehlert 1993) but did not find any compelling evidence for gravitational lensing. Others have investigated the occurrence of metal absorbers (CIV, SiIV, MgII) on bright and faint quasars (York et al. 1991; Vanden Berk et al. 1996; Richards et al. 1999) and reported possible magnification effects for certain absorber species only. Ménard & Péroux 2003 used the 2dF-Quasar survey to compare the number of quasars with and without MgII absorbers as a function of magnitude and reported a relative excess of optically bright radio-selected quasars with absorbers as well as indications of reddening effects. Murphy & Liske (2004) applied the same method to a sample of Damped Lyman- systems and reported a similar trend found at 2. Using radio-selected quasars, Ellison et al. 2004 reported a possible excess of optically bright quasars with MgII absorbers, and more recently Prochaska et al. 2005 found that quasars with high-redshift DLAs are on average brighter than quasars without. The various results found among all these analyzes turn out to be rather difficult to combine because the absorber species, redshift and equivalent width ranges differ. In addition, as noted in some of these analyzes, biases due to selection effects can mimic the lensing signal: it is easier to detect absorption lines in high quality (or high S/N) spectra, however, these spectra tend to correspond to bright objects. This selection bias results in a preference for detecting absorption lines in brighter quasars, which is an effect similar to the signal of interest. Unfortunately, none of these works could convincingly demonstrate that the level of such systematics was sufficiently low in their analysis, leaving the amplitude of lensing effects rather uncertain.
In this paper we attempt to make a significant improvement in making such a measurement by overcoming the problem of systematic effects using Monte Carlo simulations and by reaching a much higher precision thanks to the size and homogeneity of the SDSS. We use a robust semi-automatic absorption line finder algorithm, carefully select a population of reference quasars, test potential biases, and use Monte Carlo simulations to measure and quantify the level of systematics of our selection procedure. To detect a magnification signal we will apply the method proposed by Ménard 2005 and look for a correlation between the presence of absorbers and a change in the mean magnitude of their background quasars. Contrarily to previous studies, this approach allows the use of a non-parametric estimator.
The outline of the paper is as follows: in §II we introduce the formalism of dust extinction and gravitational magnification. We describe the data used in our analysis in §III as well as the selection of the different samples of quasars. The magnitude shifts and color changes due to the presence of absorbers along quasar lines-of-sight are presented in §IV. We discuss the results and conclude in §V.
II. FORMALISM
Strong MgII absorbers (usually defined with Å) are known to be tracers of galaxies with luminosities ranging from 0.1 to several . The presence of such a system seen along the line-of-sight of a background source can therefore modify its brightness in two ways: first, the presence of dust in and/or around the absorber can extinct and redden the source’s light and second, it can act as a gravitational lens and amplify the flux of the source. This can be described by
| (1) |
where is the observed flux of a source behind an absorber, is the flux that would be observed without intervening system, is the optical depth for extinction induced by the galaxy and the gravitational amplification. The corresponding magnitude change can then be written
| (2) | |||||
These two contributions have different wavelength and redshift contributions. One can therefore attempt to constrain them separately.
II.1. Measuring reddening effects
Following Ménard 2005, we introduce the observed mean magnitude difference between a population of quasars with absorbers and one without:
| (3) |
where is the magnitude in a given band . In the next section we will measure this quantity using a large sample of MgII absorbers from the SDSS. We will then investigate how varies as a function of absorber rest equivalent width and redshift. Similarly, we can then define the mean excess color
| (4) |
where and denote two different bands. It should be noted that
such a quantity is not sensitive to gravitational lensing effects as
it no longer depends on the magnification . It can be used to
probe the statistical properties of the extinction curve of absorbers
systems as well as the dust column densities as a function of absorber
rest equivalent width.
In optical surveys, sources like quasars are both magnitude and color selected. When dust extinction occurs, such sources can become undetectable because they become too faint and/or too red. As long as sources are no longer detectable because of a limiting magnitude and not because of a color cut, we have
| (5) |
However, if the sources become undetectable because they no longer
satisfy a color cut, the measured reddening is then lower than the
intrinsic one. Such a property depends on the details of the quasar
selection procedure and will be addressed in section
III.2.
The current study is based on the photometry of SDSS quasars using the filter set. However, historically people have quantified color excesses using the Johnson and filters. In order to be able to present our results in similar units, we provide here a list of useful conversions. First, it should be noted that previous statistical studies (Khare et al. 2005; Ménard et al. 2005; York et al. 2006; Wild et al. 2006) have indicated that, on average, the extinction curves of MgII selected galaxies are consistent with that of the SMC, i.e. do not present an excess around the rest frame wavelength of 0.2 (in the optical, such a feature can only be detected for systems at redshift greater than and is therefore irrelevant for lower redshift galaxies). In this paper we will therefore consider only SMC-type extinction curves. We will also see in section §IV that such a property is confirmed by the present analysis.
In the range 0.1 to 1 , the SMC extinction curve 11 1 Templates of the reddening curves can be obtained from http://www.astro.princeton.edu/draine can be very well approximated by a power law (Prevot et al. 1984). By using the and filters, the conversion between the two color systems therefore reads
| (6) | |||||
and the average wavelengths for a flat spectrum are given by nm. Using the effective wavelength for realistic quasar spectra does not change the results significantly. In practice, two frames are interesting for considering colors excesses: in order to quantify the fraction of sources missed because of an extinction bias, observed E(B-V) values are relevant. However, for estimating the amount of dust associated with an absorber system the rest frame E(B-V) is the quantity of interest. For an SMC-like extinction curve we have
| (7) |
In a given band, we will therefore observe almost four times more extinction by an absorber at than the same system located at . For an SMC extinction curve we also have where the proportionality coefficient depends on the redshift of the dust and varies from 3.2 to 2.0 when is in the range 0.5 to 2.0, with a mean value of 2.6.
II.2. Measuring gravitational lensing effects
In this section we show how magnification effects can (or cannot) affect the observed magnitude of distant sources like quasars. For more details we refer the reader to the original discussion presented in Ménard 2005.
Here we will first assume that extinction effects can be neglected (which is expected at sufficiently large wavelengths). Let us consider an area of the sky which is large enough for the mean magnification to be close to unity. In this area, let us consider a population of sources, with a fraction of them lying behind an absorber system. We will write the magnitude distribution of the sources behind absorbers , and for the non-absorbed sources. We then have the following relation between the magnitude number counts:
| (8) |
where is the induced magnitude shift and is the probability density to have a given value of along a quasar line-of-sight. Note that in the case of absorber systems, is not known. Observational estimates of the number density of absorbers are necessarily affected by lensing and/or extinction effects due to the need of background quasars to observe absorber systems. Therefore the only usable information from the previous equation comes from the shape of the distribution , i.e. its moments. In this paper we will focus only on the first moment, i.e. we will attempt to constrain the mean magnification and extinction effects by measuring the mean magnitude shift induced by the presence of absorber systems.
By defining and to be the observed mean magnitudes of the two quasar populations, we see that the observable mean magnitude shift (eq. 3) can be used to probe the unknown distribution . It is important to note that the observed-magnitude changes depend on both the magnification effects and the slope of the source luminosity distribution:
| (9) |
and in general we have
. For
SDSS quasars with , Ménard 2005 has shown that we have
where
is an achromatic magnitude change. For a limiting magnitude
of , we find .
It should be noted that if the number of sources as
a function of luminosity follows a power law then and magnitude
changes cannot be observed whatever the value of the induced magnitude
shift .
This absence of observable lensing effects can be understood in the
following way: gravitational magnification makes each source brighter
but allows also new sources to be detectable as they become brighter
than the limiting magnitude of a given survey. This latter effect
increases the number of faint sources and tends to diminish the mean
flux of the detected objects. For a power law luminosity
distribution, the flux increase due to magnification is
exactly canceled by the additional faint sources that enter the sample
due to magnification, and lensing effects due to absorbers cannot be
observed. Therefore, it is possible to detect changes in the
magnitude distribution of a population lensed by absorbers only if its
unlensed number counts depart from a power law as a function of
luminosity. Extinction effects will be affected in a similar way
but the ability to observe sources in different bands allows us to
measure reddening effects and then infer the related extinction.
III. DATA & SELECTION BIASES
III.1. The quasar sample
In order to isolate the magnitude changes due to the presence of intervening absorber systems we need to compare the magnitude of quasars with absorption lines to that of a reference quasar population. Defining such a reference population without introducing any selection bias is a difficult task. Indeed, the detection of absorption lines depends on quasar redshift, spectrum S/N, and the extinction and reddening effects they might induce on their background source. All these effects have to be taken into account in order to carefully select a population of reference quasars.
The first requirement is to work with a well defined sample of quasars. Among the large sample of quasars available from the SDSS DR4 sample (50,000), we will use the primary spectroscopic quasar sample, i.e. quasars with (29,000), as the selection of these objects is based on a well defined series of color cuts (Schneider et al. 2002). We will not make use of fainter quasars (observed with SDSS serendipity fibers) as they are not selected from well defined selection criteria. Before characterizing the absorber systems used in this study, the first step of our analysis will be to investigate the sensitivity of the SDSS quasar target algorithm to reddening and extinction.
III.2. Detection of reddened quasars




Evidence for the presence of dust associated with MgII absorbers has already been shown by several authors by isolating the reddening and extinction effects they induce. Since the selection of quasars depends on quasar magnitudes and colors (Schneider et al. 2002), such an effect might introduce a bias in the object selection and it is therefore important to quantify it. In this section we now investigate the sensitivity of the SDSS quasar target algorithm (Richards et al. 2002) to reddening and extinction (Richards et al. 2003, similarly to the analysis done by ). In order to do so we use Montecarlo-like simulations to test the ability of the SDSS quasar algorithm to detect quasars for different amounts of reddening and extinction. We proceed as follows:
- 1.
We use a sample of quasars without strong MgII absorber (as described in section III.4), consider the SMC extinction curve and apply various amounts of extinction. We quantify the amount of reddening with the excess.
- 2.
The applied extinction will cause some objects to drop out of the input quasar sample as they become too faint and/or their colors no longer satisfy the series of selection criteria of the SDSS quasar selection algorithm, considering only non-radio and point sources. We reject the objects no longer labeled as quasars by the SDSS pipeline.
- 3.
For each value of applied, we measure the fraction of quasars missed due to limiting magnitude and color cuts effects, we measure the mean and magnitudes of the re-observed quasars and compare them to those of the initial sample of unreddened quasars.
We illustrate some of the results of this procedure in Fig. 3. From top to bottom we show the ability of the SDSS quasar selection algorithm to select quasars with increasing reddening and show the effects on quasar magnitudes. In each case we present the and -band magnitude distributions of the original (solid line histograms) and reddened samples (filled histograms). These panels show that the fraction of quasars missed due to dust extinction becomes substantial for observed reddening values of larger than 0.2. In this figure we also show the mean magnitude of each sample with a vertical line. As the amount of extinction increases, we can easily observe reddening effects rising as the mean magnitude shifts are more pronounced in bluer bands. In addition, we can observe that the mean magnitude in the band is almost unaffected by reddening in the range considered here.
We present the summary of the completeness and reddening results in Figure 3. From top to bottom we show, as a function of , the input extinction, the measured extinction and the fraction of objects that can be detected. These results show that the observed extinction, defined as the difference between the mean magnitude of the reddened quasars and those of the initial sample, is always smaller than the induced extinction. As explained in section IV.1.5, such an effect is expected and is due to the shape of the quasar luminosity function. Moreover, we can see that the observed mean -band magnitude is not significantly affected by extinction effects (for the range of reddening values of interest in this analysis). This property allows us to use the band to constrain gravitational lensing effects. The bottom panel of the figure allows us to quantify the fraction of objects missed as a function of observed . By knowing the amount of reddening induced by a class of absorber systems one can use this curve to infer the fraction of objects missed by the SDSS quasar finder.
In the right panel of Figure 3, we show
another property related to the selection of reddened quasars: the
induced and measured colors are the same in the range of
reddening values of interest in our case, i.e. with . This
indicates that the fraction of quasars lost due to color cuts is
small. This property therefore allows us to measure the mean color
excess of a sample of quasars and use the corresponding color value to
infer the induced extinction.
The properties and selection biases of the SDSS target quasar algorithm will be used below to interpret the measurements. Our analysis is restricted to the main sample of SDSS spectroscopic quasars (with ) in order to quantify certain selection effects. Including fainter quasars is expected to change the above numbers by a modest amount as the slope of quasar number counts distribution is a slowly varying function of magnitude (see Richards et al. 2005). Redshift-dependent selection effects are not considered here. As shown by Richards et al. 2002, the SDSS quasar selection algorithm is less efficient in detecting reddened quasars at . This effect can be neglected in the present analysis as only a small fraction of objects are found at such a redshift (see Fig. 4).


III.3. Absorber systems
III.3.1 The MgII absorber sample
In order to investigate the effects of reddening and magnification due to intervening absorbers, we use the sample of MgII systems compiled with the method presented in Nestor et al. 2005 and based on SDSS DR4 data. In this section we briefly summarize the main steps involved in the absorption line detection procedure. For more details we refer the reader to Nestor et al. 2005.
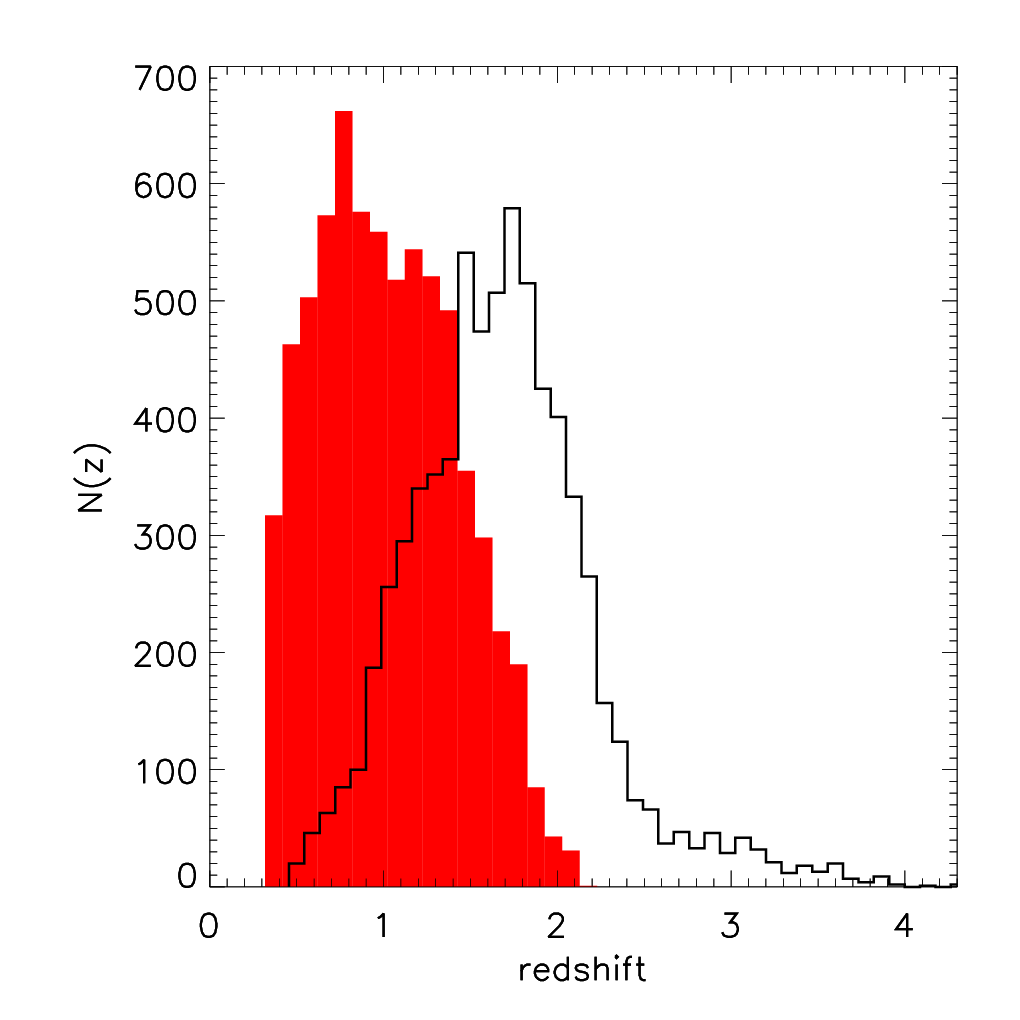
All quasar spectra from the SDSS DR4 database were analyzed, regardless of QSO magnitude. The continuum-normalized SDSS QSO spectra were searched for MgII doublets using an optimal extraction method employing a Gaussian line-profile to measure each rest equivalent width . All candidates were interactively checked for false detections, a satisfactory continuum fit, blends with absorption lines from other systems, and special cases. The identification of Mg II doublets required the detection of the 2796 line and at least one additional line, the most convenient being the 2803 doublet partner. A 5 significance level was required for all lines, as well as a significance level for the corresponding lines. Only systems 0.1c blue-ward of the quasar redshift and red-ward of Ly emission were accepted. For simplicity, systems with separations of less than 500 km/s were considered as a single system. The line finder is able to detect MgII absorption lines with a rest equivalent width Å. However a high completeness is reached only in the range Å. We will therefore focus our analysis on these stronger systems only. In such a range, multiple absorbers detected in the same quasar spectrum are found only in of the systems. For such cases we consider only the stronger system. We note that MgII absorption lines are in general saturated and in these cases no column density information can be directly extracted from . The redshift distribution of the systems used in this analysis is presented in Figure 4. The filled histogram shows that of the MgII systems and the solid line their background quasars. The middle panel of Figure 4 shows the observed distributions of absorber rest equivalent width . The intrinsic distribution, i.e. corrected for incompleteness is presented in Nestor et al. 2005. The right panel of the figure shows the distribution of rest equivalent width measurement uncertainty. It shows the existence of a correlation between line detectability and absorber rest equivalent width. As can be seen, the relative uncertainty becomes larger for weaker systems. Because we require the 2796 Å absorption lines to be detected at least at the 5-sigma level, this results in a selection bias: weaker lines are preferentially found in high S/N spectra. In addition, given the fact that all SDSS quasars are taken with a similar exposure time, the selection criteria introduce a correlation between quasar brightness and spectrum S/N. The line finder is therefore expected to preferentially find weaker systems in brighter quasars. A crucial step in our analysis will be to properly take this effect into account when we define a reference population of quasars without absorbers.
III.3.2 The simulated MgII samples
In order to test the efficiency of our detection technique and to identify biases and systematic effects we ran Monte Carlo simulations of the absorber catalog to create a sample of simulated MgII absorption lines reproducing the same properties as the real sample (, , , etc.) and same biases, but with the difference that the absorption lines are put in random spectra, i.e. that no correlation exists between quasar magnitude and absorber properties. Such a population can then be used as a control sample.
In order to create this sample, we proceed as follows: for each detected system, a simulated doublet having the same redshift, and similar , doublet ratio, and Gaussian-fit width was put into many randomly selected EDR spectra. Each spectrum containing a simulated doublet was then run through the entire non-interactive and interactive pipelines, and and were measured for detected systems. Over 9100 simulated doublets were put in random quasar spectra. A large fraction of them appear in regions of spectra with insufficient signal to noise ratio to meet the detection threshold for the input . The line finder is then able to recover about 4400 systems. Measurement error of the rest equivalent width can cause systems with to scatter into the output catalog as well as systems with to scatter out. Therefore, the recovered distribution of rest equivalent width differs from the input one. In order to create a simulated absorption line sample with statistically identical distributions of rest equivalent widths, a trial distribution was specified and then adjusted so that the simulated output best represents the data. We initially chose lines randomly from the input catalog according to a distribution of the form with an initial guess for , until the number of lines recovered were equal to that of the actual catalog. Lines with input Å were used, although only lines with recovered Å were retained. We determined a maximum-likelihood value for using the recovered values. We then corrected our guess for to minimize .
This procedure allows us to create a simulated absorption line sample having the same properties as the real sample described in the previous section. The distributions of real and simulated absorber redshifts, rest equivalent widths and rest equivalent widths uncertainties are presented in Fig 5. As can be seen, the statistical properties of the simulated samples match very well those of the real data. The figure shows that weaker absorption lines are preferentially found in high spectrum S/N – and therefore brighter quasars – in the same way as the real systems are. This bias is systematically introduced by the requirements of the line finder algorithm. Below we show that the selection of reference quasars described in the previous section takes this effect into account.
III.4. Defining reference quasars
As our goal is to isolate the magnitude shifts induced by intervening absorber systems, the selection of reference quasars must (i) not depend on quasar magnitudes and (ii) take into account the fact that the absorption line detectability depends on the spectrum S/N as seen above.
Here we describe how we define such populations of quasars: we first
select the quasars with detected absorbers above a given rest
equivalent width Å. We will compare them
to quasars without any detected absorber above this limit. In the goal
of avoiding biases that would give rise to magnitude shifts, a number
of criteria must be applied: the two quasar populations must have the
same redshift distribution and present the same absorption-line
detectability. For a given absorber with rest equivalent width
and redshift , we randomly look for a quasar without any
detected absorber (above Å) such that:
(i) they have similar redshifts, i.e.
;
(ii) in addition, we need
to check whether this quasar would have allowed for the detection of
the absorption line, i.e. if its S/N at the corresponding wavelengths
is high enough. Such a requirement translates into
, where is the minimum
equivalent width that can be detected by the line finder at the
corresponding wavelength. The quasars selected in this way are called
reference quasars in the following. Our selection procedure
ensures that if similar absorbers population were present in front of
the selected reference quasars, we would have been able to detect
them.
Since the number of available quasars without detected
absorbers is larger than the number of quasars with absorbers for the range
of we are interested in, we repeat the previous step times
in order to create a series of reference samples that will be used
for estimating the noise associated to a single quasar sample.
IV. ANALYSIS & RESULTS
In order to isolate the magnitude changes due to the presence of the absorber systems we measure, in a given band , the mean magnitude difference between quasars with absorbers and reference quasars:
| (10) |
As explained above, we can repeat the selection of reference quasars times and create a series of reference samples in a bootstrap manner. The intrinsic dispersion of the series samples can then be used in order to estimate the errors in the measured magnitude shifts. As an example, we show in Figure 6 the results obtained by using a sample of quasars with MgII absorbers having Å and their corresponding reference quasars. The left panels show the magnitude distributions of quasars with absorbers (solid line histograms) and reference quasars (filled histograms). Within the Poisson noise, no significant difference can be seen between the two types of distributions. In the right panels, we show the mean magnitudes of these two populations. For each band, the vertical line shows the value and the histogram shows the distribution of the mean magnitudes of reference samples. Such an estimator allows to reveal a significant difference between the magnitude distributions of the two populations and indicates that quasars with absorbers are affected by reddening effects.


Before attempting to detect various signals with the data, we make use
of the sample of simulated absorbers in order to test whether our
procedure introduces any selection bias. Indeed, as measuring the
quantity involves the use of
various procedures performed over a large number of objects (continuum
normalization, line detectability, rest equivalent width fitting,
etc.), it is important to investigate the presence of systematic
effects and quantify them.
To check whether the properties of quasars with (detected) random
absorption lines match those of quasars without, we proceed as follows:
for a given sample of simulated absorbers, we define a population of
reference quasars as defined in section III.4. We
then compare the mean magnitude difference between the two
populations. Since the simulated absorption lines were initially put
in random spectra, any departure from zero will quantify the level of
systematics associated to our selection procedure. Such a process can
therefore test whether the samples of quasars with and without
absorption lines to have the statistical properties.
We measure the corresponding mean magnitudes and the results are summarized
in the left panel of Figure 7.
As can be seen, the mean magnitudes of these two samples are similar, but a non-zero magnitude difference is found and does not seem to depend on absorber rest equivalent width or wavelength. Using the -band as a reference (the least affected by extinction effects, see section IV.1.5), the mean offset is found to be
| (11) |
Other bands give similar results, ranging from to
. This negative value indicates that our global
procedure, i.e. line finder and/or reference quasar selection,
preferentially selects absorbers in brighter quasars. This systematic
effect occurs at the level in terms of quasar magnitude or
similarly spectrum S/N. It could be corrected by increasing the
estimates of by a similar amount. Here we prefer to take
this effect into account by considering the existence of an offset in
the mean magnitude differences. It should also be pointed out that
our procedure indicates that the selection of absorption lines does
not introduce any color-dependent bias. Indeed, no significant excess
can be detected by comparing the colors of quasars with simulated
absorption lines to those of reference quasars.
We now apply the same procedure to the sample of real MgII absorbers. The results are presented in the right panel of Figure 7. The gray region shows the zero point offset, , given by the Montecarlo simulations. As we can see, it appears very clearly that the presence of a MgII absorber reddens the light of background quasars and the stronger the absorber rest equivalent width, the redder the quasar. The direct measurements indicate that for the strongest systems. However, by taking into account the offset due to the selection bias , no significant difference can be observed. This result contrasts with a number of previous studies claiming that absorber systems are preferentially found in the spectrum of brighter quasars. It suggests that previous claims of such correlations may have arisen due to selection biases. The current analysis shows that the use of Montecarlo simulations in order to test the recovery of random absorption lines is an important task to achieve in order to quantify the amount of systematic effects. More details on the reddening and magnification effects are presented below.
IV.1. Dust reddening
From the magnitude shifts measured in each band we measure the corresponding color excess induced by MgII systems. The measured color excess induced by the presence of absorbers provides us with constraints on the properties of the dust associated with these systems such as the size distribution of the dust particles and the related column densities.
It should be noted that the magnitude shifts measured in different bands (fig. 7) are correlated and the errors on the colors are in general significantly smaller than the errors on the magnitude shifts. We have therefore computed the color covariance matrix from bootstrap re-sampling and estimated the errors on the measured color changes. The results are presented in fig. 8 where we show the mean color excess measured for the four color combinations and , as a function of absorber rest equivalent width. As can be seen, strong MgII absorbers induce, on average, reddening values ranging from to , which correspond to similar values.
As the SMC extinction curve is known to describe, on average, the reddening properties of MgII absorbers (Khare et al. 2005; Ménard et al. 2005; York et al. 2006), we can write
| (12) |
where is the hydrogen column density associated to a MgII system, is the dust to gas ratio, and is the wavelength dependence of the extinction curve. This relation shows that investigating the color excess as a function of redshift allows us to constrain the mean product . In Figure 8 we have plotted the SMC-based reddening values for a series of amplitudes normalized by the SMC dust column density
| (13) |
where is the dust-to-gas ratio and is the hydrogen column density. Our calculation includes the redshift distribution of the corresponding absorbers in each bin. First, we can see the SMC-like dust provides a good fit to the measured reddening for most of the absorber systems. The dotted lines can be used to quantify the amount of dust among various strengths of MgII absorbers. They correspond to and show that the optical depth for extinction spans a factor for MgII systems in the range to Å.
If the dust-to-gas ratio of MgII absorbers is comparable of that of the SMC, it implies that the strongest MgII absorbers have, on average, hydrogen column densities of , i.e. correspond to the regime of damped Lyman- systems. This result is in agreement with the hydrogen column densities of MgII-selected systems measured by Rao et al. (2005).

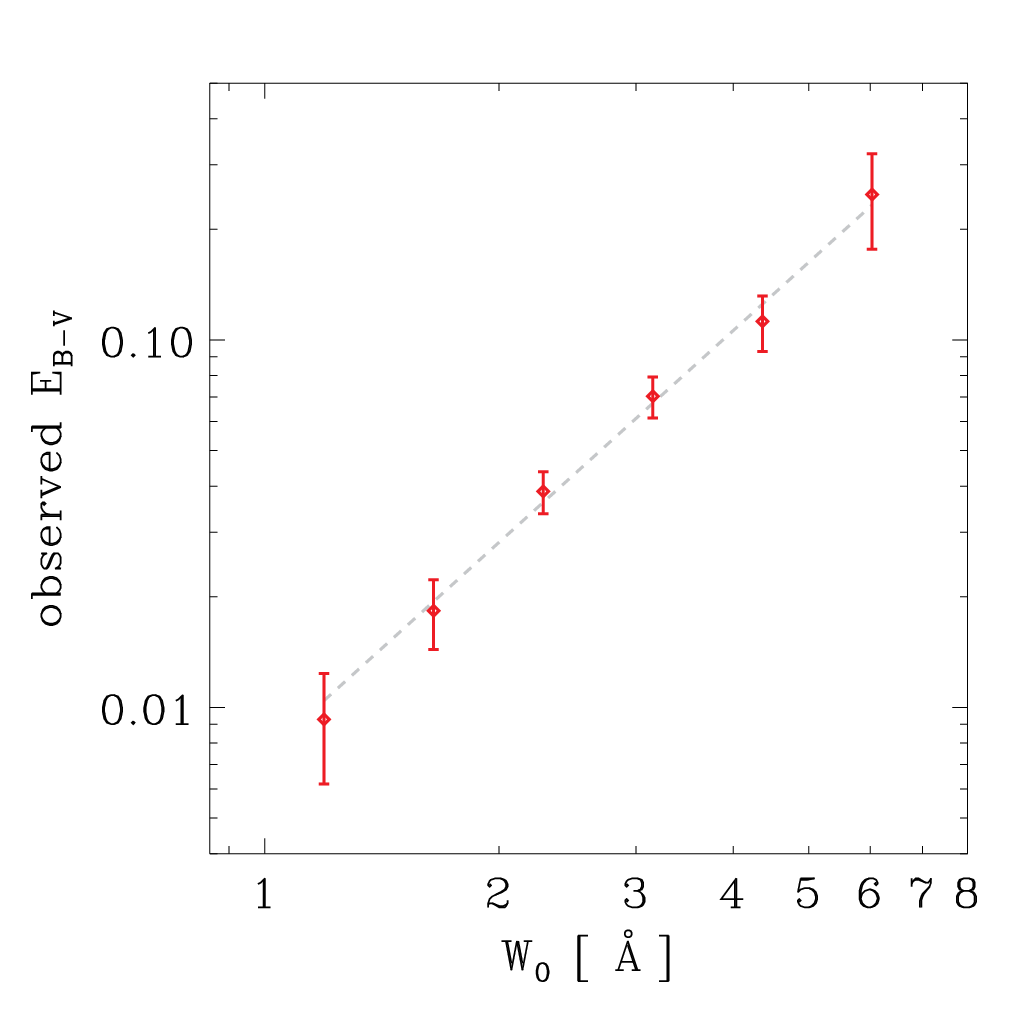

As the sensitivity of the SDSS filters is significantly lower in the and bands compared to the and ones, the color is measured the most accurately and will be used below to quantify reddening properties. We then convert the color excesses into and present the color excesses as a function of absorber rest equivalent width. The results are presented in Fig. 9. As can be seen, we find a strong correlation between these two parameters. We can also observe that the relation between observed mean and is well described by a simple power-law:
| (14) |
with , . As shown in section II.1, for an SMC-type extinction law, the color excess is roughly proportionally to the optical depth for extinction. Hence we can also write
| (15) |
with .
The relation holds for systems with Å which correspond to
velocity dispersions spanning km/s
and the dust column densities change by a factor in this
range. The weakest and strongest absorbers of this sample are
therefore significantly different but our results indicate
that their dust and gas content follows a universal relation,
suggesting that one phenomenon regulates, on average, the amount of
one quantity with respect to the other.
Modeling the gas distribution in the halo of galaxies is beyond the
scope of this paper but we note that this relation strongly constrains
theoretical models of absorber systems, as the dependence relates
spatial information, , to a quantity that mostly carries
velocity space information, . We believe that understanding this
relation will greatly improve our knowledge about the nature of these
systems.
If we consider the global distribution of strong MgII absorbers it is interesting to estimate the relative contribution of optical depth for extinction , as a function of absorber rest equivalent width. Such a quantity is given by the product:
| (16) |
The number of absorbers per unit rest equivalent width and redshift is given by Nestor et al. (2005):
| (17) |
with the maximum likelihood values Å and . This estimation takes into account incompleteness detections and is valid down to a rest equivalent width limit of Å. Using this result, we have computed the relative contribution of dust , as a function of absorber rest equivalent width and present the results in the upper panel of Figure 9. The data points show that, for MgII systems with Å, most of the dust contribution originates from systems with Å. Therefore most of the extinction effects are expected to be associated to such systems. It is interesting to mention that an excess of MgII absorbers with Å is reported along gamma ray burst lines-of-sight with respect to those of quasars (Prochter et al. 2006).
We can also attempt to estimate the relative dust contribution originating from all MgII absorbers, i.e. including also weaker systems. First, we know that the functional form used for the incidence of MgII absorbers holds down to systems as weak as Å. In the range 0.3 to 1 Å we do not have any detection of dust reddening but we can attempt to extrapolate the scaling found above (eq. 16). By doing so, we find that the global dust contribution originating from systems weaker than 1 Å is smaller than 20%. The result is similar if, instead of extrapolating eq. 16, we use an upper limit from systems with Å, i.e. the weakest systems used in the present analysis. Therefore, the vast majority of the dust probed by MgII absorption lines originates from strong systems, with Å. As dust originates from stars, this result appears to be in line with the association between strong MgII absorbers and galaxies, i.e. galaxies from which most of the star light originates.
IV.1.1 Dust redshift evolution
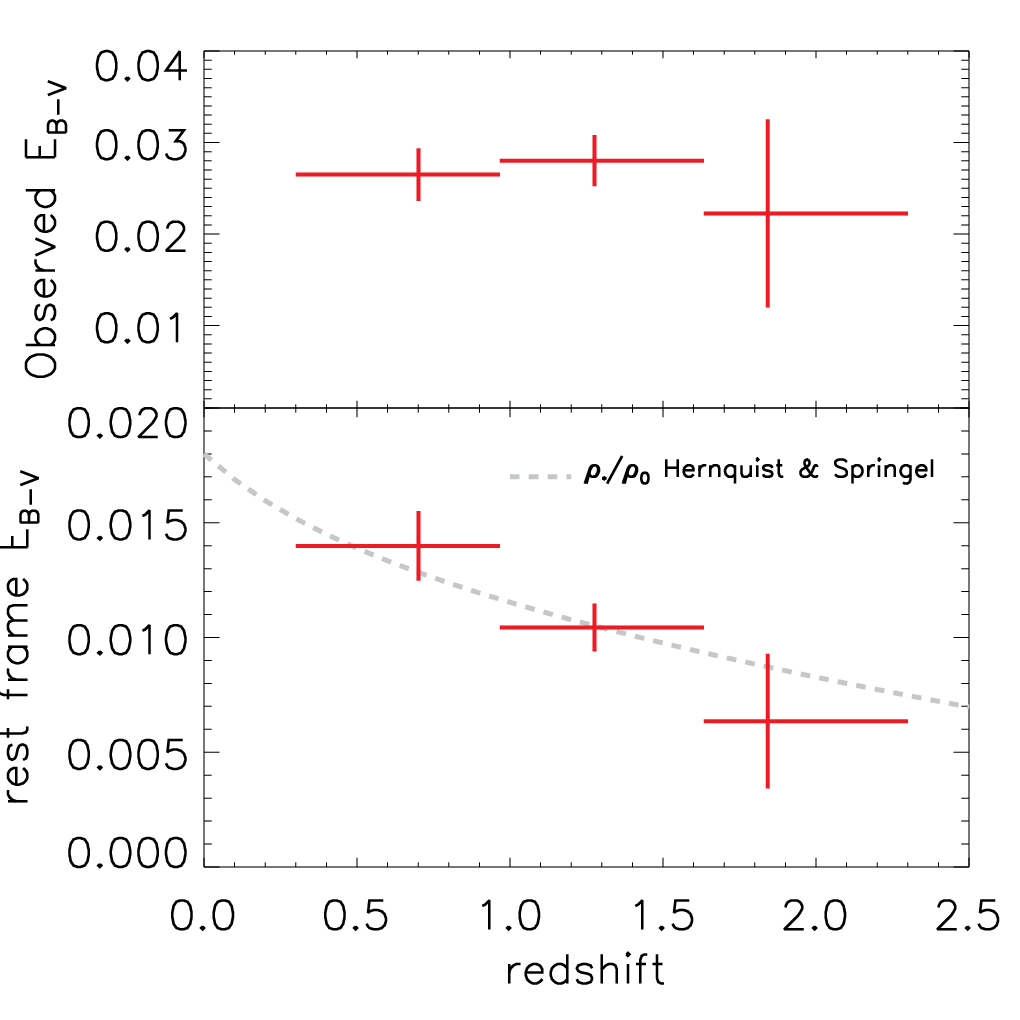
We now investigate the dust column densities associated with MgII systems as a function of redshift. Using an SMC-type extinction curve, we have computed the rest frame E(B-V) values as a function of rest equivalent width for three redshift bins. The results are presented in Figure 10 and show that the scaling between and found in the previous section is consistent with being redshift independent but the overall amplitude decreases with redshift indicating that MgII absorbers are less dusty at earlier times.
In order to quantify the redshift evolution of the dust, we measure the average of all absorbers systems with Å, in three redshift bins spanning the range . In each case we measure the observed and rest frame values. The results are shown in the right panel of Figure 10. As we can see, the observed reddening effects of MgII systems are on average consistent with being redshift independent. Our vision of the distant universe is equally affected by MgII absorbers at and . In contrast, the rest frame values, and therefore the dust column densities, show a significant redshift evolution. We find that the amount of dust associated with MgII absorbers increases by more than a factor two between and . A simple power law fit to the data points gives .
It is interesting to see that such a variation is similar to that of the cosmic star density . We illustrate this agreement in the figure by showing the integrated star formation rate given by Hernquist & Springel 2003 where the scaling has been renormalized to the reddening values. Our results therefore provide a new and independent method to probe the star formation rate over cosmological time scales.
If we assume that the redshift and rest equivalent widths dependencies can be separated (as suggested by the data points), we can write that
| (18) |
where (see section IV.1), and . This functional form provides us with interesting constraints on the properties of cold gas and dust. It will be particularly interesting to include such information in theoretical models of absorber systems.

IV.1.2 Dust-to-metals ratio
We can use the above results to estimate the dust-to-metals ratio of MgII absorbers by computing the ratio
| (19) |
adopting Zn (an undepleted Fe-peak element) as an indicator of overall metal content. This ratio provides us with an estimate ot the fraction of refractory elements depleted onto dust grains, a quantity determined by the balance between the formation and destruction of dust particules. Using a similar sample of MgII absorbers with , Nestor et al. 2003 have measured the mean rest equivalent width of and found Å. Assuming that most of the zinc is in the form of ZnII, we obtain cm-2. Combining this value with our estimate of the mean E(B-V) of MgII systems at we find
| (20) |
As shown by Wild et al. (2006, see their table 5), the dust-to-metals ratios, , of the Milky way, LMC and SMC are 4.7, 3.1 and 1.6 , respectively. Our analysis therefore shows that, on average, MgII absorbers with Å have a dust-to-metals ratio similar to that of our Galaxy. The properties of as a function of redshift and MgII rest equivalent width will be presented in a future paper.
IV.1.3 Dust extinction bias in magnitude limited QSO samples
From the observed E(B-V) values, we can now use the results of the reddening Montecarlo simulations presented in section III.2 and infer the fraction of quasars with absorbers missed in the magnitude limited sample. Note that our procedure takes into account quasars missed due to both magnitude and color selections. Assuming that the distribution of intrinsic reddening values is not strongly skewed (which is suggested by the results of Ellison et al. 2004 with radio-selected quasars), we estimate the fraction of MgII absorbers missed due to extinction effects and present the results in Fig. 11. The fraction of missed systems is below one percent for absorbers with Å. However, above this value, incompleteness effects become more important. Our analysis indicates that the SDSS misses more than 10% of Å MgII absorbers and this rises to more than at Å. By extrapolating the trend to stronger systems, we see that the SDSS could not detect MgII systems with Å. The fraction of missed quasars with absorbers can be parametrized by
| (21) |
with and .
The knowledge of allows us to estimate the global fraction of quasars with strong MgII absorbers, per unit redshift, missed due to the extinction bias. We have
| (22) | |||||
Therefore, if we consider quasars at , about one percent of them cannot be observed due to extinction effects by MgII systems. As both and the observed of MgII systems do not vary strongly with redshift (see section IV.1.1), this missing fraction is roughly proportional to the quasar redshift. Therefore, if we consider the main sample of SDSS quasars (for which the mean redshift is above 1.5) the incompleteness due to the dust hosted by MgII absorbers is about .

IV.1.4 Recovering the unbiased distribution
As the fraction of missed quasars with absorbers depends on , the observed distribution of absorber rest equivalent widths differs from the intrinsic one and we have
| (23) |
As we have used the functional form of to estimate the missing fraction , an exact estimation of these quantities should be made with an iterative process using eq. 23. However, given the small values of and the exponential cutoff of , such an approach will only bring negligible corrections to . Our previous estimations are therefore robust.
The values of shown in Figure 11 indicate that the shape of the observed distribution of is expected to be significantly affected at the high-end values and to present a deficit.
IV.1.5 Gravitational lensing
In order to detect the potential effects of gravitational lensing, we now estimate the magnitude shifts induced by the presence of strong MgII absorbers, after correcting for dust extinction.
In section III.2 we have shown that, on average, the induced and measured color excess are equivalent (in the range of values of interest in our analysis). However, given the shape of the QSO magnitude distribution and the selection criteria of the SDSS quasar target algorithm, a difference exists between induced and measured extinction. Having quantified these effects in section III.2, we can now use the observed values and apply the appropriate observed extinction correction to the quasar magnitudes. The corresponding results are shown in Fig. 12 where the horizontal line represents the zero point obtained with the Monte Carlo simulations for simulated absorption lines. By comparing the extinction-corrected magnitude shifts to this reference level, we do not find any significant magnification signal (for which would be negative).
If we consider all strong MgII absorbers with Å, we find the mean magnitude shift in the band to be:
| (24) | |||
which was compared to the zero-point and taking into account its
uncertainty. These mean magnitude shifts are consistent with zero
( is positive at the 2-
level only). Our analysis does not show any detectable brightening
effect, which differs from a number of previous studies claiming
detections of magnification effects due to metal absorbers. It is
interesting to point out that without the quantification of systematic
effects done with the Montecarlo simulations, i.e. without the
calibration of the zero point, the raw measurement with the real data
would have led to the detection of a negative magnitude shift which
could have been interpreted as magnification effects.

We can use the above results to infer an upper limit on magnification effects. If we consider the and bands the 3- upper limit on magnification is
| (25) |
As explained in section IV.1.5 and detailed in Ménard (2005), given the shape of the quasar magnitude distribution, this corresponds to an upper limit for the mean magnification:
| (26) |
meaning that the excess magnification is smaller than about ten percent. In order to convert this value into a more interesting quantity, we can assume the mass distribution of the galaxies responsible for the absorption to follow that of a singular isothermal sphere. The galactic halos therefore have the following density and surface density:
| (27) |
and the corresponding magnification effects of a point source can then be computed in a simple way:
| (28) |
where is the impact parameter normalized to the Einstein radius of the lens:
| (29) |
where is the velocity dispersion and are the angular diameter distances from the observer to the lens, to the source, and from the lens to the source. Using the above upper limit on the magnification, and the average impact parameter for MgII systems with Å recently measured by Zibetti et al. (2006): kpc, we find
| (30) |
for absorbers at and quasars at . This result shows that, on average, MgII absorbers are not associated with massive elliptical galaxies and is in agreement with previous estimates based on different methods. Previous works have shown that the average MgII absorbing galaxy has a luminosity about (Zibetti et al. 2007; Steidel et al. 1997). The expected velocity dispersion of the gravitational potential of such galaxies is expected to be km s-1. Therefore the sensitivity of the present measurement needs to be improved only by a factor of a few in order to detect the magnification signal originating from the galaxies associated with MgII absorbers. The present analysis is based only on quasars with . In the future, it might be of interest to quantify the selection effects of fainter SDSS quasars as it would double the sample size. In a longer term, being able to measure this magnification signal as a function of absorber rest equivalent width and redshift will provide us with important constraints on the nature and environment of metal absorbers.
V. SUMMARY
We have used a sample of almost strong MgII absorbers with detected in the SDSS DR4 dataset to investigate the gravitational lensing and dust reddening effects they induce on background quasars. We have attempted to make significant improvements in making such measurements, by using a sample of MgII absorbers an order of magnitude larger than earlier analyzes and by carefully quantifying a number of systematic effects previously neglected.
In order to do so
we have restricted our analysis to a well defined sample of SDSS quasars with and considered strong MgII
absorbers with a rest equivalent width Å. We have
quantified the efficiency of the absorption-line finder algorithm with
Monte Carlo simulations and the sensitivity of the SDSS quasar target
algorithm to detect reddened quasars. We then measured the
statistical magnitude changes induced by the presence of MgII
absorbers.
Our main results are as follows:
(i) Strong MgII absorbers significantly redden the light of their background quasars. We confirm previous results showing that, on average, the dust particle size distribution of these systems is similar to that of the SMC, i.e. without the presence of a reddening excess at . Moreover, we find that the observable reddening effects follow the simple relation: with , , for absorbers with Å. In this range, the mean dust column density increases by a factor . Since most MgII lines with Å are saturated, this scaling suggests that, on average, the dust column density is proportional to the velocity dispersion of the gas Such a relation provides us with an important constraint for theoretical models of absorber systems.
(ii) The analysis of reddening effects as a function of has
shown that the rest-frame values follows , with
, which implies that the amount of dust in MgII
systems increases by a factor between and . Such
a trend is similar to the evolution of the cosmic star density. Our
results therefore provide a new and independent method to probe the
star formation rate through the production of dust over cosmological
time scales.
The observed values induced by MgII appear to be
consistent with no redshift evolution down to . This observation
results from less dust at higher redshift being canceled out by
higher SMC extinction at high redshift (which probe bluer rest-frame
wavelengths). We have also showed that, considering all MgII
absorbers, most of the dust is carried by systems with
Å.
(iii) We have estimated the dust-to-metals ratio of MgII absorbers by measuring the quantity which is similar to that of the Milky way.
(iv) We have quantified the fraction of absorbers and/or quasars missed due to extinction effects induced by MgII systems. While less than 2% of absorbers with Å are missed, this fraction increases up to for the strongest systems of our sample, with Å. This effect therefore affects the shape of the distribution of absorber rest equivalent widths and we provide a correction factor for it. We also show that extinction effects due to MgII systems decrease the number of observable quasars by less than 2%.
(v) Regarding gravitational lensing, in contrast to previous
studies we do not find an excess of absorbers in brighter quasars and
we obtain only an upper limit on gravitational magnification:
. We have shown that testing
the global selection procedure (for detecting absorption lines and
defining reference quasars) is crucial in order to make such a
measurement. Our result provides an upper limit for the velocity
dispersion of MgII absorbing galaxies: km
s-1. As it has been shown that the mean luminosity of MgII
absorbing galaxies is about (Zibetti et al. 2007),
it implies that improving the sensitivity of our measurements by a
factor of a few might lead to the detection of the magnification
effects induced by MgII absorbing galaxies and therefore a characterization
of their mass.
VI. Future directions
Understanding the nature of the structures probed by absorption lines is an important task to achieved. Among metal lines, the MgII doublet, Å is one of the most commonly detected features in optical quasar spectra but little is known about the properties and origin of MgII absorber systems. Attempts to find correlations between and galaxy parameters have turned out to be rather difficult. Recently, using HST images of 37 galaxies giving rise to MgII absorption, Kacprzak et al. 2007 showed that most galactic parameters do not correlate with absorptioin strength.
In this paper we have shown the existence of a well-defined scaling relation between the mean E(B–V) induced by MgII absorbers and their rest equivalent width , and presented its evolution as a function of redshift. Since most MgII lines with Å are saturated, this scaling translates into a relation between dust column density and gas velocity dispersion, with spanning the range 100 to about 600 km/s. Theoretical models are needed in order to gain insight into the origin of this relation. We believe that being able to understand and reproduce this scaling will shed light on the nature and properties of the structures traced by low-ionization absorption lines.
acknowledgments
B. M. thanks Nadia Zakamska for her help with using the SDSS pipeline. Funding for the creation and distribution of the SDSS Archive has been provided by the Alfred P. Sloan Foundation, the Participating Institutions, the National Aeronautics and Space Administration, the National Science Foundation, the U.S. Department of Energy, the Japanese Monbukagakusho, and the Max Planck Society.
References
- Bartelmann & Loeb (1996) Bartelmann, M., & Loeb, A. 1996, ApJ, 457, 529
- Bartelmann & Loeb (1998) Bartelmann, M., & Loeb, A. 1998, ApJ, 503, 48
- Bergeron & Boissé (1991) Bergeron, J., & Boisse, P. 1991, A&A, 243, 344
- Bergeron et al. (1992) Bergeron, J., Cristiani, S., & Shaver, P. A. 1992, A&A, 257, 417
- Borgeest & Mehlert (1993) Borgeest, U., & Mehlert, D. 1993, A&A, 275, L21
- Bouché et al. (2006) Bouché, N., Murphy, M. T., Péroux, C., Csabai, I., & Wild, V. 2006, MNRAS, 371, 495
- Bowen et al. (2006) Bowen, D. V., et al. 2006, ApJ, 645, L105
- Bowen et al. (2007) Bowen, D. V., Chelouche, D., Ménard, B., in preparation
- Chelouche et al. (2007) Chelouche, D., Ménard, B., Bowen, D. V., Gnatt, O., in preparation
- Churchill et al. (2000) Churchill, C. W., Mellon, R. R., Charlton, J. C., Jannuzi, B. T., Kirhakos, S., Steidel, C. C., & Schneider, D. P. 2000, ApJS, 130, 91
- Churchill et al. (2005) Churchill, C. W., Kacprzak, G. G., & Steidel, C. C. 2005, Proceedings of the IAU Colloquium 199 ”Probing Galaxies through Quasar Absorption Lines”, arXiv:astro-ph/0504392
- Ellison et al. (2004) Ellison, S. L., Churchill, C. W., Rix, S. A., & Pettini, M. 2004, ApJ, 615, 118
- Ellison et al. (2005) Ellison, S. L., Hall, P. B., & Lira, P. 2005, AJ, 130, 1345
- Hernquist & Springel (2003) Hernquist, L., & Springel, V. 2003, MNRAS, 341, 1253
- Hopkins et al. (2004) Hopkins, P. F., et al. 2004, AJ, 128, 1112
- Kacprzak et al. (2007) Kacprzak, G. G., Churchill, C. W., Steidel, C. C., Murphy, M. T., & Evans, J. L. 2007, ArXiv Astrophysics e-prints, arXiv:astro-ph/0703377
- Khare et al. (2005) P. Khare, D. G. York, D. Vanden Berk, V. P. Kulkarni, A. P. S.Crotts, D. E. Welty, J. T. Lauroesch, G. T. Richards, Y. Alsayyad, A. Kumar, B. Lundgren, N. Shanidze, J. Vanlandingha, B. Baugher, P. B. Hall, E. B. Jenkins, B. Menard, S. Rao, D. Turnshek, C.W. Yip, Proceedings of the IAU Colloquium 199 ”Probing Galaxies through Quasar Absorption Lines”, astro-ph/0504532
- Lanzetta et al. (1987) Lanzetta, K. M., Wolfe, A. M., & Turnshek, D. A. 1987, ApJ, 322, 739
- Le Brun et al. (1993) Le Brun V., Bergeron J., Boisse P., Christian C., 1993, A&A, 279, 33
- Ménard (2005) Ménard, B. 2005, ApJ, 630, 28
- Ménard et al. (2005) Ménard, B., Zibetti, S., Nestor, D., & Turnshek, D. 2005, IAU Colloq. 199: Probing Galaxies through Quasar Absorption Lines, 86
- Ménard & Péroux (2003) Ménard, B. and Péroux, C., A&A 410, 43
- Nestor et al. (2003) Nestor, D. B., Rao, S. M., Turnshek, D. A., & Vanden Berk, D. 2003, ApJ, 595, L5
- Nestor et al. (2005) Nestor, D. B., Turnshek, D. A., & Rao, S. M. 2005, ApJ, 628, 637
- Pei et al. (1991) Pei, Y. C., Fall, S. M., & Bechtold, J. 1991, ApJ, 378, 6
- Pei (1992) Pei, Y. C. 1992, ApJ, 395, 130
- Perna et al. (1997) Perna, R., Loeb, A., & Bartelmann, M. 1997, ApJ, 488, 550
- Prevot et al. (1984) Prevot, M. L., Lequeux, J., Prevot, L., Maurice, E., & Rocca-Volmerange, B. 1984, A&A, 132, 389
- Prochaska et al. (2005) Prochaska, J. X., Herbert-Fort, S., & Wolfe, A. M. 2005, ApJ, 635, 123
- Prochter et al. (2006) Prochter, G. E., Prochaska, J. X., & Burles, S. M. 2006, ApJ, 639, 766
- Rao et al. (2006) Rao, S. M., Turnshek, D. A., & Nestor, D. B. 2006, ApJ, 636, 610
- Richards et al. (1999) Richards, G. T., York, D. G., Yanny, B., Kollgaard, R. I., Laurent-Muehleisen, S. A., & vanden Berk, D. E. 1999, ApJ, 513, 576
- Richards et al. (2001) Richards, G. T., et al. 2001, AJ, 121, 2308
- Richards et al. (2002) Richards, G. T., et al. 2002, AJ, 123, 2945
- Richards et al. (2003) Richards, G. T., et al. 2003, AJ, 126, 1131
- Richards et al. (2005) Richards, G. T., et al. 2005, MNRAS, 360, 839
- Richards et al. (2006) Richards, G. T., et al. 2006, ApJS, 166, 470
- Schneider et al. (2002) Schneider, D. P., et al. 2002, AJ, 123, 567
- Smette et al. (1997) Smette, A., Claeskens, J., & Surdej, J. 1997, New Astronomy, 2, 53
- Steidel & Sargent (1992) Steidel, C. C., & Sargent, W. L. W. 1992, ApJS, 80, 1
- Steidel et al. (1994) Steidel, C. C., Dickinson, M., & Persson, S. E. 1994, ApJ, 437, L75
- Steidel et al. (1997) Steidel, C. C., Dickinson, M., Meyer, D. M., Adelberger, K. L., & Sembach, K. R. 1997, ApJ, 480, 568
- Thomas & Webster (1990) Thomas, P. A., & Webster, R. L. 1990, ApJ, 349, 437
- Tripp & Bowen (2005) Tripp, T. M., & Bowen, D. V. 2005, IAU Colloq. 199: Probing Galaxies through Quasar Absorption Lines, 5
- Turnshek et al. (1997) Turnshek, D. A., Lupie, O. L., Rao, S. M., Espey, B. R., & Sirola, C. J. 1997, ApJ, 485, 100
- Vanden Berk et al. (1996) vanden Berk, D. E., Quashnock, J. M., York, D. G., & Yanny, B. 1996, ApJ, 469, 78
- Vladilo et al. (2006) Vladilo, G., Centurión, M., Levshakov, S. A., Péroux, C., Khare, P., Kulkarni, V. P., & York, D. G. 2006, A&A, 454, 151
- Vladilo & Péroux (2005) Vladilo, G., & Péroux, C. 2005, A&A, 444, 461
- Wild & Hewett (2005) Wild, V., & Hewett, P. C. 2005, MNRAS, 361, L30
- Wild et al. (2006) Wild, V., Hewett, P. C., & Pettini, M. 2006, MNRAS, 367, 211
- York et al. (1991) York, D. G., Yanny, B., Crotts, A., Carilli, C., Garrison, E., & Matheson, L. 1991, MNRAS, 250, 24
- York et al. (2000) York, D. G., et al. 2000, AJ, 120, 1579
- York et al. (2006) York, D. G., et al. 2006, MNRAS, 367, 945
- Zibetti et al. (2005) Zibetti, S., Ménard, B., Nestor, D., & Turnshek, D. 2005, ApJ, 631, L105
- Zibetti et al. (2007) Zibetti, S., Ménard, B., Nestor, D. B., Quider, A. M., Rao, S. M., & Turnshek, D. A. 2007, ApJ, 658, 161