Comment on arXiv:0705.1508
Abstract
A simple regression analysis designed for predicting the supermassive black hole mass from the effective radius and mean effective surface brightness of the host bulge has been performed using the data from Barway & Kembhavi (arXiv:0705.1508). The scatter in the direction is found to be 0.32 dex, comparable with values obtained using a single predictor quantity such as luminosity, velocity dispersion or Sérsic index.
Keywords:
black hole physics — galaxies: bulges — galaxies: fundamental parameters — galaxies: structureI Research Note
Barway & Kembhavi (2007) have made the interesting claim that a combination of two photometric parameters, namely the effective radius and the mean effective surface brightness , can be used to predict supermassive black hole masses with a greater degree of accuracy than single quantities such as velocity dispersion (Ferrarese & Merritt 2000; Gebhardt et al. 2000), luminosity (Graham 2007 and references therein) or major-axis Sérsic index (Graham & Driver 2007). These latter relations have a total scatter in the direction of 0.31–0.34 dex.
Here we check Barway & Kembhavi’s (2007) claim that the total scatter in the direction, when using and as predictor quantities, is 0.25 dex (and 0.19 dex when excluding the outlier NGC 4742).
A simple ordinary least squares regression analysis of has been performed, in which and . The data for , and have been taken from Table 1 in Barway & Kembhavi (2007). In addition to solving for the parameter in the above inset equation, we also solve for and to give the expression
| (1) |
Given the absence of reported errors on the quantities and in Barway & Kembhavi (2007), no attempt has been made to include such measurement errors in the regression, and subsequently no attempt to quantify the intrinsic scatter has been made.
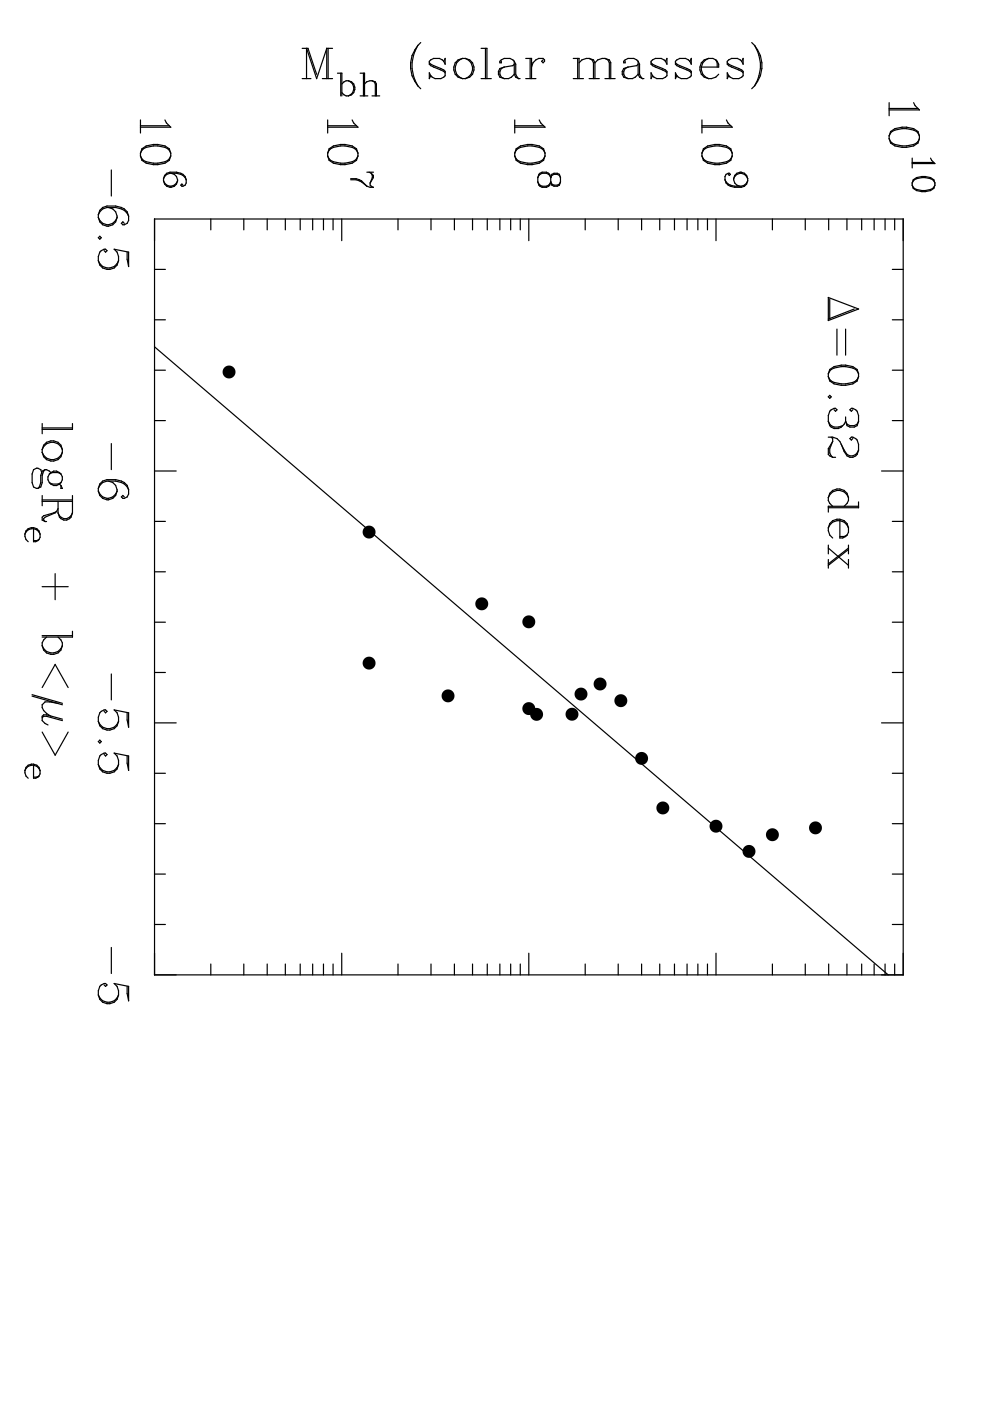
The optimal solution (using all 18 data points) is
| (2) |
and is shown in Figure 1. The scatter in the direction is 0.32 dex.
Upon the exclusion of NGC 4742, the optimal relation is
| (3) |
and the scatter is reduced to 0.25 dex — which is the same level of scatter in the – relation upon the removal of two outliers (Graham & Driver 2007). This level of scatter is also equal to the value reported by Marconi & Hunt (2003) who also used a combination of two parameters ( and ) to predict .
The low value of 0.19 dex reported by Barway & Kembhavi appears to have arisen by dividing the scatter in the direction (0.061) by the coefficient in front of the term in their equation 3 (which is their fitted plane). This overlooks the three-dimensional nature of the plane and consequently results in the over-estimation of the plane’s ability to predict black hole masses. An easy check is to compute the offset between the black hole masses listed in Table 1 of Barway & Kembhavi and the values predicted from their plane (their equation 3), which can be re-written as
| (4) |
Doing so (and excluding NGC 4742) the total rms scatter in the direction is 0.27 dex (not 0.19 dex, and greater than the value of 0.25 dex obtained using the optimal plane constructed here).
In passing it is noted that three of the galaxies used by Barway & Kembhavi are known to be disc galaxies, or at least are not regular elliptical galaxies. M32 may likely be a stripped S0 galaxy (e.g. Graham 2002), while NGC 2778 is a disc galaxy (e.g. Rix, Carollo & Freeman 1999), as is NGC 4564 (Trujillo et al. 2004; see also figure 6 in Graham & Driver 2007). Consequently, the effective radii and mean surface brightnesses which have been used for these galaxies do not pertain to the bulge. Curiously, excluding these three galaxies (while including NGC 4742), the rms scatter is 0.33 dex.
- (1) Barway, S., Kembhavi, A. 2007, ApJ, accepted (arXiv:0705.1508)
- (2) Ferrarese, L., Merritt, D. 2000, ApJ, 539, L9
- (3) Gebhardt, K., et al. 2000, AJ, 119, 1157
- (4) Graham, A.W. 2002, ApJ, 568, L13
- (5) Graham, A.W. 2007, MNRAS, in press (arXiv:0705.0618)
- (6) Graham, A.W., Driver, S.P. 2007, ApJ, 655, 77
- (7) Marconi, A., Hunt, L.K. 2003, ApJ, 589, L21
- (8) Rix, H.-W., Carollo, C.M., Freeman, K. 1999, ApJ, 513, L25
- (9) Trujillo, I., Erwin, P., Asensio Ramos, A., Graham, A.W. 2004, AJ, 127, 1917