Crossover from time-correlated single-electron tunneling to that of Cooper pairs
Abstract
We have studied charge transport in a one-dimensional chain of small Josephson junctions using a single-electron transistor. We observe a crossover from time-correlated tunneling of single electrons to that of Cooper pairs as a function of both magnetic field and current. At relatively high magnetic field, single-electron transport dominates and the tunneling frequency is given by , where is the current through the chain and is the electron’s charge. As the magnetic field is lowered, the frequency gradually shifts to for fA, indicating Cooper-pair transport. For the parameters of the measured sample, we expect the Cooper-pair transport to be incoherent.
pacs
73.23.Hk, 73.23.-b, 85.35.Gv, 85.25.CpCharge transport in 1D and 2D arrays of small Josephson junctions exhibits a wide range of physical phenomena.Fazio-vdZant-PhysRep-01 In these systems there is a competition between the Coulomb blockade, which tends to localize charge, and the Josephson effect, which tends to delocalize it. Depending on the parameters of the Josephson junctions in the array, the transport can be described in terms of either vortices or charges, which are dual entities in a superconducting system in the sense that phase and charge are conjugate variables. For strong Josephson coupling, , the transport is better described in terms of vortices. On the other hand, if the charging energy, , is larger, the system is better described in terms of charge transport. This duality is not perfect since charge can be carried by either Cooper pairs or electrons, whereas there is only one type of vortex. Thus the competition between Cooper-pair tunneling and single-electron tunneling is of particular interest.
We have previously demonstrated that single electrons can be counted one by one as they tunnel through a 1D series-array of small metallic islands connected by Josephson junctions.Bylander-Nature-05 As one excess electron charges an island in the array, it polarizes the neighboring islands and forms a single-charge “soliton.”Likharev-IEEETransMag25-89; BenJacobMullenAmman-PLA-89 Different solitons affect each other by Coulomb repulsion, and therefore they form a 1D Wigner-like lattice that moves along the array. This spatial separation enables a detector to resolve the individual charges as they pass by. Moreover, their passage is time correlatedBenJacobGefen-PLA-85; Averin-JLTP62-86; Delsing-PRL63-1861-89 with the frequency , where is the current and the electron’s charge. As detector, we used a single-electron transistorLikharev-IEEE-mag-87; FultonDolan-PRL-87 (SET) connected to the end of the array.
In Ref. Bylander-Nature-05 we only discussed the single electron transport. However, since the array is superconducting, the current can be carried either by electrons or by Cooper pairs. In this paper, we report new results from measurements on the same device (Fig. 1), where we now study the competition between single-electron tunneling and single Cooper-pair tunneling. We demonstrate a crossover from single-electron transport to Cooper-pair transport as a function of magnetic field and current.
The studied array is in the strong charging limit, , and is consequently best described in terms of charge transport. Apart from single electron tunneling, we can in principle have two different kinds of Cooper-pair tunneling: coherent and incoherent. The former is equivalent to Bloch oscillations,Likharev-JLTP59-85; Kuzmin-PRL67p2890-91 where the system adiabatically follows the lower energy band of each junction without dissipation. The latter involves transitions to excited states and exchange of energy with the environment.Devoret-PRL-90; Averin-PhysB-90 In this particular sample, is smaller than the thermal energy , and the system can therefore easily be excited, leading to dissipation and loss of coherence. Thus any Cooper-pair transport in our device should be predominantly incoherent.

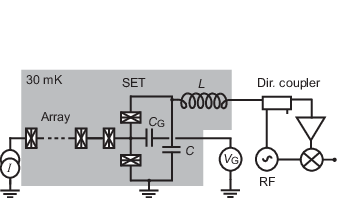
We fabricated the sample using e-beam lithography and triple angle evaporation of aluminum, allowing us to use different oxidation parameters for the array and SET junctions. The average normal state resistance for each of the array junctions was , which gives 10 mK. The charging energy per junction was K, corresponding to a junction capacitance of fF. The capacitance to ground of each island was fF, giving a single-electron soliton size , which is the number of islands over which the array is polarized by a single excess charge. The SET source–drain resistance was . A SEM picture of a sample is shown in Fig. 1(a), and array current–voltage characteristics in the lower graph of Fig. 2.
We performed the measurements in a dilution refrigerator at approximately 30 mK. A magnetic field of up to 3 T could be applied parallel to the substrate. We determined the parallel critical field for our sample from curves of the SET to be mT.
The SET was embedded in an circuit and operated in the radio-frequency mode (RF-SET);Schoelkopf-Science-98 the resonance frequency was 358 MHz and the bandwidth 10 MHz. The circuit’s reflection coefficient depends sensitively on the charge induced on the SET island. After amplification by cold and room temperature amplifiers, the reflected signal was demodulated by homodyne mixing and the baseband signal was then measured by a spectrum analyzer, see Fig. 1(b). The charge sensitivity is, in general, magnetic field dependent, but was typically in our measurement.
The array was biased using a Keithley 263 Calibrator/Source in feedback mode to maintain a constant average current. The biasing line for the array was heavily filtered using both stainless steel powder filters and commercial filters.Bladh-RevSciInstr-03
When a constant bias is applied, charge solitons move through the array and approach the SET. The space correlation of the Wigner lattice translates into time correlated tunneling of charges into the SET at the end of the array. Since the full tunneling charge is injected into the SET island, the SET acts as a non-linear charge detector. Numerical simulationsLikharev-IEEETransMag25-89 show, that the charging of the SET island occurs quasi-continuously, whereas the discharge happens abruptly by a tunneling event. Because of the limited bandwidth of our detector, we can only follow the gradual charging, but not the much faster tunneling event.
Our limited sensitivity prevents us from discriminating the gradual charging due to single electrons from that of Cooper pairs, as either tunneling event gives rise only to a “click” in the detector response. However, we can discriminate by frequency; if the current is carried by electrons, the frequency will be , whereas if it is carried by Cooper pairs it will be . The power spectrum of the signal will thus reveal information about the type of charge carrier.
The upper graph in Fig. 2 shows the power spectral density of the output signal from the mixer for several different values of magnetic field, when the array is biased with a constant current of 275 fA (from top to bottom, goes from 100 to 500 mT in steps of 50 mT). For a field of 500 mT the spectrum has a clear peak at the frequency (the dashed line to the right in Fig. 2). This peak is due to time correlated transport of single electrons.Bylander-Nature-05


At fields higher than 500 mT, the characteristic becomes very steep, and thus the current becomes very sensitive to fluctuations in the bias and to background charges, as discussed in Ref. Bylander-Nature-05. Therefore, the peak in the spectral density is smeared and disappears into the noise floor. For decreasing magnetic field, the peak gradually moves to lower frequencies, and around 200 mT it appears at (left dashed line in Fig. 2). At even lower fields, the peak is smeared and could not be observed below 100 mT.
We define an effective charge as the nominal array current divided by the peak frequency, , as obtained from fitting to a Lorentzian and a background, where . In the intermediate regime, where , there is a mixture of extra single electrons and Cooper pairs in the array. In Fig. 3(a), we show how changes as a function of magnetic field for a fixed bias current fA. For mT, Cooper pair transport dominates; in the intermediate regime, mT, there is coexisting and transport; and for mT, there is predominantly single-electron transport. In Fig. 3(b), we show how varies as a function of current for a fixed magnetic field mT. Here, the mixed and transport occurs in the region below fA, whereas above this current.

Figure 4(a) shows that this magnetic field-induced crossover occurs only for relatively high current; at low current, for all magnetic fields. Moreover, this figure shows that the current-induced crossover occurs only at low magnetic field, where low current favors electron transport whereas high current favors Cooper-pairs. The measured voltages (in mV) across the array are shown as contours.
In Fig. 4(b), we display the normalized width of the peak (half width divided by frequency) for the same currents and magnetic fields as in (a). It is clear that the sharpness, i.e., the degree of correlation between successive tunneling events, is greater when the transport is dominated by single-electron tunneling, and for small currents where there are few solitons inside the array at a given time.
The fact that charge transport with only Cooper pairs is less correlated than transport with quasiparticles can be qualitatively explained using energy arguments. The real part of the impedance seen from a junction inside the array is much smaller than the quantum resistance ,Grabert-ZPhysB-91 why energy exchange with the environment is very ineffective for Cooper pairs. Therefore, they tunnel in principle only when the charging energy difference before and after the tunneling event is smaller than . On the contrary, quasiparticles are energetically allowed to tunnel as soon as the charging energy difference is positive. Thus, the Cooper pairs are more prone to be trapped inside the array, degrading the time correlation. Fluctuating background charges, and also approaching solitons, can change the local bias of a junction so that the elastic channel opens and the Cooper pair tunnels. In the regime with mixed and transport, the peak sharpening when approaches suggests, that the more mobile solitons (quasiparticles) are indeed effective in “freeing” the solitons (Cooper pairs).

The situation is thus rather complex with a number of things that affect the transport, including randomly distributed background charges, non-equilibrium quasiparticles of unknown density, and the electromagnetic environment. Therefore, a complete quantitative description of these results is hard to attain. We can, however, give a number of qualitative arguments to explain the observed phenomena.
Which type of transport will dominate is largely determined by the type of carrier that is being injected at the first junction, since well inside the array, the charges repel each other. The threshold for injecting a single electron depends on the magnetic field since the energy has to be supplied to break a Cooper pair. At zero temperature, can be calculated from electrostatic energy considerations.footnote In our limit (and ignoring the effect of random background charges), we get for electrons and Cooper pairs, respectively:
| (1) |
Here fF is the effective island capacitance, K is the first island’s charging energy, and K is the superconducting energy gap of our aluminum thin films at zero magnetic field and temperature. The dependence (1) is displayed in the inset in Fig. 3(a), where we have assumed the following empiricalDelsing-PRB-94 magnetic field dependence of the gap: . For the given parameters of our sample, mV and mV. Background charges will, however, modify these thresholds. For an array of this size, and the part of that does not depend on become approximately three times larger.Melsen-PRB-97 At low field, we therefore expect Cooper pairs to dominate, which is what we do observe for fA. At larger fields, is suppressed, and therefore also , why at a given field the single-electron transport becomes significant.
Inside the array, there is also a possibility that a Cooper-pair soliton centered on one island decays into two single-electron solitons centered on adjacent islands. This happens when the difference between the Cooper-pair and single-electron charging energies is smaller than . Again disregarding background charges, the condition for this is
| (2) |
which is satisfied for mT, meaning that we should detect pure transport for higher fields. This agrees qualitatively with the data in Fig. 3(a), however, we note that thermal fluctuations can break a metastable Cooper pair at lower fields.
The arguments of the preceding paragraphs explain qualitatively the magnetic field dependence of the crossover at relatively large currents. Let us now turn to the current dependent crossover that occurs for fA and mT and consider the different electron and Cooper-pair tunneling rates. At the temperature of our experiment there should be practically no thermally excited quasiparticles, but experiments have shown that there are often non-equilibrium quasiparticles residing in the leads.Aumentado-PRL-04 The threshold voltage for them to enter into the array is lower than that for Cooper pairs, . This means that for only the non-equilibrium quasiparticles will enter and we should see pure transport. Above we expect to see mixed and transport, and the different tunneling rates compete. The quasiparticle tunneling rate is proportional to the number of non-equilibrium quasiparticles present in the leads. This number is, in turn, determined through the competition between the process generating the quasiparticles, their recombination, and the current, draining the quasiparticles into the array. The situation is similar to that of quasiparticle poisoning in the Cooper pair box, where a similar phenomenon has been observedSchneiderman-LT-24 and theoretically described.Lutchyn-PRB-05 This picture qualitatively explains the behavior seen in Fig. 3(b). An interesting aspect of this observation is that it should be possible to extract information about the density of non equilibrium quasiparticles by making more elaborate experiments of this kind.
In conclusion, we have demonstrated time correlated tunneling of both individual electrons and individual Cooper pairs, and coexistence of the two, in a 1D array of small Josephson junctions. We have shown that there is a crossover from single-electron transport to single Cooper-pair transport as a function of both the external magnetic field and the current through the array. We describe the transport in terms of different threshold voltages for injection of charge into the array, and instability of Cooper pairs inside the array.
We made the sample in the MC2 Nanofabrication Laboratory at Chalmers. We acknowledge helpful discussions with A. Käck, A. Zorin, and the members of the Quantum Device Physics Laboratory at MC2. This work was supported by the Swedish SSF, VR and by the Wallenberg Foundation.
References
- (1) R. Fazio and H. van der Zant, Phys. Rep. 355, 235 (2001).
- (2) J. Bylander, T. Duty, and P. Delsing, Nature 434, 361 (2005).
- (3) K. K. Likharev, N. S. Bakhvalov, G. S. Kazacha, and S. I. Serdyukova, IEEE Trans. Magn. 25, 1436 (1989); N. S. Bakhvalov, G. S. Kazacha, K. K. Likharev, and S. I. Serdyukova, Sov. Phys. JETP 68, 581 (1989).
- (4) E. Ben-Jacob, K. Mullen and M. Amman, Phys. Lett. A 135, 390 (1989).
- (5) E. Ben-Jacob and Y. Gefen, Phys. Lett. 108A, 289 (1985).
- (6) D. V. Averin and K. K. Likharev, J. Low Temp. Phys. 62, 345 (1986).
- (7) P. Delsing, K. K. Likharev, L. S. Kuzmin, and T. Claeson, Phys. Rev. Lett. 63, 1861 (1989).
- (8) K. K. Likharev, IEEE Trans. Magn. 23, 1142 (1987).
- (9) T. A. Fulton and G. J. Dolan, Phys. Rev. Lett. 59, 109 (1987).
- (10) D. V. Averin, A. B. Zorin, and K. K. Likharev, Sov. Phys. JETP 61, 407 (1985); K. Likharev and A. Zorin, J. Low Temp. Phys. 59, 347 (1985).
- (11) L. S. Kuzmin and D. B. Haviland, Phys. Rev. Lett. 67, 2890 (1991).
- (12) M. H. Devoret, D. Esteve, H. Grabert, G.-L. Ingold, H. Pothier, and C. Urbina, Phys. Rev. Lett. 64, 1824 (1990).
- (13) D. V. Averin, Yu. V. Nazarov, and A. A. Odintsov, Physica B 165/166, 945 (1990).
- (14) R. J. Schoelkopf, P. Wahlgren, A. A. Kozhevnikov, P. Delsing, and D. E. Prober, Science 280, 1238 (1998).
- (15) K. Bladh, D. Gunnarsson, E. Hürfeld, S. Devi, C. Kristofersson, B. Smålander, S. Pehrson, T. Claeson, P. Delsing, and M. Taslakov, Rev. Sci. Instrum. 74, 1323 (2003).
- (16) H. Grabert, G.-L. Ingold, M. H. Devoret, D. Estève, H. Pothier, and C. Urbina, Z. Phys. B 84, 143-155 (1991).
- (17) We derived Eq. (1) in the same way as in Ref. Bylander-Nature-05, but here we have written it in a different form. We note that there is a slight error in the expression for in Ref. Bylander-Nature-05.
- (18) P. Delsing, C. D. Chen, D. B. Haviland, Y. Harada, and T. Claeson, Phys. Rev. B 50, 3959 (1994).
- (19) J. A. Melsen, U. Hanke, H.-O. Müller, and K.-A. Chao, Phys. Rev. B 55, 10638 (1997).
- (20) J. Aumentado, M. W. Keller, J. M. Martinis, and M. H. Devoret, Phys. Rev. Lett. 92, 066802 (2004).
- (21) J. F. Schneiderman, P. Delsing, G. Johansson, M. D. Shaw, H. M. Bozler, and P. M. Echternach, in Proc. LT24 Int. Conf. Low Temp. Phys., Orlando, 2005, eds Y. Takano, S. P. Hershfield, S. O. Hill, P. J. Hirschfeld, and A. M. Goldman, AIP Conf. Proc. No. 850 (AIP Melville, NY, 2006), p. 931; A. Guillaume, J. F. Schneiderman, P. Delsing, H. M. Bozler, and P. M. Echternach, Phys. Rev. B 69, 132504 (2004).
- (22) R. Lutchyn, L. Glazman, and A. Larkin, Phys. Rev. B 72, 014517 (2005); J. Mannik and J. E. Lukens, Phys. Rev. Lett. 92, 057004 (2004).