Game-Theoretic Power Control in Impulse Radio UWB Wireless Networks
Abstract
In this paper, a game-theoretic model for studying power control for wireless data networks in frequency-selective multipath environments is analyzed. The uplink of an impulse-radio ultrawideband system is considered. The effects of self-interference and multiple-access interference on the performance of Rake receivers are investigated for synchronous systems. Focusing on energy efficiency, a noncooperative game is proposed in which users in the network are allowed to choose their transmit powers to maximize their own utilities, and the Nash equilibrium for the proposed game is derived. It is shown that, due to the frequency selective multipath, the noncooperative solution is achieved at different signal-to-interference-plus-noise ratios, respectively of the channel realization. A large-system analysis is performed to derive explicit expressions for the achieved utilities. The Pareto-optimal (cooperative) solution is also discussed and compared with the noncooperative approach.
I Introduction
As the demand for wireless services increases, the need for efficient resource allocation and interference mitigation in wireless data networks becomes more and more crucial. A fundamental goal of radio resource management is transmitter power control, which aims to allow each user to achieve the required quality of service (QoS) at the uplink receiver without causing unnecessary interference to other users in the system. Another key issue in wireless system design is energy consumption at user terminals, since the terminals are often battery-powered. Recently, game theory has been used as an effective tool to study power control in data networks [1, 2, 3, 4, 5, 6, 7, 8]. In [1], the authors provide motivations for using game theory to study power control in communication systems and ad-hoc networks. In [2], power control is modeled as a noncooperative game in which the users choose their transmit powers to maximize their utilities, defined as the ratio of throughput to transmit power. In [3], a network-assisted power-control scheme is proposed to improve the overall utility of a direct-sequence code-division multiple access (DS-CDMA) system. In [4, 5], the authors use pricing to obtain a more efficient solution for the power control game. Joint network-centric and user-centric power control are discussed in [6]. In [7], the authors propose a power control game for multicarrier CDMA (MC-CDMA) systems, while in [8] the effects of the receiver have been considered, particularly extending the study to multiuser detectors and multiantenna receivers.
This work considers power control in ultrawideband (UWB) systems. UWB technology is considered to be a potential candidate for next-generation short-range high-speed data transmission, due to its large spreading factor (which implies large multiuser capacity) and low power spectral density (which allows coexistence with incumbent systems in the same frequency bands). Commonly, impulse-radio (IR) systems, which transmit very short pulses with a low duty cycle, are employed to implement UWB systems [9]. In an IR system, a train of pulses is sent and the information is usually conveyed by the position or the polarity of the pulses, which correspond to Pulse Position Modulation (PPM) and Binary Phase Shift Keying (BPSK), respectively. To provide robustness against multiple access interference (MAI), each information symbol is represented by a sequence of pulses; the positions of the pulses within that sequence are determined by a pseudo-random time-hopping (TH) sequence that is specific to each user [9]. In “classical” impulse radio, the polarity of those pulses representing an information symbol is always the same, whether PPM or BPSK is employed [9]. Recently, pulse-based polarity randomization was proposed [10], where each pulse has a random polarity code in addition to the modulation scheme, providing additional robustness against MAI [11] and helping to optimize the spectral shape according to US Federal Communications Commission (FCC) specifications [12]. Due to the large bandwidth, UWB signals have a much higher temporal resolution than conventional narrowband or wideband signals. Hence, channel fading cannot be assumed to be flat [13], and self-interference (SI) must be taken into account [14]. To the best of our knowledge, this paper is the first to study the problem of radio resource allocation in a frequency-selective multipath environment using a game-theoretic approach. Previous work in this area has assumed flat fading [15, 16, 17].
Our focus throughout this work is on energy efficiency. In this kind of application it is often more important to maximize the number of bits transmitted per Joule of energy consumed than to maximize throughput. We thus propose a noncooperative (distributed) game in which users are allowed to choose their transmit powers according to a utility-maximization criterion.
The remainder of this paper is organized as follows. In Sect. II, we provide some background for this work. The system model is given in Sect. III. We describe out power control game in Sect. IV and analyze the Nash equilibrium for this game. In Sect. V, we use the game-theoretic framework along with a large-system analysis to evaluate the performance of the system in terms of transmit powers and achieved utilities. The Pareto-optimal (cooperative) solution to the power control game is discussed in Sect. VI, and its performance is compared with that of the noncooperative approach. Numerical results are discussed in Sect. VII, and finally some conclusions are drawn in Sect. VIII.
II Background
Consider the uplink of an IR-UWB data network, where every user wishes to locally and selfishly choose its action to maximize its own utility function. The strategy chosen by a user affects the performance of the other users in the network through MAI. Furthermore, since a realistic IR-UWB transmission takes place in frequency-selective multipath channels, the effect of SI cannot be neglected.
Game theory [1] is the natural framework for modeling and studying such interactions. To pose the power control problem as a noncooperative game, we first need to define a utility function suitable for measuring energy efficiency for wireless data applications. A tradeoff relationship is apparent to exist between obtaining high signal-to-interference-plus-noise ratio (SINR) and consuming low energy. These issues can be quantified [2] by defining the utility function of the th user to be the ratio of its throughput to its transmit power , i.e.
| (1) |
where is the vector of transmit powers, with denoting the number of users in the network. Throughput here refers to the net number of information bits that are received without error per unit time (sometimes referred to as goodput). It can be expressed as
| (2) |
where and are the number of information bits and the total number of bits in a packet, respectively; and are the transmission rate and the SINR for the th user, respectively; and represents the packet success rate (PSR), i.e., the probability that a packet is received without an error. Our assumption is that a packet will be retransmitted if it has one or more bit errors. The PSR depends on the details of the data transmission, including its modulation, coding, and packet size. In most practical cases, however, is increasing and S-shaped11 1 An increasing function is S-shaped if there is a point above which the function is concave, and below which the function is convex. (sigmoidal). For example, in the case of BPSK TH-IR systems in multipath fading channels, is given by , where is the bit error rate (BER) of user , with denoting the complementary cumulative distribution function of a standard normal random variable.
To prevent the mathematical anomalies described in [2], we replace PSR with an efficiency function when calculating the throughput for our utility function.22 2 Although is introduced for analytical tractability, it is worth noting that typical SINRs yield negligible differences between PSR and . A useful example for the efficiency function is , which serves as a reasonable approximation to the PSR for moderate-to-large values of . The plot of this efficiency function is given in Fig. 1 with (see [18] for a detailed discussion of this efficiency function).
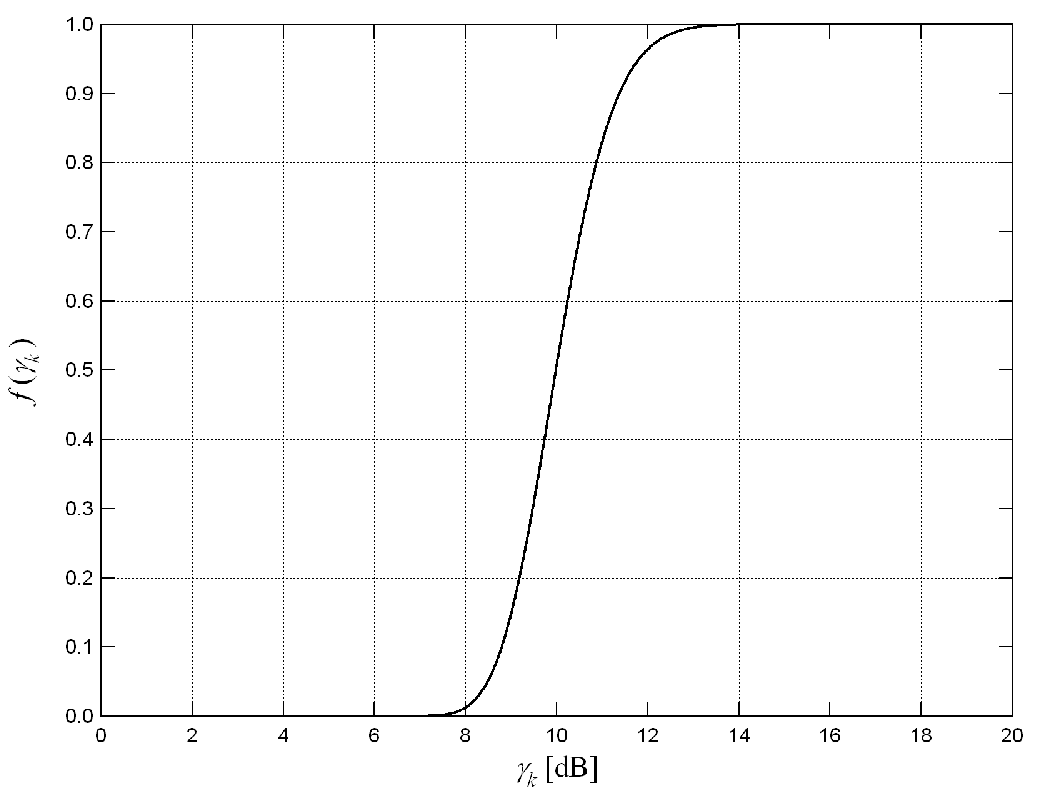
However, our analysis throughout this paper is valid for any efficiency function that is increasing, S-shaped, and continuously differentiable, with , , and . These assumptions are valid in many practical systems. Furthermore, we assume that all users have the same efficiency function. Generalization to the case where the efficiency function is dependent on is straightforward. Note that the throughput in (2) could also be replaced with the Shannon capacity formula if the utility function in (1) is appropriately modified to ensure that when .
Combining (1) and (2), and replacing the PSR with the efficiency function, we can write the utility function of the th user as
| (3) |
This utility function, which has units of bits/Joule, represents the total number of data bits that are delivered to the destination without an error per Joule of energy consumed, capturing the tradeoff between throughput and battery life. Fig. 2 shows the shape of the utility function in (3) as a function of transmit power keeping other users’ transmit power fixed (the meaning of and will be provided in the following).

III System Model
We consider a BPSK random TH-IR system33 3 Throughout all the paper, we analyze IR-UWB systems with polarity code randomization [10]. with users in the network transmitting to a receiver at a common concentration point. The processing gain of the system is assumed to be , where is the number of pulses that represent one information symbol, and denotes the number of possible pulse positions in a frame [9]. The transmission is assumed to be over frequency selective channels, with the channel for user modeled as a tapped delay line:
| (4) |
where is the duration of the transmitted UWB pulse, which is the minimum resolvable path interval; is the number of channel paths; and and are the fading coefficients and the delay of user , respectively. Considering a chip-synchronous scenario, the symbols are misaligned by an integer multiple of the chip interval : , for every , where is uniformly distributed in . In addition we assume that the channel characteristics remain unchanged over a number of symbol intervals. This can be justified since the symbol duration in a typical application is on the order of tens or hundreds of nanoseconds, and the coherence time of an indoor wireless channel is on the order of tens of milliseconds.
Especially in indoor environments, multipath channels can have hundreds of multipath components due to the high resolution of UWB signals. In such cases, linear receivers such as matched filters (MFs), pulse-discarding receivers [19], and multiuser detectors (MUDs) [20] cannot provide good performance, since more collisions will occur through multipath components. In order to mitigate the effect of multipath fading as much as possible, we consider a base station where All-Rake (ARake) receivers [21] are used.44 4 For ease of calculation, perfect channel estimation is considered throughout the paper. In particular, the ARake receiver for user is composed of fingers, where the vector represents the combining weights for user .
The SINR of user at the output of the Rake receiver can be approximated (for large , typically at least 5) by [14]
| (5) |
where is the variance of the additive white Gaussian noise (AWGN) at the receiver, and the gains are expressed by
| (6) | ||||
| (7) | ||||
| (8) |
where the matrices
| (9) |
and
| (10) |
have been introduced for convenience of notation.
By considering frequency selective channels, the transmit power of the th user, , does appears not only in the numerator of (5), but also in the denominator, owing to the SI due to multiple paths. In the following sections, we extend the approach of game theory to multipath channels, accounting for the SI in addition to MAI and AWGN. The problem is more challenging than with a single path since each user achieves a different SINR at the output of its Rake receiver.
IV The Noncooperative Power Control Game
In this section, we propose a noncooperative power control game (NPCG) in which every user seeks to maximize its own utility by choosing its transmit power. Let be the proposed noncooperative game where is the index set for the terminal users; is the strategy set, with and denoting minimum and maximum power constraints, respectively; and is the payoff function for user [5]. Throughout this paper, we assume and for all .
Formally, the NPCG can be expressed as
| (11) |
where denotes the vector of transmit powers of all terminals except the terminal . Assuming equal transmission rate for all users, (11) can be rewritten as
| (12) |
where we have explicitly shown that is a function of .
The solution that is most widely used for game theoretic problems is the Nash equilibrium. A Nash equilibrium is a set of strategies such that no user can unilaterally improve its own utility. Formally, a power vector is a Nash equilibrium of if, for every , for all .
Theorem 1
A Nash equilibrium exists in the NPCG . Furthermore, the unconstrained maximization of the utility function occurs when each user achieves an SINR solution of
| (13) |
where
| (14) |
and .
Lemma 1
The solution of (13) satisfies the condition
| (15) |
Proofs of Theorem 1 and Lemma 1 have been omitted because of space limitation. They can be found in [22].
The Nash equilibrium can be seen from another point of view. The power level chosen by a rational self-optimizing user constitutes a best response to the powers chosen by other players. Formally, terminal ’s best response is the correspondence that assigns to each the set
| (16) |
where is the strategy space of all users excluding user .
The Nash equilibrium can be restated in a compact form: the vector is a Nash equilibrium of the NPCG if and only if for all .
Prop. 1
Proof:
Using Theorem 1, for a given interference, the SINR corresponds to the transmit power :
| (18) |
Since is the unique maximizer of the utility, the correspondence between the transmit power and the SINR must be studied. As can be verified, (18) represents the equation of a hyperbola passing through the origin, with the asymptotes parallel to the Cartesian axes. In particular, the vertical asymptote is . Therefore, using Lemma 1, there exists a one-to-one correspondence between the transmit power, , and the SINR, . Thus, the transmit power is also unique. If for some user , since it is not a feasible point, then cannot be the best response to . In this case, we observe that for any , and hence for any . This implies that the utility function is increasing in that region. Since is the largest power in the strategy space, it yields the highest utility among all and thus is the best response to . ∎
The conclusion is that, at any equilibrium of the NPCG, a terminal either attains the utility maximizing SINR or it fails to do so and transmits at maximum power .
Theorem 2
The NPCG has a unique Nash equilibrium.

V Analysis of the Nash equilibrium
In the previous section, it is seen that a Nash equilibrium for the NPCG exists and is unique. In the following, we study the properties of this equilibrium. It is worth emphasizing that, unlike previous work in this area, is dependent on , because of the SI in (5). Hence, each user attains a different SINR. More importantly, the only term dependent on in (13) is , which is affected only by the channel of user . This means that can be assumed to be constant when the channel characteristics remain unchanged, irrespectively of the transmit powers and the channel coefficients of the other users. For convenience of notation, we can express as a function of :
| (19) |
Fig. 3 shows the shape of as a function of , where , with . Even though is shown for values of approaching , it is worth emphasizing that in most practical situations.
As can be noticed, the NPCG proposed herein represents a generalization of the power control games discussed thoroughly in literature [2, 3, 4, 5, 6, 7, 8]. If , i.e. in a flat-fading scenario, we obtain from (7) and (14) that for all . This implies that is the same for every , and thus it is possible to apply the approach proposed, e.g., in [5].
Assumption 1
To simplify the analysis, let us assume the typical case of multiuser UWB systems, where . In addition, is considered sufficiently large that for those users who achieve . In particular, when , at the Nash equilibrium the following property holds:
| (20) |
The heuristic derivation of (20) can be justified by SI reduction due to the hypothesis . Using (7), for all . Hence, the noncooperative solution will be similar to that studied, e.g., in [8]. The validity of this assumption will be shown in Sect. VII through simulations.
Prop. 2
A necessary and sufficient condition for a desired SINR to be achievable is
| (21) |
where is defined in (14), and .
Proof:
Based on Prop. 1, when all users reach the Nash equilibrium, their transmit powers are
| (23) |
Using Assumption 1 in (23), it is straightforward to obtain:
| (24) |
which implies , proving necessity. It is also straightforward to show that, if each terminal uses transmit power as in (22), all terminals will achieve the SINR requirement, finishing the proof of sufficiency. Finally, consider any other joint distribution of powers and channel realizations, and let . Then, by exactly the same argument as was used in the proof of necessity,
| (25) |
This means that assigning powers according to (22) does indeed give the minimal power solution. ∎
Based on Prop. 2, the amount of transmit power required to achieve the target SINR will depend not only on the gain , but also on the SI term (through ) and the interferers (through ). To derive some quantitative results independent of SI and MAI terms, it is possible to resort to a large systems analysis.
Assumption 2
Consider an exponential decaying averaged Power Delay Profile (aPDP) for the channel coefficients [23]. Let us assume a network where , , and , with . If an ARake receiver is used,
| (26) |
The accuracy of this approximation will be verified in Sect. VII using simulations.
Prop. 3
When the hypotheses of Assumption 2 hold, using (21) and (26), a necessary and sufficient condition for the target SINR to be achievable is55 5 In order for the analysis to be consistent, and also considering regulations by the FCC [12], it is worth noting that could not be smaller than a certain threshold ().
| (27) |
where is the ceiling operator, and .
In addition, the desired SINR approaches for every user, thus leading to a nearly SINR-balancing scenario.
Based on Prop. 3, it is possible to provide expressions for users’ transmit powers and utilities at the Nash equilibrium (see Fig. 2), which are independent of the channel realizations of the other users and of the SI:66 6 Of course, the amount of transmit power needed to achieve is dependent on the channel realization of user .
| (28) | ||||
| (29) |
The validity of these claims will also be confirmed through simulations in Sect. VII.
VI Social Optimum
The solution to the power control game is said to be Pareto-optimal if there exists no other power allocation for which one or more users can improve their utilities without reducing the utility of any of the other users. It can be shown that the Nash equilibrium presented in the previous section is not Pareto-optimal. This means that it is possible to improve the utility of one or more users without harming other users. On the other hand, it can be shown that the solution to the following social problem gives the Pareto-optimal frontier [8]:
| (30) |
for . Pareto-optimal solutions are, in general, difficult to obtain. Here, we conjecture that the Pareto-optimal solution occurs when all users achieve the same SINRs, . This approach is chosen not only because SINR balancing ensures fairness among users in terms of throughput and delay [8], but also because, for large systems, the Nash equilibrium is achieved when all SINRs are similar. We also consider the hypothesis , suitable for a scenario without priority classes. Hence, (30) can be written as
| (31) |
In a network where Assumptions 1 and 2 hold, at the Nash equilibrium all users achieve a certain output SINR with , where
| (32) |
with . Therefore, (31) can be expressed as
| (33) |
since there exists a one-to-one correspondence between and . It should be noted that, while the maximizations in (12) consider no cooperation among users, (31) assumes that users cooperate in choosing their transmit powers. That means that the relationship between the user’s SINR and transmit power will be different from that in the noncooperative case.
Prop. 4
In a network where , , and , the Nash equilibrium approaches the Pareto-optimal solution.
Proof:
The solution to (33) must satisfy the condition . Using this fact, combined with (32), gives us the equation that must be satisfied by the solution of the maximization problem in (33):
| (34) |
We see from (34) that the Pareto-optimal solution differs from the solution (13) of the noncooperative utility-maximizing method, since (34) also takes into account the contribution of the interferers. In particular,
| (35) |
Since the function is increasing with its argument for any S-shaped (as can also be seen in Fig. 3), and since for all (from (26)),
| (36) |
due to (19) and (35). On the other hand, typical values of and lead to . Thus, . From (36), it is apparent that as well. This means that, in almost all practical scenarios, the target SINR for the noncooperative game, , is close to the target SINR for the Pareto-optimal solution, . Consequently, the average utility provided by the Nash equilibrium is close to the one achieved according to the Pareto-optimal solution. ∎
The validity of the above claims will be verified in Sect. VII using simulations.
| (20,8) | (20,16) | (50,8) | (50,16) | |
| (30,10) | 9.4E-4 | 3.2E-3 | 4.8E-4 | 1.7E-3 |
| (30,50) | 2.9E-5 | 6.4E-5 | 1.6E-5 | 3.4E-5 |
| (50,10) | 2.9E-4 | 6.8E-4 | 1.5E-4 | 3.7E-4 |
| (50,50) | 1.0E-5 | 2.2E-5 | 0.6E-5 | 1.2E-5 |
| (100,10) | 6.7E-5 | 1.5E-4 | 3.7E-5 | 7.8E-5 |
| (100,50) | 0.3E-5 | 0.6E-5 | 0.1E-5 | 0.3E-5 |
| (20,8) | (20,12) | (50,8) | (50,12) | |
| 0.01 | 0.004 | 0.003 | 0.004 | 0.003 |
| 0.02 | 0.004 | 0.004 | 0.004 | 0.005 |
| 0.03 | 0.004 | 0.005 | 0.004 | 0.005 |
| 0.04 | 0.005 | 0.007 | 0.005 | 0.007 |
| 0.05 | 0.006 | 0.009 | 0.006 | 0.009 |
VII Numerical Results
In this section, we discuss numerical results for the analysis presented in the previous sections. We assume that each packet contains of information and no overhead (i.e., ). The transmission rate is , the thermal noise power is , and . We use the efficiency function , which serves as a reasonable approximation to the PSR for moderate-to-large values of . Using , . To model the UWB scenario, channel gains are simulated following [24] . The distance between users and base station is assumed to be uniformly distributed between and .
Before showing the numerical results for both the noncooperative and the cooperative approaches, some simulations are provided to verify the validity of Assumptions 1 and 2 introduced in Sect. V. Table I reports the ratio of the variance to the squared mean value of , obtained by averaging realizations of channel coefficients for different values of network parameters using ARake receivers. We can see that, when the processing gain is much greater than the number of users, . Hence, (20) can be used to carry out the theoretical analysis of the Nash equilibrium.
Table II shows the accuracy of the approximation (26) for the term , where random realizations of fading coefficients are employed.77 7 It is worth emphasizing that the channel model proposed in [24] fulfills the hypothesis of exponential decay of the aPDP. Simulations are performed for different values of , , and , using ARake receivers. In the right column, the ratio of the mean squared error (mse) of the estimation to the squared approximation is reported. Like before, it can be noticed that, in the worst case, such ratio is smaller than , validating (26).

Fig. 4 shows the utility as a function of the channel gain when is constant, but the ratio is variable. The results have been obtained for a network with users, channel paths and , using ARake receivers at the base station. The lines represent the theoretical values provided by (29), while the markers report the simulation results. The solid line corresponds to , and the dashed line shows . We can see that the simulations match closely with the theoretical results. In addition, as expected, higher ratios (and thus higher , when is fixed), correspond to higher utility, since is proportional to , which increases as increases. This result complies with theoretical analysis of UWB systems [14], since, for a fixed total processing gain , increasing the number of chips per frame, , will decrease the effects of SI, while the dependency of the expressions on the MAI remains unchanged. Hence, a system with a higher achieves better performance.
Fig. 5 shows the probability of having at least one user transmitting at the maximum power, i.e., , as a function of the number of frames . We consider realizations of the channel gains, using a network with ARake receivers at the base station, users, , and (thus ). In (27), it has been shown that the minimum value of that allow all users to achieve the optimum SINRs is . Simulations thus agree with the analytical results of Sect. V.

We now analyze the performance of the system when using a Pareto-optimal solution instead of the Nash equilibrium. Fig. 6 shows the normalized utility as a function of the load factor . We consider a network with users, frames and ARake receivers at the base station. The lines represent theoretical values of Nash equilibrium (dotted line), using (29), and of the social optimum solution (solid line), using (29) again, but substituting with the numerical solution of (34), . The markers correspond to the simulation results. In particular, the circles represent the averaged solution of the NPCG iterative algorithm, while the square markers show averaged numerical results (through a complete search) of the maximization (30), with . As stated in Sect. VI, the difference between the noncooperative approach and the Pareto-optimal solution is not significant, especially for lower values of the load factor . Fig. 7 compares the target SINRs of the noncooperative solutions with the target SINRs of the Pareto-optimal solutions. As before, the lines correspond to the theoretical values (dashed line for the noncooperative solution, solid line for the social optimum solution), while the markers represent the simulation results (circles for the noncooperative solutions, square markers for the Pareto-optimal solution). It is seen that, in both cases, the average target SINRs for the Nash equilibrium, , and for the social optimum solution, , are very close to , as shown in Sect. VI.
VIII Conclusion and Perspectives
In this paper, we have used a game-theoretic to study power control for a wireless data network in frequency-selective environments, where the user terminals transmit IR-UWB signals and the common concentration point employs ARake receivers. A noncooperative game has been proposed in which users are allowed to choose their transmit powers according to a utility-maximizing criterion, where the utility function has been defined as the ratio of the overall throughput to the transmit power. For this utility function, we have shown that there exists a unique Nash equilibrium for the proposed game, but, due to the frequency selective multipath, this equilibrium is achieved at a different output SINR for each user, depending on the channel realization. Using a large system analysis, we have obtained explicit expressions for the utilities achieved at the equilibrium. It has also been shown that, under certain conditions, the noncooperative solution leads to a nearly SINR-balancing scenario. In order to evaluate the efficiency of the Nash equilibrium, we have studied an optimum cooperative solution, where the network seeks to maximize the sum of the users’ utilities. It has been shown that the difference in performance between Nash and cooperative solutions is not significant for typical values of network parameters.

Further improvement in the proposed analysis can be achieved using additional mathematical tools, including the weak version of the law of large numbers. This approach allows a more accurate approximation of the interfering terms to be derived. Furthermore, a more general model can be described, which considers different types of Rake receivers and a broader class of power delay profiles.
References
- [1] A.B. MacKenzie and S.B. Wicker, “Game theory in communications: Motivation, explanation, and application to power control,” in Proc. IEEE Globecom Telecommun. Conf., San Antonio, TX, 2001, pp. 821-826.
- [2] D.J. Goodman and N.B. Mandayam, “Power control for wireless data,” IEEE Pers. Commun., Vol. 7, pp. 48-54, Apr. 2000.
- [3] D.J. Goodman and N.B. Mandayam, “Network assisted power control for wireless data,” in Proc. IEEE Veh. Technol. Conf., Rhodes, Greece, 2001, pp. 1022-1026.
- [4] C.U. Saraydar, N.B. Mandayam and D.J. Goodman, “Pricing and power control in a multicell wireless data network,” IEEE J. Sel. Areas Commun., Vol. 19 (10), pp. 1883-1892, Oct. 2001.
- [5] C.U. Saraydar, N.B. Mandayam and D.J. Goodman, “Efficient power control via pricing in wireless data networks,” IEEE Trans. Commun., Vol. 50 (2), pp. 291-303, Feb. 2002.
- [6] N. Feng, S.-C. Mau and N.B. Mandayam, “Pricing and power control for joint network-centric and user-centric radio resource management,” IEEE Trans. Commun., Vol. 52 (9), pp. 1547-1557, Sep. 2004.

_cache/cs/pdf/0701/0701017.pdf.