The metallicity distributions in high-latitudes with SDSSJournal: New Astronomy
Abstract
We present metallicities and their variations with different parameters for 36 high-latitude fields covering Galactic longitudes . The metallicities for relatively short vertical distances ( kpc) show systematic fluctuations with Galactic longitude, similar to those of the thick-disc scaleheight, which may be interpreted as indicating a common origin, viz., the flare effect of the disc (Bilir et al. 2007). This suggestion is supported by the metallicity variations which we find as functions of radial distance.
The metallicity variation at larger vertical distances ( kpc) is small but monotonic. Three different vertical metallicity gradients could be detected: , , and dex kpc-1 for the intervals , , and kpc, respectively. Since our data cover the whole Galactic longitude interval, the resulting metallicity gradients can be interpreted as properties of the larger-scale Galaxy. The first gradient confirms the dissipational formation of the disc at short –distances. The steeper gradient corresponds to the transition region between different population components of the Galaxy, and finally, the lowest value provides an adequate description of the inner-halo metallicity gradient.
Keywords:
98.35.Ac Origin, formation, evolution, age, and star formation , 98.35.Bd Chemical composition and chemical evolution , 98.35.Ln Stellar content and populations; morphology and overall structure ,, , ,
1 Introduction
The metallicity distribution of G-type stars can be used for the interpretation of the formation and chemical evolution of the related Galactic components. For example, a metallicity gradient for a particular component of our Galaxy may indicate that this component formed by dissipational collapse, while the absence of a metallicity gradient may provide strong evidence of a merger and/or accretion origin from – possibly numerous – fragments, such as dwarf-type galaxies. The pioneering work on the dissipational collapse of the Galaxy is that of Eggen, Lynden-Bell & Sandage 1962 who argued that the Galaxy collapsed in a free-fall time ( yr). Now, we know that the Galaxy collapsed over many Gyr (e.g. Yoshii & Saio 1979; Norris, Bessell & Pickles 1985; Norris 1986; Sandage & Fouts 1987; Carney, Latham & Laird 1990; Norris & Ryan 1991; Beers & Sommer-Larsen 1995). On the other hand, the merger or accretion scenario of galaxy formation was first advocated by Searle & Zinn 1978; for a survey of the more recent literature on the subject, we refer the reader to Freeman & Bland-Hawthorn 2002.
Extant data comprise vertical metallicity gradients in the range dex kpc-1 for relatively small distances from the Galactic plane, i.e., kpc (Trefzger et al. 1995; Karaali et al. 2003; Du et al. 2004; Ak et al. 2007), which support the picture of a dissipative collapse of the thin disc. For intermediate -distances, where the thick disc is dominant, the vertical metallicity gradient is low, dex kpc-1, and the radial gradient is only marginal, dex kpc-1 (Rong, Buser & Karaali 2001). We quote also the works of Chiba & Beers 2000 and Girard et al. 1996 where vertical rotational velocity gradients were cited. In the first work, the authors give km s-1 kpc-1 for the halo stars whereas in the second work km s-1 kpc-1, for the stars dominated by the thick disc red giants. One must keep in mind that the samples assumed for a specific population, such as thin and thick discs or halo, may be contaminated by other objects. The work of Gilmore, Wyse, & Norris 2002 where higher mean rotational velocities than expected were predicted is a good example. Contrary to the expectations of the authors, the data of stars a few kpc from the Galactic plane which were assumed as candidates of the thick disc showed the mean rotation velocity km s-1 instead of the km s-1 one. The origin of most of the stars in the sample was a disrupted satellite. Another important point in treating the metallicity or velocity gradient of a specific population is the effect of the metal-week component of the thick disc. If the separation of stars into different populations would be based mainly on their metallicities, the metal-week tail of the thick disc may cause some complications.
In our recent papers, Galactic model parameters for 36 high-latitude fields have been estimated using photometric data from the Two Micron Sky Survey (2MASS) and from the Sloan Digital Sky Survey (SDSS). For the thin and the thick discs, useful data have been available in both photometric surveys (Cabrera-Lavers et al. 2007; Bilir et al. 2007); however, for the halo only SDSS data could be used (Bilir et al. 2007). We determined the variations of both the thick-disc scaleheight and the axial ratio of the halo as functions of Galactic longitude, and we noticed that it is most likely this variation which gives rise to the rather widely differing numerical values obtained for these parameters by different researchers.
Our work was based on de-reddened apparent , , , , magnitudes, estimated absolute magnitudes, and distances for 2 164 680 stars in a total area of 831 deg2. In the present paper, we shall derive metal abundances for a subsample of these stars and combine them with the distances already estimated in our previous paper, in order to investigate the large-scale metallicity distribution, including vertical and radial metallicity gradients, and their possible dependence(s) on Galactic longitude.
Ak et al. 2007 showed that in the anti-centre direction, the metallicity gradients corresponding to the transition region from the thick disc to the halo ( kpc) are significantly different at the two different Galactic latitudes and , respectively. In the present study, the variation of metal-abundances and metallicity gradients with Galactic longitude, a trace of the triaxiality of the halo will emerge as a particularly interesting result.
A brief description of the SDSS data and their reductions is given in Section 2. In section 3 we present the metallicity calibration for 36 fields and the longitude variation of the Galactic metal abundance distribution, including the vertical and radial metallicity gradients. These results are discussed in the final Section 4.
2 SDSS
The SDSS is a large, international collaboration project set up to survey 10 000 square–degrees of sky in five optical passbands and to obtain spectra of one million galaxies, 100 000 quasars, and tens of thousands of Galactic stars. The data are being taken with a dedicated 2.5-m telescope located at Apache Point Observatory (APO), New Mexico. The telescope has two instruments: a CCD camera with 30 20482048 CCDs in the focal plane and two 320 fiber double spectrographs. The imaging data are tied to a network of brighter astrometric standards (which would be saturated in the main imaging data) through a set of 22 smaller CCDs in the focal plane of the imaging camera. An 0.5-m telescope at APO has been used to tie the imaging data to brighter photometric standards.
The SDSS obtains images almost simultaneously in five broad bands (, , , and )11 1 Magnitudes in this paper are quoted in the system to differentiate them from the former system. centered at 3551, 4686, 6166, 7480 and 8932 , respectively (Fukugita et al. 1996). The imaging data are automatically processed through a series of software pipelines which find and measure objects and provide photometric and astrometric calibrations to produce a catalogue of objects with calibrated magnitudes, positions and structure information. The photometric pipeline (Lupton et al. 2001) detects the objects, matches the data from the five filters, and measures instrumental fluxes, positions, and shape parameters (which allows the classification of objects as “point source”, -compatible with the point spread function-, or “extended”). The photometric calibration is accurate to roughly 2 per cent rms in the , and bands, and 3 per cent in and , as determined by the constancy of stellar population colours (Ivezic et al. 2004; Blanton et al. 2005), while the astrometric calibration precision is better than 0.1 arcsec rms per coordinate (Pier et al. 2003). The Data Release 5 (DR5) imaging catalogue covers 8000 deg2 (Adelman-McCarthy et al. 2007) with a detection repeatability complete at a 95 per cent level for point sources brighter than the limiting apparent magnitudes of 22.0, 22.2, 22.2, 21.3 and 20.5 for , , , and , respectively. The data are saturated at about 14 mag in , and and about 12 mag in and .
2.1 Data and reductions
The data used in this work were taken from the SDSS (DR5) WEB server22 2 http://www.sdss.org/dr5/access/index.html for 36 high-latitude fields () covering different Galactic longitude intervals throughout the full circle (). From the 2 164 680 stars with SDSS magnitudes , , , , and used in our previous paper (Bilir et al. 2007), we identified G-type stars by transformation of the Neil Reid’s WEB page 33 3 http://www-int.stsci.edu/inr/intrins.html and colours for the G spectral type dwarfs to the and colours for this work. The absolute magnitude range of these stars, 258 268 in number in a total area of 831 deg2, is . The range of apparent magnitudes is , as in our paper just cited. While the de-reddening of the apparent magnitudes, the determination of absolute magnitudes and the estimation of the distances relative to the Sun as well as the –distances from the Galactic plane are explained in Bilir et al. 2007, derivation of the metal–abundances is described in the following Section 3.
3 Metallicity
The metallicities of the sample stars were evaluated using the following equation of Karaali, Bilir & Tunçel 2005:
| (1) |
This equation was calibrated for the main sequence stars with which covers the colour indices of our sample. Here, is the normalized UV-excess in SDSS photometry corresponding to in the UBV photometry. Karaali, Bilir & Tunçel 2005 give the range of the metallicity as dex, corresponding to . Limitations of the photometric technique are unavoidable, especially for the metallicities of faint star. However, the thick disc stars occupy the intermediate apparent magnitude interval, i.e. , (Chen et al. 2001) where the mean error for is less than 0.1 dex (Fig. 1). We emphasize that the parameters based on the determination of the metallicity are limited by the accuracy of metallicities estimates based on photometry alone, and that they should be supplemented with investigations of the soon to emerge spectroscopic determinations of parameters for the SDSS samples.

The parameter range covers the metallicity interval dex.
The metallicity distribution for each field is given by a mean metal-abundance value determined for each of the following distance intervals (in kpc): (1.5,2], (2,2.5], (2.5,3], (3,4], (4,5], (5,6], (6,7], (7,8], (8,9], (9,12], (12,15]. These intervals and the corresponding centroid distances () are the same as in Ak et al. 2007; however, the projection of onto the vertical direction, i.e. , is different due to the higher Galactic latitudes studied in this work.
Results are presented in Table 1. Notice that the metallicity distributions in the distance intervals , , , and kpc are rather flat. Hence, median values could be used in doing the statistics for these intervals, whereas modal means were preferred for the other distance intervals which showed a peak.
| 1.07 | 1.58 | 2.02 | 2.46 | 3.17 | 4.04 | 4.92 | 5.80 | 6.68 | 7.56 | 9.50 | |
|---|---|---|---|---|---|---|---|---|---|---|---|
| 0 | -0.38(09) | -0.57(06) | -0.68(06) | -0.57(06) | -1.21(08) | -1.61(11) | -1.70(11) | -1.78(11) | -2.11(09) | -2.33(12) | -2.28(07) |
| 10 | -0.22(13) | -0.50(09) | -0.65(06) | -0.78(08) | -1.14(08) | -1.60(11) | -1.80(11) | -1.75(11) | -2.29(12) | -2.36(08) | -2.31(09) |
| 20 | -0.53(04) | -0.63(07) | -0.63(06) | -0.73(04) | -1.22(07) | -1.64(11) | -1.79(11) | -1.82(11) | -2.19(11) | -2.25(14) | -2.41(10) |
| 30 | -0.50(07) | -0.66(05) | -0.79(04) | -0.90(06) | -1.24(07) | -1.61(11) | -1.85(11) | -1.85(15) | -2.18(11) | -2.16(17) | -2.34(08) |
| 40 | -0.55(04) | -0.60(04) | -0.73(04) | -0.75(07) | -1.19(08) | -1.58(11) | -1.85(11) | -1.93(11) | -2.28(05) | -2.38(22) | -2.27(08) |
| 50 | -0.50(05) | -0.67(05) | -0.82(07) | -0.85(07) | -1.35(08) | -1.70(11) | -2.00(11) | -2.07(11) | -2.35(02) | -2.36(11) | -2.43(13) |
| 60 | -0.50(05) | -0.69(04) | -0.72(05) | -0.82(06) | -1.18(11) | -1.68(11) | -1.89(11) | -2.07(15) | -2.28(10) | -2.28(14) | -2.29(11) |
| 70 | -0.50(04) | -0.58(04) | -0.65(05) | -0.76(06) | -1.22(11) | -1.66(11) | -1.87(15) | -1.97(15) | -2.35(10) | -2.29(10) | -2.38(09) |
| 80 | -0.47(08) | -0.62(03) | -0.62(06) | -0.78(20) | -1.29(11) | -1.67(15) | -1.85(15) | -1.93(15) | -2.35(06) | -2.47(11) | -2.31(13) |
| 90 | -0.58(05) | -0.66(04) | -0.88(04) | -0.82(09) | -1.24(11) | -1.57(15) | -1.92(19) | -1.94(19) | -2.27(06) | -2.32(07) | -2.25(11) |
| 100 | -0.55(04) | -0.60(07) | -0.74(09) | -0.95(11) | -1.25(11) | -1.67(15) | -1.88(15) | -2.03(19) | -2.26(05) | -2.38(13) | -2.27(11) |
| 110 | -0.54(06) | -0.60(04) | -0.78(05) | -0.86(13) | -1.16(11) | -1.64(15) | -1.99(19) | -2.03(19) | -2.40(12) | -2.46(17) | -2.22(12) |
| 120 | -0.29(12) | -0.43(13) | -0.71(11) | -0.96(07) | -1.20(15) | -1.50(15) | -1.78(19) | -1.98(19) | -2.37(21) | -2.29(12) | -2.08(10) |
| 130 | -0.45(08) | -0.47(09) | -0.40(13) | -0.71(15) | -1.18(15) | -1.62(19) | -1.89(19) | -1.90(23) | -2.40(30) | -2.26(10) | -2.24(13) |
| 140 | -0.42(09) | -0.70(05) | -0.73(08) | -1.09(14) | -1.23(15) | -1.73(19) | -1.89(19) | -1.95(19) | -2.45(10) | -2.39(20) | -2.30(14) |
| 150 | -0.50(08) | -0.55(06) | -0.74(06) | -0.76(07) | -1.30(15) | -1.73(19) | -1.94(19) | -2.03(19) | -2.48(13) | -2.25(08) | -2.31(17) |
| 160 | -0.32(10) | -0.51(04) | -0.38(09) | -0.50(10) | -1.22(15) | -1.59(19) | -1.93(19) | -1.92(19) | -2.30(15) | -2.42(07) | -2.43(39) |
| 170 | -0.47(06) | -0.60(04) | -0.72(07) | -0.74(13) | -1.16(15) | -1.73(19) | -1.95(19) | -1.99(19) | -2.33(15) | -2.20(27) | -2.34(12) |
| 180 | -0.44(08) | -0.57(06) | -0.73(13) | -0.69(08) | -1.22(15) | -1.71(15) | -1.96(19) | -1.99(19) | -2.38(03) | -2.34(13) | -2.28(06) |
| 190 | -0.36(07) | -0.46(09) | -0.56(10) | -0.96(05) | -1.13(15) | -1.61(19) | -1.84(19) | -1.88(19) | -2.47(08) | -2.42(11) | -2.30(11) |
| 200 | -0.30(13) | -0.45(07) | -0.52(06) | -0.77(04) | -1.20(15) | -1.64(15) | -1.91(19) | -2.02(19) | -2.24(09) | -2.42(05) | -2.32(11) |
| 210 | -0.41(07) | -0.64(08) | -0.61(07) | -0.61(10) | -1.22(15) | -1.74(15) | -1.94(15) | -1.96(19) | -2.23(10) | -2.32(12) | -2.37(07) |
| 220 | -0.44(06) | -0.66(06) | -0.64(04) | -0.74(12) | -1.19(15) | -1.62(15) | -1.89(15) | -1.85(15) | -2.57(47) | -2.32(11) | -2.33(09) |
| 230 | -0.32(14) | -0.62(04) | -0.54(06) | -0.59(16) | -1.12(11) | -1.53(15) | -1.87(19) | -1.82(19) | -2.34(18) | -2.34(20) | -2.36(18) |
| 240 | -0.50(07) | -0.54(05) | -0.68(08) | -0.64(06) | -1.18(11) | -1.55(15) | -1.86(15) | -1.84(19) | -2.34(09) | -2.30(09) | -2.39(16) |
| 250 | -0.52(07) | -0.67(03) | -0.74(04) | -0.69(21) | -1.32(11) | -1.74(15) | -1.97(15) | -1.98(19) | -2.31(05) | -2.37(07) | -2.26(09) |
| 260 | -0.49(05) | -0.69(06) | -0.75(05) | -0.86(12) | -1.16(11) | -1.69(15) | -1.95(15) | -1.78(19) | -2.36(14) | -2.15(13) | -2.34(09) |
| 270 | -0.47(05) | -0.55(09) | -0.61(05) | -0.78(08) | -1.18(11) | -1.44(11) | -1.87(15) | -2.11(15) | -2.45(10) | -2.43(09) | -2.28(10) |
| 280 | -0.43(04) | -0.63(04) | -0.73(08) | -0.65(08) | -1.26(11) | -1.62(11) | -1.86(11) | -1.95(15) | -2.19(06) | -2.36(12) | -2.37(12) |
| 290 | -0.42(04) | -0.66(04) | -0.72(05) | -0.81(07) | -1.11(11) | -1.70(11) | -1.81(15) | -1.98(15) | -2.44(15) | -2.28(05) | -2.42(11) |
| 300 | -0.51(03) | -0.58(06) | -0.73(09) | -0.92(14) | -1.20(08) | -1.58(11) | -1.84(11) | -2.05(11) | -2.32(03) | -2.69(51) | -2.32(06) |
| 310 | -0.35(06) | -0.63(04) | -0.68(04) | -0.85(05) | -1.23(08) | -1.53(11) | -1.80(11) | -1.91(15) | -2.36(16) | -2.32(11) | -2.37(13) |
| 320 | -0.45(06) | -0.64(04) | -0.74(06) | -0.82(12) | -1.23(08) | -1.52(11) | -1.75(11) | -1.87(11) | -2.35(08) | -2.43(07) | -2.28(08) |
| 330 | -0.40(05) | -0.57(06) | -0.68(06) | -0.78(05) | -1.16(07) | -1.54(11) | -1.62(11) | -1.68(11) | -2.46(10) | -2.42(05) | -2.43(18) |
| 340 | -0.25(11) | -0.58(06) | -0.67(05) | -0.74(06) | -1.19(07) | -1.51(11) | -1.77(11) | -1.77(11) | -2.45(15) | -2.43(08) | -2.25(10) |
| 350 | -0.50(04) | -0.62(04) | -0.65(05) | -0.73(06) | -1.28(07) | -1.63(11) | -1.80(11) | -1.88(11) | -2.50(10) | -2.27(27) | -2.20(10) |
3.1 Metallicity variation with Galactic longitude
The metallicity distributions for both (relatively) short and large distances show systematic fluctuations. For example, the distribution for kpc and the combined distribution for kpc have maxima at intermediate longitudes, while minima exist at small and large longitudes (Fig. 2). These distances correspond to the region where the discs – both the thin and thick discs – dominate the stellar distributions of the Galaxy. If compared to the typical error bars, the amplitude of the fluctuation is significant but only moderate, i.e. dex. However, if it is real, this feature should be related with the structure of the Galactic disc, probably with its warp and flare (see Section 4). For completeness, the longitude variation of Fig. 2 has been fitted by the following equation (solid curve):
| (2) |

The metallicity distribution for the large distances is even more interesting. Combining the distributions for kpc reveals a clear longitudinal metallicity distribution (Fig. 3). The metal abundance decreases monotonically from -2.28 to -2.38 dex when one goes from the Galactic longitude 10∘ to 340∘. However, this metallicity distribution can also be considered flat within the errors. The interesting is that the cited longitudes, 10∘ and 340∘, are close to the direction of the Galactic centre, where one expects the same metallicity. The distance interval kpc covers the halo component. Hence, this unexpected finding should be explained by the structure of the halo. The equation fitted to the metallicity distribution as follows:
| (3) |

3.2 Vertical and radial metallicity gradients
Figure 4 displays the histograms of the metallicities given in Table 1 for the 36 fields in each of 11 distance intervals covering the range kpc. Each histogram has been fitted by a Gaussian curve with modal mean adopted as equal to the mean metallicity of 36 fields at the corresponding distance from the Galactic plane (Table 2). As expected, the mean metallicities decrease with increasing distances, indicating a probable vertical metallicity gradient. We plotted the same data in Fig. 5 for investigating this process in detail. One can see three different trends in the figure: 1) for relatively short distances, i.e. kpc, the variation of is rather smooth, 2) for intermediate distances, i.e. kpc, the variation is steeper but still smooth, and finally 3) for kpc, the variation is flat, but fluctuations and error bars are larger. The metallicity gradient describing the first trend, dex kpc-1, is in agreement with the canonical metallicity gradients for the same distances, and is the likely signature of this Galactic region’s formation by a dissipative collapse. The description of the second trend in terms of a metallicity gradient, dex kpc-1, corresponds to the average metallicity difference between the two population components involved. Finally, the third trend, dex kpc-1, is the low metallicity gradient of the inner spheroid.


| (kpc) | (kpc) | (kpc) | (dex) |
|---|---|---|---|
| 0.5-1.5 | 1.20 | 1.07 | -0.46(07) |
| 1.5-2.0 | 1.78 | 1.58 | -0.63(06) |
| 2.0–2.5 | 2.28 | 2.02 | -0.70(07) |
| 2.5–3.0 | 2.77 | 2.46 | -0.77(09) |
| 3.0–4.0 | 3.57 | 3.17 | -1.20(10) |
| 4.0–5.0 | 4.56 | 4.04 | -1.63(13) |
| 5.0–6.0 | 5.54 | 4.92 | -1.87(14) |
| 6.0–7.0 | 6.54 | 5.80 | -1.93(15) |
| 7.0–8.0 | 7.53 | 6.68 | -2.34(12) |
| 8.0–9.0 | 8.53 | 7.56 | -2.35(13) |
| 9.0-12.0 | 10.71 | 9.50 | -2.32(12) |
We investigated the radial metallicity gradient for 36 fields as follows. It will be seen immediately that the radial metallicity gradient described and used in this work is different from the usual definition: although we defined metallicities for 36 fields for a specific distance from the Galactic plane, the distances of the centers of these fields to the Galactic centre are, of course, different due to their different Galactic longitudes, . The range of radial distances thus defined is kpc. Metallicities for 36 fields in Table 1 as functions of radial distance are given in 11 panels in Fig. 6. From the definition, short radial distances correspond to fields in the general direction toward the centre of the Galaxy, whereas fields in the general direction toward the anti-centre have larger radial distances.
Different trends can be observed in different panels. The most conspicuous features in panel (a) are the following: the fields in both the centre and anti-centre directions are relatively richer in metallicity than the fields in other directions, and their corresponding error bars are larger; furthermore, the metallicity differences between the centre and anti-centre fields follow an axisymmetric pattern.
The relative metal overabundances in the anti-centre fields (i.e., for large radial distances) are even larger in panels (b) and (c). The metallicity variations in panels (d) and (e) are almost zero, and finally, the metallicity trend changes sign for higher distances, i.e., kpc (panels f-i). In short: fields in the centre direction of the Galaxy appear to be overabundant in metallicities relative to the other fields. Although this metallicity excess is relatively low, dex, it appears to be real because the present statistical analysis shows the metallicity trend behind it to be significant.
For completeness, we should also mention that the last two panels, and kpc, show zero variation in metallicity.
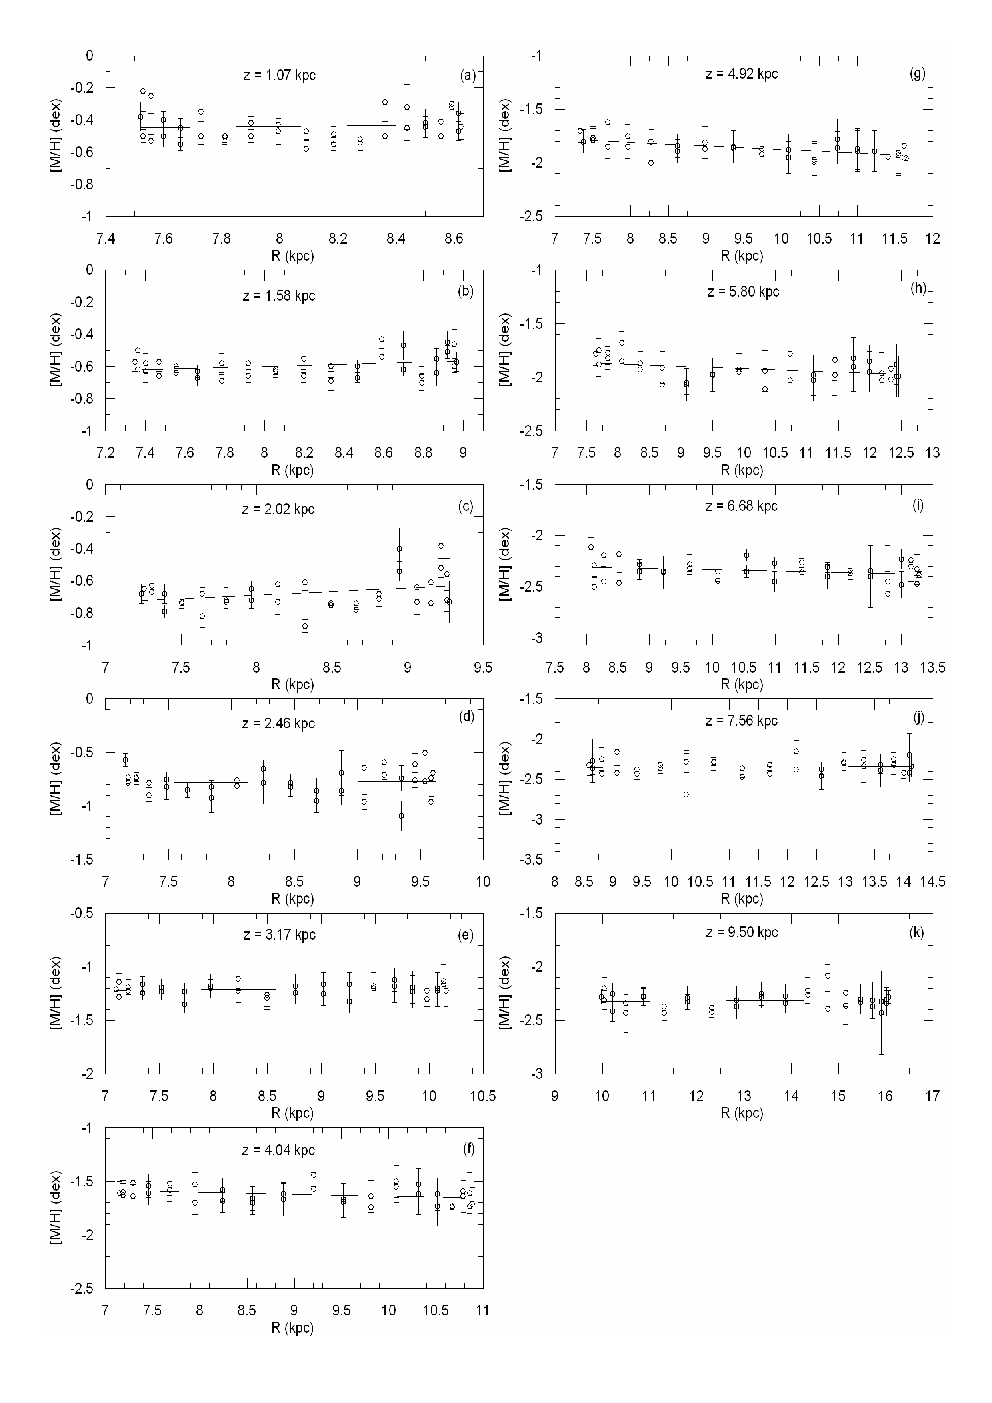
We fitted linear equations (solid lines) to the metallicity distributions in Fig. 6, and we plotted their slopes versus distances in Fig. 7. Clearly, the metallicity variation exhibits different trends at different distances from the Galactic plane. The minimum at kpc is the most conspicuous feature in this diagram, meaning that the slope of the radial metallicity gradient is significantly different at shorter and larger distances. It thus seems that the Galactic components (thin and thick discs, and halo) do not have homogeneous structures.

4 Summary and Conlusion
We evaluated metallicities for 36 high latitude () fields with Galactic longitudes , and we investigated their variations with different parameters.
The metallicities are longitude dependent. For relatively short distances from the Galactic plane, kpc, one can observe two minima at small and large Galactic longitudes ( and ), respectively, and a maximum at (Fig. 2). For large distances, kpc (Fig. 3), metallicity decreases monotonically with Galactic longitude.
The metallicities of 36 fields were plotted as histograms, which were fitted by Gaussians giving a mean metallicity for each of 11 distinctive (representative) values of distance in the range kpc. The resulting mean metallicity as a function of reveals a trimodal behavior: (1) for kpc, there is a metallicity gradient of dex kpc-1 which is in agreement with the dissipational collapse picture of formation of the Galactic thin-disc component at relatively short distances; (2) a steeper gradient, dex kpc-1, covering the distance interval kpc which, although dominated by the thick disc, probably accentuates the metallicity differences between the coexisting thin and thick discs and the halo, rather than it provides a pure fossil record of thick-disc formation; (3) the gradient dex kpc-1, for kpc, is a typical value for the inner spheroidal component.
These results, including the metallicity gradient dex kpc-1 for kpc, are all in fine agreement with the canonical literature (Trefzger et al. 1995; Rong, Buser & Karaali 2001; Karaali et al. 2003; Du et al. 2004; Ak et al. 2007). By virtue of their systematic coverage of Galactic longitudes, they provide an important enhancement of our reconnaissance of Galactic structure which will be needed for an improved understanding of the formation of the Milky Way Galaxy.
Conversion of vertical () distances to radial () distances also allowed a study of the metallicity variations as functions of over a range of almost 10 kpc. Again, clear (linear) systematic trends with different slopes can be identified behind the observed metallicity fluctuations, confirming results obtained by Allende Prieto et al. 2006 from DR3 data for 22 700 F- and G-type stars. In particular, although these authors investigate a larger range in , the metallicity structures that they find for the thick disc and the halo (their figures 13) are almost the same as those presented here for and kpc.
Our results are reminiscent of the flare effect of the disc. According to López-Corredoira et al. 2002, a flare occuring in the outer disc produces an increase in the scaleheight as one moves radially outward. From their results we infer that the scaleheight of the thin disc sources is as large as 0.6 kpc for kpc, so it is plausible that a mixture of sources from the thin and thick discs are found in the outer disc at the lowest height regimes plotted in Fig. 6 (panels a and b), producing higher metallicities than the expected from the contribution of the thick disc component alone.
The longitudinal dependence of the metallicity can be then explained by this process, since different longitudes correspond to different radial distances for a specific distance from the Galactic centre. The anticentre direction corresponds to the larger distances from the Galactic centre, thus is in this longitude range where the higher metallicities must be obtained due to the effect of the flare, as it is shown in Fig. 2. Also the longitudes where either the maximum or the minimum of the metallicity distribution are observed coincide with the directions of maximum warp amplitude in the Galactic thin disc (López-Corredoira et al. 2002). As this warp bends above and below the thin disc from its mean location, again mixing of stellar population from the thin and thick discs is expected at these longitudes: hence, observations of a variation in the mean metallicity are not surprising. Finally, even minor metallicity differences between fields at longitudes and (both in the Galactic centre direction), they may result from a triaxial structure of the halo – or in other words: from the fact that the plane and the meridian of the disc are different from those of the halo.
5 Acknowledgments
This work was supported by the Research Fund of the University of Istanbul. Project number: BYPF-1 12/31012007.
References
- Adelman-McCarthy et al. (2007) Adelman-McCarthy, J. K. et al., 2007. ApJ (submitted)
- Ak et al. (2007) Ak, S., Bilir, S., Karaali, S., Buser, R., 2007. AN 328, 169
- Allende Prieto et al. (2006) Allende Prieto, C., Beers, T. C., Wilhelm, R., Newberg, H. J., Rockosi, C. M., Yanny, B., Lee, Y. S., 2006. ApJ 636, 804
- Beers & Sommer-Larsen (1995) Beers, T.C., Sommer-Larsen, J., 1995. ApJS 96, 175
- Bilir et al. (2007) Bilir, S., Cabrera-Lavers, A., Karaali, S., Ak, S., Yaz, E., López-Corredoira, M., 2007. A&A (submitted)
- Blanton et al. (2005) Blanton, M. R. et al. 2005. AJ 129, 2562
- Cabrera-Lavers et al. (2007) Cabrera-Lavers, A., Bilir, S., Ak, S., Yaz, E., Lopez-Corredoira, M., 2007. A&A 464, 565
- Carney, Latham & Laird (1990) Carney, B. W., Latham, D. W., Laird, J. B., 1990. AJ 99, 572
- Chen et al. (2001) Chen B., et al. (the SDSS Collaboration), 2001. ApJ 553, 184
- Chiba & Beers (2000) Chiba, M., Beers, T. C., 2000. AJ 119, 2843
- Du et al. (2004) Du, C., Zhou, X., Ma, J., Shi, J., Chen, A.B., Jiang, Z., Chen, J., 2004. AJ 128, 2265
- Eggen, Lynden-Bell & Sandage (1962) Eggen, O. J., Lynden-Bell, D., Sandage A.R., 1962. ApJ 136, 748
- Freeman & Bland-Hawthorn (2002) Freeman, K., Bland-Hawthorn, J., 2002. ARA&A 40, 487
- Fukugita et al. (1996) Fukugita, M., Ichikawa, T., Gunn, J. E., Doi M., Shimasaku, K., Schneider D. P., 1996. AJ 111, 1748
- Gilmore, Wyse, & Norris (2002) Gilmore, G., Wyse, R. F. G., Norris, J. E., 2002. ApJ 574L, 39
- Girard et al. (1996) Girard, T. M., Korchagin, V. I., Casetti-Dinescu, D. I., van Altena, W. F., López, C. E., Monet, D. G., 2006. AJ 132, 1768
- Ivezic et al. (2004) Ivezic, Z., Lupton, R. H., Schlegel, D., Boroski, B., et al., 2004. AN 325, 583
- Karaali et al. (2003) Karaali, S., Ak, S. G., Bilir, S., Karataş, Y., Gilmore, G., 2003. MNRAS 343, 1013
- Karaali, Bilir & Tunçel (2005) Karaali, S., Bilir, S., Tunçel, S., 2005. PASA 22, 24
- López-Corredoira et al. (2002) López-Corredoira, M., Cabrera-Lavers, A., Garzón, F., Hammersley, P. L., 2002. A&A 394, 883
- Lupton et al. (2001) Lupton, R.H., Gunn, J.E., Ivezic, Z., Knapp, G.R., Kent, S., Yasuda, N., 2001. in ASP Conf. Ser.: Astronomical Data Analysis Software and Systems X, ed. F. R. Harden Jr., F. A. Primini and H. E. Payne, 238, 269
- Norris, Bessell & Pickles (1985) Norris, J. E., Bessell, M. S., Pickles, A. J., 1985. ApJS 58, 463
- Norris (1986) Norris, J. E., 1986. ApJS 61, 667
- Norris & Ryan (1991) Norris, J. E., Ryan, S. G., 1991. ApJ 380, 403
- Pier et al. (2003) Pier, J.R., Munn, J.A., Hindsley, R.B., Hennessy, G.S., Kent, S.M., Lupton, R.H., Ivezic, Z., 2003. AJ 125, 1559
- Rong, Buser & Karaali (2001) Rong, J., Buser, R., Karaali, S., 2001. A&A 365, 431
- Sandage & Fouts (1987) Sandage, A., Fouts, G., 1987. AJ 93, 74
- Searle & Zinn (1978) Searle, L., Zinn, R., 1978. ApJ 225, 357
- Trefzger et al. (1995) Trefzger, Ch.F., Pel, J.W., Gabi, S., 1995. A&A 304, 381
- Yoshii & Saio (1979) Yoshii, Y., Saio, H., 1979. PASJ 31, 339