Wide-bandwidth, tunable, multiple-pulse-width optical delays using slow light in cesium vapor
Abstract
We demonstrate an all-optical delay line in hot cesium vapor that tunably delays 275 ps input pulses up to 6.8 ns and 740 input ps pulses up to 59 ns (group index of approximately 200) with little pulse distortion. The delay is made tunable with a fast reconfiguration time (100’s of ns) by optically pumping out of the atomic ground states.
There is considerable practical interest in developing all-optical delay lines that can tunably delay short pulses by much longer than the pulse duration. Slow light (i.e. the passage of light pulses through media with a small group velocity) has long been considered a possible mechanism for constructing such a delay line. Most commonly, the steep linear dispersion associated with a single gain or transparency resonance provides the group delay. Most early work used the dispersion associated with electromagnetically induced transparency kasapi95; kash99; Budker99; hau99; phillips01; liu01; turukhin02, but recently other resonances have been explored, including coherent population oscillations bigelow03; Zhao05; palinginis05, stimulated Brillouin scattering song05a; Okawachi05; gonzalez-herraez05; gonzalez-herraez06, stimulated Raman scattering sharping05; dahan05, and spectral hole-burning camacho06_2.
In addition to single-resonance systems, double gain resonances have been used for pulse advancement chiao93; wang00; dogariu01; stenner03; macke03; agarwal04 and delay stenner05. Widely spaced gain peaks create a region of anomalous dispersion, resulting in pulse advancement. When the spacing between the gain peaks is small, a region of normal dispersion is created, resulting in pulse delay. Pulse advancement is also possible by the proper spacing of two absorbing resonances macke03. The possibility of pulse delay between two absorbing resonances has also received some attention grischkowsky73; tanaka03; macke06; camacho06; zhu06; camacho07_1.
Ideally, an optical delay line would delay high bandwidth pulses by many pulse lengths in a short propagation distance without introducing appreciable pulse distortion and be able to tune the delay continuously with a fast reconfiguration rate. Minimal pulse absorption is also desirable, but not necessary because absorption can be compensated through amplification. Relatively few experiments kasapi95; hau99; turukhin02; song05a; camacho06; camacho06_2 have directly measured pulse delays longer than the incident pulse duration, and of these, none has used pulses shorter than 2 ns or reported reconfiguration rates approaching the inverse pulse delay time.
In this Letter, we demonstrate the tunable delay of a 1.6-GHz-bandwidth pulse by up to 25 pulse widths and the tunable delay of a 600-MHz-bandwidth pulse by up to 80 pulse widths by making use of a double absorption resonance in cesium. Furthermore, we show that the delay can be tuned with a reconfiguration time of 100’s of nanoseconds.
In a medium with two Lorentzian absorption resonances, as illustrated in Figure 1, the complex index of refraction can be approximated as
| (1) |
where is the homogeneous linewidth (full width at half maximum, FWHM), and account for the possibility of different strengths for the two resonances, is the detuning from peak transmission, , () is the resonance frequency for transition 1 (transition 2), , , and
| (2) |
For example, alkali atoms have two hyperfine levels associated with their electronic ground state, leading to two closely spaced absorption resonances. We note that any other system with two similar absorbing resonances may also be used (e.g. quantum dots, microresonators, photonic crystals, etc). For a vapor of alkali atoms, the detunings satisfy , and the strength of the resonance is given in SI units by , where is the effective far-detuned dipole moment steck03, and and are proportional to the degeneracies of the hyperfine levels.
Eq. (1) is also applicable for inhomogeneously broadened lines, such as Doppler broadened atomic vapors, if the detunings and are greater than the inhomogeneous linewidth by an order of magnitude or more. This result holds because the homogenous Lorentzian lineshape has long wings while the inhomogeneous lineshape decreases exponentially.
By expanding Eq. (1) about the point , we find that the real part and imaginary part of the index of refraction are given by
| (3a) | |||||
| (3b) | |||||
where
| (4) |
and where we have assumed that in keeping only the first few terms in the expansion. Note that for the special case in which the two resonances are of equal strength (i.e. ), the coefficients are given by for odd and for even. For cesium, which has and , the error introduced by assuming is approximately 0.5%. For this reason, we make the simplifying assumption throughout the remainder of the paper.
Pulse propagation can be described in terms of various orders of dispersion, which can be determined through use of Eq. (3a) as
| (5) |
Thus the group velocity is given by , and the group-velocity dispersion (GVD) and third-order-dispersion are given respectively by and . The absence of second-order (first-order) frequency dependence in Eq. (3a) (Eq. (3b)) means that near the GVD (absorption) is minimized regardless of possible differences between and . Thus, between two absorption resonances, which can be described by Eq. (1), the maximum transparency is accompanied by a minimum in GVD.

We next develop a simple model to provide an understanding of the role of dispersion and absorption on pulse broadening. We provisionally define the pulse width as the square root of the variance of the temporal pulse shape. For an unchirped Gaussian pulse, i.e. , the pulse width defined in this way is simply . The pulse width after propagating through a distance of dispersive medium is then given to third-order in by agrawal95
| (6) |
where is the initial pulse width. In the case of cesium, where rad/s and rad/s, can be neglected and Eq. (6) simplifies to
| (7) |
where has been calculated using Eqs. (5) and (3) and where is the pulse delay and is the optical depth at the pulse carrier frequency . We further note that the change in pulse width due to absorption only can be approximated as boyd05; camacho06
| (8) |
so long as .
The fractional broadening due to dispersion, defined as , scales as , while the broadening due to absorption scales as . In the present study, s, rad/s, s, and rad/s, indicating that dispersion is the dominant form of broadening by about three orders of magnitude, and the absorptive contribution to broadening can be ignored.
Experimentally it is much easier to quantify pulse widths in terms of their FWHM rather than in terms of their variance as we have done in Eqs. (6) - (8). In the remainder of this Letter, we will quote pulse widths in terms of their FWHM.
Our experimental setup is shown in Fig. 2. The signal laser is a CW diode laser with a wavelength of 852 nm. The signal frequency is tuned to obtain maximum transmission between the two Cs D2 hyperfine resonances and is pulsed at a pulse repetition frequency of 100 kHz using a fast electro-optic modulator (EOM). The signal beam is collimated to a diameter of 3 mm, and two different pulse widths are used, 275 ps or 740 ps FWHM, with a peak intensity of less than 10 mW/cm2. The pulses then pass through a heated 10-cm-long glass cell containing atomic cesium vapor. The 275 ps pulses are measured using a 7.5 GHz silicon photodiode, and the 740 ps pulses are measured with a 1 GHz avalanche photodiode. All electrical signals are recorded with a 30 GHz sampling oscilloscope triggered by the pulse generator. The pump beams are turned off except for the experiments reported in Figs. 5 and 6.

Figure 1(a) shows the transmission of a CW optical beam as a function of frequency near the two cesium hyperfine resonances, overlayed with the spectrum of a 275 ps Gaussian pulse. The data points are measured values and the solid line fits these points to the imaginary part of Eq. (1). The entire pulse spectrum lies well within the relatively flat transmission window between the resonances, resulting in little pulse distortion from absorption. Figure 1(b) shows the index of refraction (real part of Eq. (1)) and frequency-dependent group velocity associated with the absorption shown in Fig. 1(a). We note that, in the region of the pulse spectrum, the curvature of the frequency-dependent group velocity is greater than that of the absorption, suggesting that dispersion is the dominant form of pulse distortion. This is not the case for single-Lorentzian systems, where the spectral variation of absorption is the dominant form of distortion boyd02. While most slow light experiments have worked by making highly dispersive regions transparent, we have worked where a highly transparent region is dispersive.

As shown above, the delay of a pulse is proportional to the optical depth of the vapor. Figure 3 shows that we can control the delay by changing the temperature (and thus optical depth) of the Cs cell. Using a 10 cm cell, and varying the temperature between approximately 90 ∘C and 120 ∘C, we were able to tune the delay of a 275 ps pulse between 1.8 ns and 6.8 ns. The theory curves in Fig. 3 were obtained using where the electric field is given by
| (9) |
and where we have used Eq. (1) for the index of refraction. The atomic density has been chosen separately to fit each measured pulse. We note that a pulse may be delayed by many pulse widths relative to free-space propagation with little broadening.

Longer pulses lead to delay with reduced pulse broadening because pulse broadening is approximately proportional to (see Eq. (7)). To study the larger fractional delays enabled by this effect, we used longer 740 ps input pulses for which the dispersive broadening is significantly reduced. Figures 4(a) and 4(b) show the delay and broadening of a 740 ps pulse after passing through a sequence of three 10 cm cesium vapor cells. The plots correspond to a temperature range of approximately 110 ∘C to 160 ∘C. Even though the pulse experiences strong absorption at large delays, the fractional broadening of the pulse FWHM remains relatively low.
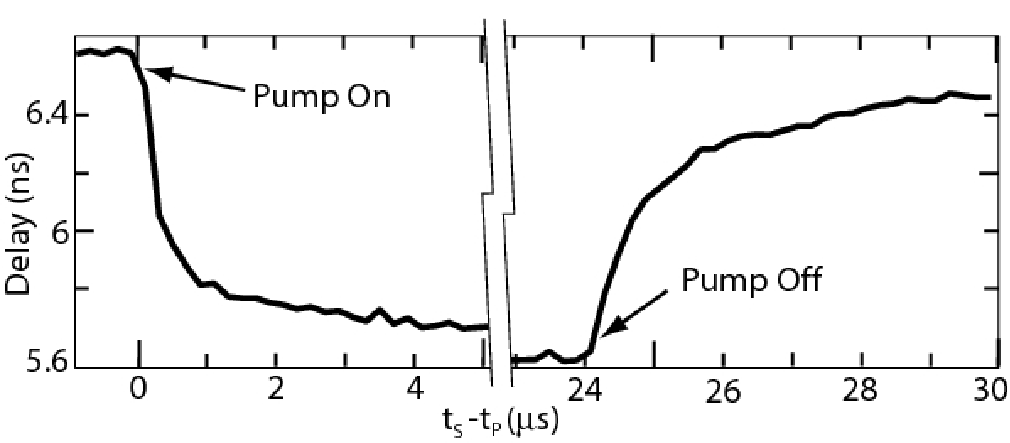
In addition to temperature tuning, the optical depth can be changed much more rapidly by optically pumping the atoms into the excited state using two pump lasers. As shown in Fig. 2 each pump laser is resonant with one of the transitions in order to saturate the atoms without optical pumping from one hyperfine level to the other. The power of each pump beam is approximately 30 mW, and both pump beams are focused at the cell center. The signal beam overlaps the pump beams and is also focused to a 100 m beam diameter. The pump beams are turned on and off using an 80 MHz AOM with a 100 ns rise/fall time. Being on resonance with the transitions, the pump fields experience significant absorption (), and are entirely absorbed despite having intensities well above the saturation intensity.
With the pump beams on, the decreases in effective ground-state atomic density leads to smaller delay. Figure 5 shows a delayed pulse waveform consisting of two 275 ps input pulses separated by 1 ns, with the pump on and off. We note that pump fields create no noticeable change in the waveform shape or amplitude. Also, we measured that the change in delay is essentially proportional to the pump power.
In Fig. 6 the measured signal delay is shown as a function of the difference between arrival time of the signal at the cell and the turn-on time of the pump. The rise and fall times lie in the range 300-600 ns and vary slightly depending on the relative detunings of the pumps.

In summary, we have observed large tunable fractional time delays of high-bandwidth pulses with fast reconfigurations rates and low distortion by tuning the laser frequency between the two ground-state hyperfine resonances of a hot atomic cesium vapor cell. We have shown that in such a medium dispersion is the dominant form of broadening, and we have characterized the delay, broadening, and reconfiguration rates of the delayed pulses.
This work was supported by the DARPA/DSO Slow Light program, the National Science Foundation, andthe Research Corporation.
References
- (1) A. Kasapi et al., Phys. Rev. Lett. 74, 2447 (1995).
- (2) M. M. Kash et al., Phys. Rev. Lett. 82, 5229 (1999).
- (3) D. Budker et al., Phys. Rev. Lett. 83, 1767 (1999).
- (4) L. V. Hau et al., Nature 397, 594 (1999).
- (5) D. F. Phillips et al., Phys. Rev. Lett. 86, 783 (2001).
- (6) C. Liu et al., Nature 409, 490 (2001).
- (7) A. Turukhin et al., Phys. Rev. Lett. 88, 023602 (2002).
- (8) M. S. Bigelow et al., Science 301, 200 (2003).
- (9) X. Zhao et al., Optics Express 93, 7899 (2005).
- (10) P. Palinginis et al., Optics Express 13, 9909 (2005).
- (11) K. Y. Song et al., Opt. Lett. 30, 1782 (2005).
- (12) Y. Okawachi et al., Phys. Rev. Lett. 94, 153902 (2005).
- (13) M. Gonzalez-Herraez et al., Appl. Phys. Lett. 87, 081113 (2005).
- (14) M. Gonzalez-Herraez et al., Optics Express 14, 1400 (2006).
- (15) J. E. Sharping et al., Optics Express 13, 6092 (2005).
- (16) D. Dahan et al., Optics Express 13, 6234 (2005).
- (17) R. M. Camacho et al., Phys. Rev. A 74, 033801 (2006).
- (18) R. Y. Chiao, Phys. Rev. A 48, R34 (1993).
- (19) L. J. Wang et al., Nature 406, 277 (2000).
- (20) A. Dogariu et al., Phys. Rev. A 63, 053806 (2001).
- (21) M. D. Stenner et al., Nature 425, 695 (2003).
- (22) B. Macke et al., Eur. Phys. J. D 23, 125 (2003).
- (23) G. S. Agarwal et al., Phys. Rev. A 70, 023802 (2004).
- (24) M. D. Stenner et al., Optics Express 13, 9995 (2005).
- (25) D. Grischkowsky, Phys. Rev. A 7, 2096 (1973).
- (26) H. Tanaka et al., Phys. Rev. A 68, 053801 (2003).
- (27) B. Macke et al., Phys. Rev. A 73, 043802 (2006).
- (28) R. M. Camacho et al., Phys. Rev. A 73, 063812 (2006).
- (29) Z. Zhu et al., Opt. Exp. 14, 7238 (2006).
- (30) R. M. Camacho et al., Physical Review Letters 98, 043902 (2007).
- (31) D. A. Steck. Cesium D line data, Technical Report No. LA-UR-03-7943, Los Alamos National Laboratory (2003), http://steck.us/alkalidata/.
- (32) G. P. Agrawal, Nonlinear Fiber Optics (Academic Press, 1995), p. 79.
- (33) R. W. Boyd et al., Phys. Rev. A 71, 023801 (2005).
- (34) R. W. Boyd et al., Progress in Optics (Elsevier, 2002), p. 497.