The bimodality of type Ia Supernovae
Abstract
We comment on the presence of a bimodality in the distribution of delay time between the formation of the progenitors and their explosion as type Ia SNe. Two ”flavors” of such bimodality are present in the literature: a weak bimodality, in which type Ia SNe must explode from both young and old progenitors, and a strong bimodality, in which about half of the systems explode within 108 years from formation. The weak bimodality is observationally based on the dependence of the rates with the host galaxy Star Formation Rate (SFR), while the strong one on the different rates in radio-loud and radio-quiet early-type galaxies. We review the evidence for these bimodalities. Finally, we estimate the fraction of SNe which are missed by optical and near-IR searches because of dust extinction in massive starbursts.
Keywords:
Supernova ratesClassification:
97.60.Bw1 Introduction
The supernova (SN) rates in different types of galaxies give strong informations about the progenitors. For example, soon after the introduction of the distinction between “type I” and “type II” SNe (15), 22 pointed out that type IIs are frequent in late type galaxies “which suggest their affiliation with Baade’s population I”. On the contrary, type Is, are the only type observed in elliptical galaxies and this fact ”suggests that they occur among old stars”. This conclusion is still often accepted, even if it is now known not to be generally valid: first, SN Ib/c were included in the broad class of “type I” SNe, and, second, also a significant fraction of SNe Ia are known to have young progenitors.

2 The weak bimodality in type Ia SNe
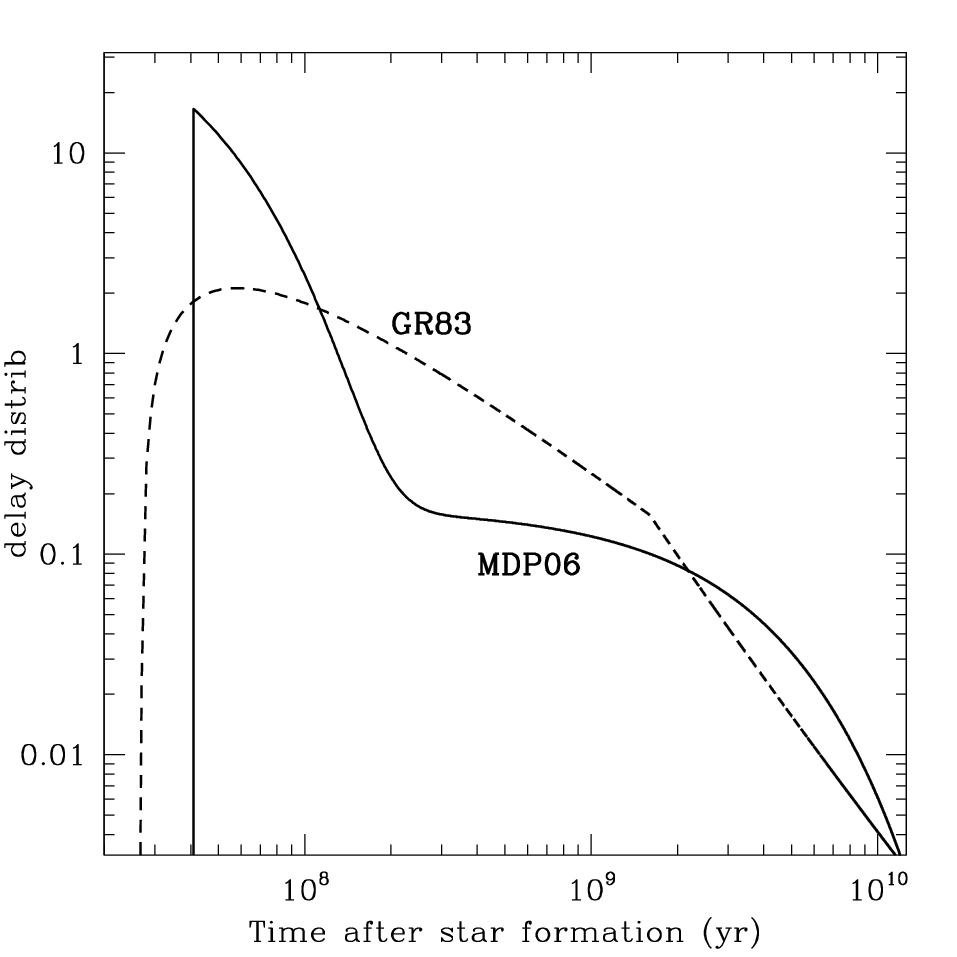
In 1983, 5 showed that the canonical binary star models for type Ia SNe naturally predict that these systems explode from progenitors of very different ages, from a few 107 to 1010 years. The strongest observational evidence that this is the case was provided by 10 who analyzed the SN rate per unit stellar mass in galaxies of all types. They found that the bluest galaxies, hosting the highest Star Formation Rates (SFRs), have SN Ia rates about 30 times larger than those in the reddest, quiescent galaxies. The higher rates in actively star-forming galaxies imply that a significant fraction of SNe must be due to young stars, while SNe from old stellar populations are also needed to reproduce the SN rate in quiescent galaxies. This lead 10 to introduce the simplified two component model for the SN Ia rate (a part proportional to the stellar mass and another part to the SFR). These results were later confirmed by 21, while 19, 14 and 2 successfully applied this model to explain the chemical evolution of galaxies and galaxy clusters. A more accurate description is based on the Delay Time Distribution (DTD), which is found to span a wide range of delay time between a few to a few years (11). The presence of a strong observational result and the agreement with the predictions of several models (see also 6) make this conclusion very robust.
3 The strong bimodality in type Ia SNe
4 studied the dependence of the SN Ia rate in early-type galaxies on the radio power of the host galaxies, and concluded that the higher rate observed in radio-loud galaxies is due to minor episodes of accretion of gas or capture of small galaxies. Such events result in both fueling the central black hole, producing the radio activity, and in creating a new generation of stars, producing the increase in the SN rate. This effect can be used to derive information on the DTD of type Ia SNe once a model of galaxy stellar population is introduced.


The difference between radio-loud and radio-quiet galaxies can be reproduced by the model of early-type galaxy shown in the right panel of figure 2: most of the stars are formed in a remote past, about years ago, while a small minority of stars are created in a number of subsequent bursts. A galaxy appears radio-loud when is observed during the burst, radio-faint soon after, and radio-quiet during the quiescent inter-burst period. The abundance ratio between radio-quiet and radio-loud galaxies, about 0.1 in our sample, means that the duty cycle of the burst events is about 10%. As the duration of the radio-loud phase is about 108 years, in 1010 years the early-type galaxies are expected to have experienced 10 small bursts, i.e., 1 every 109 years and lasting for about years.
This model naturally explains the fact that radio-loud and radio-quiet early-type galaxies have very similar (B–K) color, a sensitive indicator of star formation and stellar age. This is shown in the left panel of Fig. 2, where the two color distributions are compared. Only a small difference in the median of the two distributions might be present at any mass, i.e., the radio-loud galaxies appear to be 0.03-0.06 mag bluer, and this could be the effect of last on-going burst of star formation.
The amount of mass in younger stars can be estimated from the (B–K) color, that is consistent with the value of (B–K)4.1 typical of old stellar populations. By using the 1 model, we obtain that no more than 3% of stellar mass can be created in the 10 bursts (0.3% of mass each) if we assume negligible extinction, otherwise the predicted color would be too blue. The maximum mass in new stars can reach 5% assuming an average extinction of the new component of . More details will be given in a forthcoming paper.
This model predicts that traces of small amounts of recent star formation should be present in most of the local early-type galaxies. This is actually the case: most of them show very faint emission lines (18), tidal tails (23), dust lanes (3), HI gas (16), molecular gas (24), and very blue UV colors (20).
Using this model with a total fraction of new stars of 3%, we derive the results shown in figure 3. We see that the theoretical models by 5 and 13, while giving a good description of the rates displayed in figure 1, predicts too few SNe in the first years (about 11%) to accurately fit figure 3. The observed rates can be reproduced only by adding a “prompt” component (in this case modeled in terms of an exponentially declining distribution with 0.03 Gyr) to a “tardy” component (an other declining exponential with 3 Gyr), each one comprising 50% of the total number of events.
It should be noted that this strong bimodality is based on a small number of SNe (21) in early-type galaxies, and the results of oncoming larger SN searches are needed to confirm (or discard) this result.

4 Evolution of the SN rate with redshift
A related issue is how the rates measured in the local universe and discussed above are expected to evolve with redshift. The usual approach is to start from the integrated cosmic star formation history and obtain the rates by using some assumptions on progenitors (for core-collapse SNe) and on explosion efficiency and DTD (for SN Ia, see 10 for a discussion). Near-infrared and radio searches for core-collapse supernovae in the local universe (8, 9, 7) have shown that the vast majority of the events occurring in massive starbursts are missed by current optical searches because they explode in very dusty environments. Recent mid- and far-infrared observations (see 17 and references therein) have shown that the fraction of star-formation activity that takes place in very luminous dusty starbursts sharply increases with redshift and becomes the dominant star formation component at z0.5. As a consequence, an increasing fraction of SNe are expected to be missed by high-redshift optical searches. By making reasonable assumptions on the number of SNe that can be observed by optical and near-infrared searches in the different types of galaxies (see 12 for details) we obtain the results shown in figure 4. We estimate that 5–10% of the local core-collapse (CC) SNe are out of reach of the optical searches. The fraction of missing events rises sharply toward z=1, where about 30% of the CC SNe will be undetected. At z=2 the missing fraction will be about 60%. Correspondingly, for type Ia SNe, our computations provide missing fractions of 15% at z=1 and 35% at z=2. Such large corrections are crucially important to compare the observed SN rate with the expectations from the evolution of the cosmic star formation history, and to design the future SN searches at high redshifts.


References
- Cited by: §3.
- Cited by: §2.
- Cited by: §3.
- Cited by: §3.
- Cited by: §2, Figure 3, §3.
- Cited by: §2.
- Cited by: §4.
- Cited by: §4.
- Cited by: §4.
- Cited by: Figure 1, §2, §4.
- Cited by: §2, Figure 3.
- Cited by: Figure 4, §4.
- Cited by: §3.
- Cited by: §2.
- Cited by: §1.
- Cited by: §3.
- Cited by: §4.
- Cited by: §3.
- Cited by: §2.
- Cited by: §3.
- Cited by: §2.
- Cited by: §1.
- Cited by: §3.
- Cited by: §3.
References
- Minkowski (1941) R. Minkowski, 1941, PASP, 53, 224
- van den Bergh (1959) S. van den Bergh, 1959, AnAp, 22, 123
- Greggio & Renzini (1983) L. Greggio & A. Renzini, 1983, ApJ, 118, 217
- Mannucci et al. (2005) F. Mannucci, et al., 2005, A&A, 433, 807
- Sullivan et al. (2006) M. Sullivan et al., 2006, ApJ, 648, 868
- Scannapieco & Bildsten (2005) E. Scannapieco & L. Bildsten, 2005, ApJ, 629, L85
- Matteucci et al. (2006) F. Matteucci et al., 2006, MNRAS, 372, 265
- Calura et al. (2007) F. Calura, F. Matteucci, & P. Tozzi, 2007, MNRAS, in press (astro-ph/0702714)
- Mannucci et al. (2006) F. Mannucci, M. Della Valle & N. Panagia, 2006, MNRAS, 370, 773
- Greggio (2005) L. Greggio, 2005, A&A, 441, 1055
- Della Valle et al. (2005) M. Della Valle et al., 2005, ApJ, 629, 750
- Bruzual & Charlot (2003) G. Bruzual & S. Charlot, 2003, MNRAS, 341, 33
- Sarzi et al. (2006) M. Sarzi et al., 2006, MNRAS, 366, 1151
- van Dokkum (2005) P. van Dokkum, 2005, AJ, 130, 264
- Colbert et al. (2001) J. W. Colbert et al., 2001, AJ, 121, 808
- Morganti et al. (2006) R. Morganti et al., 2006, MNRAS, 371, 157
- Welch & Sage (2003) G. A. Welch & L. J. Sage, 2003, ApJ, 584, 260
- Schawinski et al. (2007) K. Schawinski et al., 2007, ApJ, in press (astro-ph/0601036)
- Matteucci & Recchi (2001) F. Matteucci & S. Recchi, 2001, ApJ, 558, 351
- Maiolino et al. (2002) R. Maiolino et al., 2002, A&A, 389, 84
- Mannucci et al. (2003) F. Mannucci et al., 2003, A&A, 401, 519
- Lonsdale et al. (2006) C. J. Lonsdale et al., 2006, ApJ, 647, 185
- Pérez-González et al. (2005) P. G. Pérez-González et al., 2005, ApJ, 630, 82
- Mannucci et al. (2007) F. Mannucci, M. Della Valle & N. Panagia, 2007, MNRAS, in press (astro-ph/0702355)